
I. INTRODUCTION
There is substantial interest in shape memory alloys (SMAs) that can be operated at elevated temperatures, and SMAs with phase transformation temperatures higher than 100 °C are referred to as high-temperature shape memory alloys (HTSMAs). Still, these materials are only used for niche applications in industry. Today, most of the HTSMAs are based on the nickel–titanium system, where the phase transformation temperature has been shifted up by alloying with ternary elements, such as Pt, Reference Otsuka and Ren1–Reference Noebe, Gaydosh, Padula, Garg, Biles, Nathal and Armstrong5 Pd, Reference Otsuka and Ren1–Reference Van Humbeeck4,Reference Atli, Karaman and Noebe6 and Hf. Reference Meng, Zheng, Cai and Zhao7–Reference Canadinc, Trehern, Oscan, Hayrettin, Karakoc, Karaman, Sun and Chaudhry11 The current approaches either call for high amounts of expensive noble elements or often result in systems with poor workability. Reference Meng, Zheng, Cai and Zhao7,Reference Besseghini, Villa and Tuissi8 It should be noted, however, that for Ni–Ti–Hf HTSMAs the workability issue can be overcome by appropriate processing, and even thin wires can be produced as successfully demonstrated lately. Reference Canadinc, Trehern, Oscan, Hayrettin, Karakoc, Karaman, Sun and Chaudhry11
Lately, titanium–tantalum has been identified as a system that features substantial transformation strains from a martensitic phase transformation occurring at elevated temperature. Reference Buenconsejo, Kim, Hosoda and Miyazaki12,Reference Zhang, Rynko, Frenzel, Somsen and Eggeler13 Moreover, Ti–Ta alloys are composed of reasonably priced constituents and demonstrate good workability. The early alloys proposed had a tantalum content of 30–40 at.%. In these alloys, the high-temperature β-phase (bcc) transforms to the low-temperature α″-phase (orthorhombic). Reference Buenconsejo, Kim, Hosoda and Miyazaki12,Reference Buenconsejo14 However, Buenconsejo and co-workers have demonstrated early on that in binary Ti–Ta alloys a hexagonal, so-called ω-phase can form in the temperature regime between 100 and 400 °C. Reference Buenconsejo14,Reference Hickman15 The formation of the ω-phase stabilizes the β phase, which in turn results in a loss of the functional properties. Reference Hickman15,Reference Murray16 Thermomechanical loading at elevated temperatures has been reported to speed up functional degradation. Reference Niendorf, Krooß, Somsen, Rynko, Paulsen, Batyrshina, Frenzel, Eggeler and Maier17 Interestingly, a short thermal treatment at 600 °C can be used to dissolve the ω-phase and restore the functional properties. Reference Niendorf, Krooß, Batyrsina, Paulsen, Motemani, Ludwig, Buenconsejo, Frenzel, Eggeler and Maier18,Reference Niendorf, Krooß, Batyrsina, Paulsen, Frenzel, Eggeler and Maier19 Such a heat treatment may, however, not always be possible in actual applications, and thus, other approaches are needed as well. One is to use ternary systems to delay formation of the ω-phase. Reference Buenconsejo14,Reference Buenconsejo, Kim and Miyazaki20 On the other hand, the phase transformation temperatures are known to increase upon decreasing the tantalum content, Reference Buenconsejo14,Reference Buenconsejo, Kim and Miyazaki20 but the consequences of such an approach on microstructural stability have not be explored yet. Thus, the objective of the present study was to shed light on the phase transformation behavior and the microstructural evolution upon thermomechanical loading in a low tantalum (25 at.%) binary alloy. In fact, as demonstrated in the following, the increase in phase transformation causes a substantial change in damage mechanisms, which makes this alloy substantially different from the previously studied higher tantalum content system. Specifically, an intermediate temperature regime exists for this alloy were functional degradation can be fully suppressed.
II. MATERIALS AND METHODS
Samples for thermomechanical fatigue tests with a nominal gauge length of 30 mm and a cross section of 2 × 1.5 mm were prepared from polycrystalline Ti–25Ta (in at.%) using electrical discharge machining (EDM). Ti-25Ta block-shaped ingots with a nominal weight of 45 g were prepared by arc melting from high purity raw materials purchased from Hauner Metallische Werkstoffe, Röttenbach, Germany. The ingots were remelted 15 times to ensure good initial chemical homogeneity. For further details on the melting process see Ref. Reference Zhang, Rynko, Frenzel, Somsen and Eggeler13. The ingots were then subjected to homogenization annealing at 1100 °C for 25 h under vacuum. This process minimized microscopic heterogeneities that result from dendritic solidification. After annealing, sheets with a final thickness of 2 mm were prepared from the homogenized ingots by rolling. In the first rolling steps, which were conducted after preheating to 800 °C, the thickness of the material was reduced from 17 to 7.7 mm. The average degree of deformation (φ) was close to 0.2. The samples were subjected to an intermediate annealing at 800 °C for 10 min between each two rolling steps. After reaching a thickness of 7.7 mm, the materials were further processed by cold rolling. A final thickness of 2 mm was established after 9 rolling passes, and φ was 0.37 in the last deformation step. Similar to the case of hot rolling, the materials were subjected to intermediate annealing at 800 °C for 10 min between each two cold rolling passes. Finally, fully recrystallized microstructures were obtained after annealing at 900 °C for 10 min followed by water quenching. Further details on thermomechanical treatments are given in Refs. Reference Zhang, Rynko, Frenzel, Somsen and Eggeler13 and Reference Rynko, Marquardt, Paulsen, Frenzel, Somsen and Eggeler21.
Phase transformation temperatures were determined using differential scanning calorimetry (DSC) using a TA instruments DSC2920 cell (TA Instruments, New Castle, Delaware). The DSC tests were carried out in the temperature interval between 20 °C and 620 °C with a heating and cooling rate of 20 °C/min on the recrystallized samples prior to testing. A total of 12 ingots were analyzed by DSC, and the variation between the DSC curves was found to be negligible, which indicates that the process conditions were well controlled. This is important as shape memory behavior is known to be very sensitive to both variations in chemical composition and processing parameters.
The thermomechanical fatigue tests were performed using an electrodynamic test system (MTS Acumen, MTS Systems Corporation, Eden Prairie, Minnesota) equipped with a 3 kN load cell. The samples were conductively heated, and cooling of the samples was realized by compressed air. Temperature in gauge length was measured an Optris PI640 infrared camera (Optris GmbH, Berlin, Germany). Prior to testing, all samples were mechanically ground and polished to remove the EDM-affected surface layer. To check reproducibility of the strain–temperature response, a minimum of five samples were used for each testing condition. The variation in thermomechanical response were found to be negligible, and the strain–temperature curves shown in Figs. 2(a)–2(c) are representative for the given material state.
The microstructural changes induced by the thermomechanical fatigue tests were investigated using optical microscopy, scanning electron microscopy (SEM) and transmission electron microscopy (TEM). For metallography, the specimens were mechanically ground and polished, followed by vibropolishing for 12 h with Eposil M11 (ATM GmbH, Mammelzen, Germany) using a Buehler Vibromet 2 (Buehler, Lake Bluff, Illinois). A Zeiss SUPRA 55VP SEM (Carl Zeiss AG, Oberkochen, Germany), equipped with a Bruker energy dispersive X-ray (EDX) analyzer (Bruker Corporation, Billerica, Massachusetts), was used to characterize the microstructures at higher resolution. The phases present prior to and after the thermomechanical fatigue tests were determined by X-Ray diffraction (XRD) using a Cu Kα source. The TEM analyses were conducted using a Tecnai F20 G2 Supertwin FEG TEM (FEI, Hillsboro, Oregon) operated at 200 kV. The TEM was equipped with an EDX and high angle dark-field detector (HAADF) detector. The TEM foils were prepared using focused ion beam preparation in an FEI Quanta 200 3D Dual Beam SEM (FEI, Hillsboro, Oregon). To analyze the chemical composition of specific locations with high lateral resolution, the HAADF detector was used in combination with the scanning transmission electron microscope (STEM) mode. Bright-field, high-resolution TEM and fast Fourier transform patterns were used for local microstructural characterizations.
III. RESULTS AND DISCUSSION
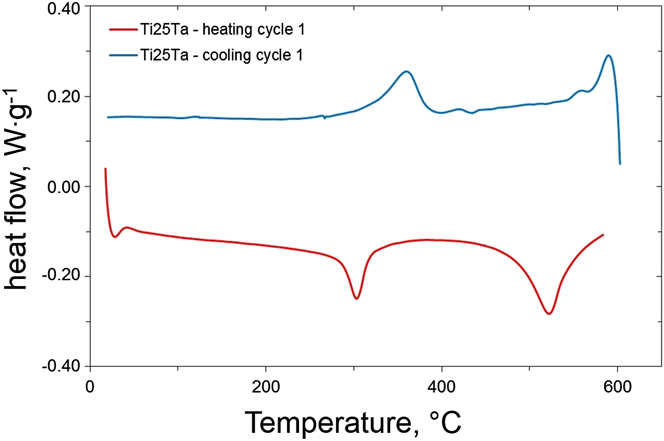
The DSC curve in Fig. 1 represents the first transformation cycle of the sheet material. The phase transformation temperatures for the cooling and first heating peak determined fit with those expected based on the literature. Reference Buenconsejo, Kim, Hosoda and Miyazaki12,Reference Buenconsejo14,Reference Kim, Fukushima, Buenconsejo, Nam and Miyazaki22 Interestingly, there is a clear sign for another transformation (peaks beyond 520 °C). It is well known that there can be a so-called “first cycle effect”. Reference Siegert, Neuking, Mertmann and Eggeler23 However, this is not very likely in the present case as the dislocations which could provide for such an effect should have been essentially wiped out by the final 900 °C recrystallization treatment. Thus, this additional peak might indicate a potential lack of microstructural stability instead. In fact, it is well known that the β-phase is not stable in the temperature range from 250 °C to 600 °C. Reference Massalski, Okamato, Subramanian and Kacprzak24 Specifically, the formation of the ω-phase has been reported to occur between 100 °C and 400 °C, which in turn results in functional degradation. Reference Hickman15,Reference Niendorf, Krooß, Somsen, Rynko, Paulsen, Batyrshina, Frenzel, Eggeler and Maier17,Reference Massalski, Okamato, Subramanian and Kacprzak24 At temperatures exceeding 400 °C, the α-phase can form as well. Reference Massalski, Okamato, Subramanian and Kacprzak24–Reference Hickman26
DSC charts at heating and cooling rates of 20 °C/min for recrystallized Ti–25Ta prior to thermomechanical cycling.

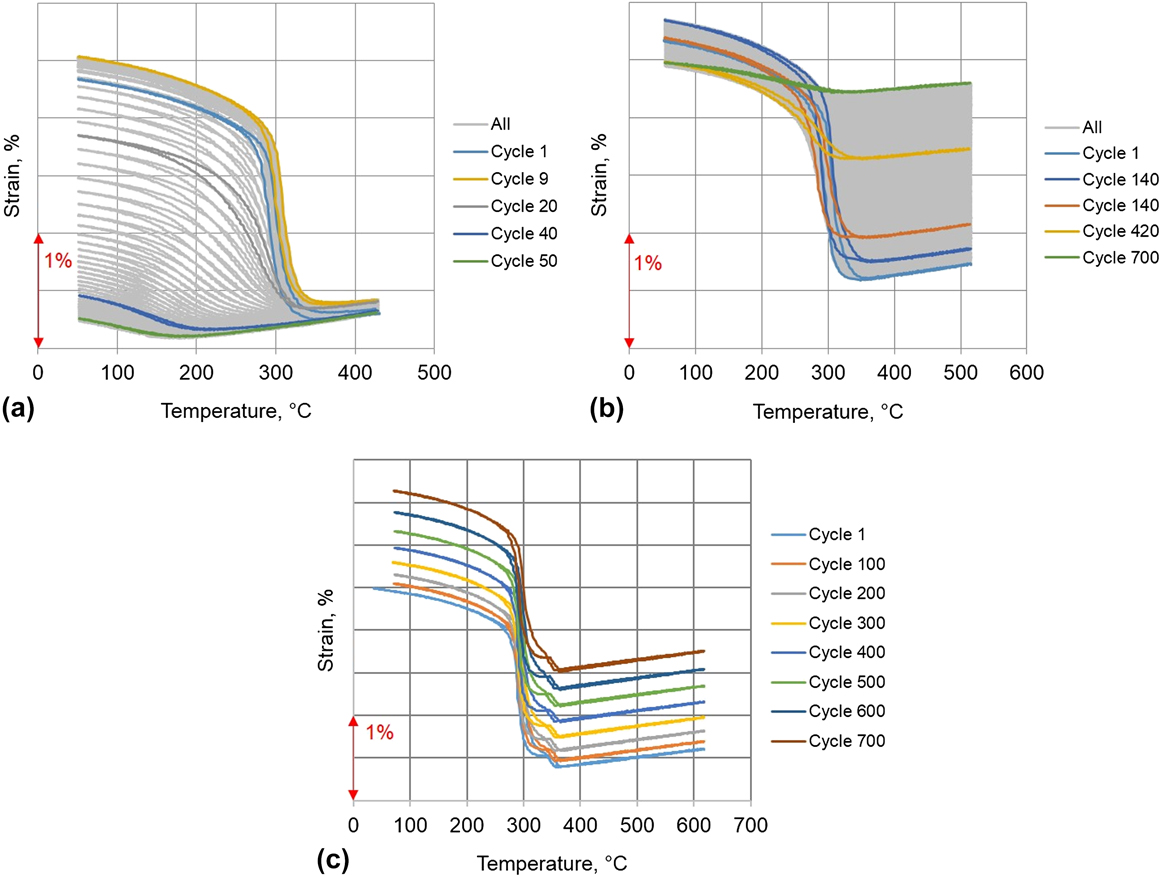
To shed light on the relationship between the microstructural changes and functional behavior, thermomechanical fatigue tests were performed in three different temperature intervals. The first one (40–430 °C) covered the regime were the ω-phase might form. The second interval (40–520 °C) was chosen to include the extra peak seen in the DSC data (Fig. 1). The third set of tests spanned the range from 40 °C to 620 °C to allow for dissolution of the ω-phase. In each case, the initial transformation strain under a superimposed stress of 100 MPa was about 2 pct (Fig. 2). This is higher than the value (1.3 pct) reported previously for Ti–30Ta, Reference Niendorf, Krooß, Somsen, Rynko, Paulsen, Batyrshina, Frenzel, Eggeler and Maier17–Reference Niendorf, Krooß, Batyrsina, Paulsen, Frenzel, Eggeler and Maier19 which might indicate easier microstructural rearrangement. Moreover, the phase transformation is occurring at higher temperature than in Ti–30Ta (Ms = 173 °C, Af = 250 °C) Reference Rynko27 due to the lower tantalum content. Obviously, this would make the material more attractive for the envisaged elevated temperature applications. However, compared to Ti–30Ta, Reference Niendorf, Krooß, Batyrsina, Paulsen, Frenzel, Eggeler and Maier19 the Ti–25Ta alloy displays more rapid functional degradation [Fig. 2(a)] in the low maximum temperature tests.
Strain–temperature curves obtained for Ti–25Ta during thermomechanical cycling with heating and cooling rates of 20 °C/s at 100 MPa between (a) 40–430 °C, (b) 40–520 °C, and (c) 40–620 °C; in the latter case, the superimposed stress was reduced to 0 MPa in the austenitic regime, see main text for details.

Figure 2 also demonstrates that the strain–temperature response in the three different temperature ranges used is substantially different. In case of a maximum temperature of 430 °C [Fig. 2(a)], the rapid functional degradation is prominent, and transformation is reduced to about 0.5 pct after just 50 cycles. There is also a quite pronounced shift of transformation temperatures toward lower temperatures. As it is well known, the phase transformation temperatures decrease with increasing tantalum content Reference Buenconsejo, Kim, Hosoda and Miyazaki12 ; this hints at a change in chemical composition of the transformation matrix. Specifically, the formation of a titanium-rich α-Ti-phase, which itself does not show a martensitic transformation, would result in an increase in tantalum content of the matrix and the observed shift in the macroscopically observed phase transformation temperature. In fact, the formation of a α-Ti-phase in Ti–Ta alloys has been reported earlier, Reference Niendorf, Krooß, Somsen, Rynko, Paulsen, Batyrshina, Frenzel, Eggeler and Maier17,Reference Rynko, Marquardt, Paulsen, Frenzel, Somsen and Eggeler21 and Albrecht et al. Reference Albrecht, Duering and Richter28 have shown that α-Ti-phase forms under tensile stresses in β-Ti alloys at temperatures around 400 °C. At the same time, formation of the ω-phase in the austenite is expected in the temperature range from 100 °C to 400 °C. Reference Buenconsejo, Kim, Hosoda and Miyazaki12,Reference Buenconsejo14
At first glance, one would expect that with increasing maximum temperature, microstructural instability increases, and thus, functional degradation should occur more rapidly. However, as demonstrated in Fig. 2(b), the change in stress-temperature response with the number of cycles is substantially less pronounced. Moreover, the hysteresis curves essentially change on the high-temperature side in Fig. 2(b). In other words, functional degradation now occurs predominantly in the austenitic phase. This can be partly attributed to enhanced dislocation activity in the high-temperature part of the test. Recent studies on Ti–30Ta have already demonstrated substantial dislocation activity to occur at temperatures as low as 400 °C in thermomechanical tests. Reference Niendorf, Krooß, Somsen, Rynko, Paulsen, Batyrshina, Frenzel, Eggeler and Maier17 This not only affects strain–temperature hysteresis Reference Atli, Karaman, Noebe and Gaydosh29,Reference Dadda, Maier, Karaman and Chumlyakov30 but could trigger a decomposition into Ti-rich and Ta-rich regions. This would explain the shift of the degradation to the high-temperature side but not obvious retardation of the degradation kinetics. In this context, one should recall that the maximum temperature of the tests shown in Fig. 2(b), coincides with the extra peak seen in the DSC chart (Fig. 1). Moreover, Fig. 2(b) indicates that despite the substantial decrease in transformation strain during cycling, the associated transformation temperature hardly change at all. An explanation would be (partial) dissolution of the α- and/or the ω-phase, such that the matrix returns to its initial chemical composition. Alternatively, the increase in dislocation density could result in an increase in elastic strain energy. Reference Atli, Karaman, Noebe and Gaydosh29–Reference Grossmann, Frenzel, Sampath, Depka and Eggeler32 This effect could stabilize transformation temperatures despite the change in chemical composition of the matrix as suggested for Ti–30Ta earlier. Reference Niendorf, Krooß, Somsen, Rynko, Paulsen, Batyrshina, Frenzel, Eggeler and Maier17
To avoid excessive plastic deformation in the high-temperature part of the curve, the thermomechanical experiments with a maximum temperature of 620 °C [Fig. 2(c)] were conducted in a slightly different way. The tests were started with a superimposed stress of 100 MPa. As soon as the transformation from martensite to austenite had occurred, the stress was reduced to 0 MPa within 1 s while heating continued up to 620 °C. Upon cooling, the stress of 100 MPa was reapplied shortly before the onset of the back transformation. In curves shown in Fig. 2(c), this unloading and reloading results in the little extra hump around 350 °C. Interestingly, there is only an upward shift of the hysteresis loops, but the overall transformation strain of about 2 pct remained constant. For sake of comparison with the data in Fig. 2(b), only the first 700 cycles are shown in Fig. 2(c). However, transformation strain did not change significantly up to 2000 cycles, when the sample finally failed by structural fatigue (cyclic crack growth).
As the high maximum temperature of 620 °C was chosen based on the second peak position in the DSC chart (Fig. 1), it can be assumed that the constant transformation strain seen in the thermomechanical fatigue tests [Fig. 2(c)] indicates that the ω- and/or the Ti-rich α-phase get dissolved during the high-temperature part of the curve. At least for Ti–30Ta it was shown earlier that a short high-temperature excursion suffices to dissolve the ω-phase. Reference Niendorf, Krooß, Batyrsina, Paulsen, Motemani, Ludwig, Buenconsejo, Frenzel, Eggeler and Maier18,Reference Niendorf, Krooß, Batyrsina, Paulsen, Frenzel, Eggeler and Maier19 The slight shift of the transformation temperature toward higher values [Fig. 2(c)] can be attributed to formation of Ta-rich phases which affects the matrix composition and thus, the corresponding phase transformation temperature. Reference Buenconsejo, Kim, Hosoda and Miyazaki12,Reference Buenconsejo, Kim and Miyazaki20,Reference Al-Zain, Sato, Kim, Hosoda, Nam and Miyazaki33
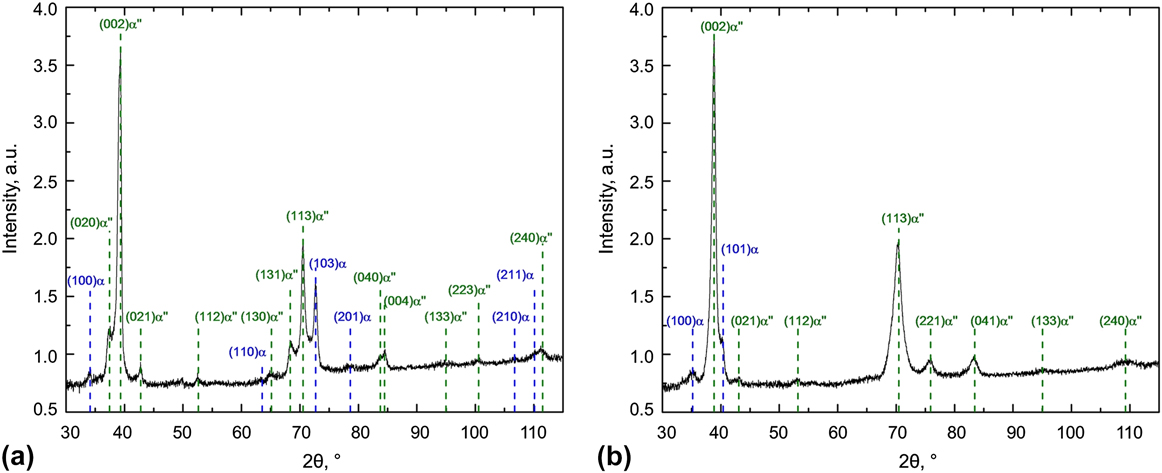
To better separate the individual contributions to the overall macroscopic change in strain–temperature response, the microstructures present after thermomechanical fatigue were characterized by XRD and electron microscopy. Figure 3 shows XRD data obtained from the thermomechanically fatigued samples. In case of the low maximum temperature test [430 °C, Fig. 2(a)], the X-ray diffractogram shows the presence of the α″-phase and the α-phase. As the latter is Ti-rich, Reference Rynko, Marquardt, Paulsen, Frenzel, Somsen and Eggeler21 the tantalum content in the bulk increases and the phase transformation temperatures are shifted to lower values [Fig. 2(a)]. The ω-phase is not seen in Fig. 3(a), but hard to detect by XRD as the precipitates are very fine. Reference Niendorf, Krooß, Batyrsina, Paulsen, Frenzel, Eggeler and Maier19 Thus, the presence of the ω-phase cannot be excluded. Formation of the ω-phase has been discussed as an important contribution to the decrease in phase transformation temperature. Reference Buenconsejo, Kim, Hosoda and Miyazaki12,Reference Niendorf, Krooß, Batyrsina, Paulsen, Frenzel, Eggeler and Maier19 In fact, for Ti–30Ta thermomechanically cycled between 40 °C and 400 °C, only the formation of the ω-phase was reported but no α-phase. This can be explained based on the difference in Ta content. Tantalum shows some solubility in the α-phase Reference Peters, Hemptenmacher, Kumpfert, Leyens, Peters and Leyens34,Reference Boyer, Welsch and Collings35 but is a β-stabilizer. Reference Peters, Hemptenmacher, Kumpfert, Leyens, Peters and Leyens34,Reference Bieler, Trevino, Zeng, Bassani, Liedl and Wyder36 Hence, the higher the tantalum content, the less probable is the formation the α-phase, and Ti–25Ta (α- and ω-phase formation) and Ti–30Ta (ω-phase formation only) become quite different in this respect.
XRD profiles showing relative intensities at room temperature for Ti–25Ta (a) after a thermomechanical fatigue test conducted at 100 MPa between (a) 40 °C and 430 °C and (b) 40 °C and 520 °C; heating and cooling rates were 20 °C/s.

The XRD data shown in Fig. 3(b) demonstrate that both the α-phase and the α″-phase were still present after the thermomechanical test conducted with higher maximum temperature of 520 °C [Fig. 2(b)]. However, the α-phase content is lowered, which indicates that part of the α-phase has been dissolved during the high-temperature part of the test, which explains the lower functional degradation rate in this case [see Figs. 2(a) and 2(b)].
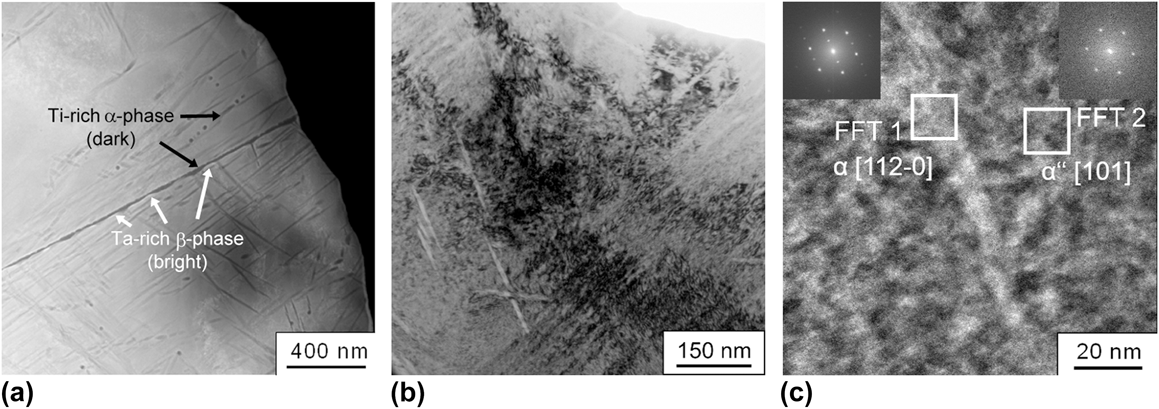
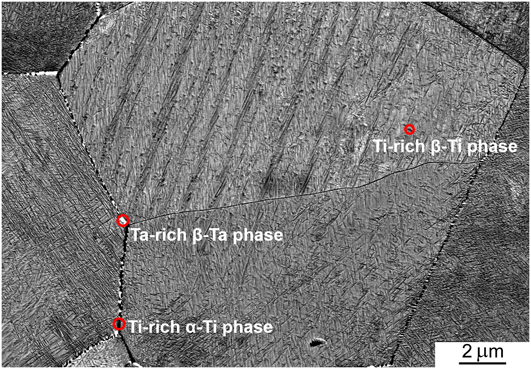
The TEM studies substantiated the above interpretations and provided further insight. The EDX analysis [Fig. 4(a)] clearly demonstrated the presence of Ti-rich phases. In addition, there are bright appearing, Ta-rich β-phases (bcc), which are known to form preferentially at grain boundaries. Reference Rynko, Marquardt, Paulsen, Frenzel, Somsen and Eggeler21,Reference Rynko27 Because of the small size and low volume fraction, these are not captured in the XRD data [Fig. 3(a)]. By contrast, the needle-like Ti-rich α-phase which is seen within the grains (Fig. 4) is already detectable by XRD [Fig. 3(a)]. Thus, functional degradation under these conditions appears to be governed by β-phase formation at the grain boundaries and needle-like α-phase within the grains.
TEM images of Ti–25Ta after thermo-mechanical cycling between 40–430 °C under a superimposed stress of 100 MPa: (a) HAADF STEM image, (b) bright-field image, and (c) two times filtered high resolution detail showing the needle-like precipitation (α-phase) and the surrounding matrix (α″-phase).

The material contrast used for the back-scattered electron image in Fig. 5 clearly demonstrates the decomposition in the Ti-rich α-phase (darker) and the Ta-rich β-Ta phase (brighter). In addition, fine needle-like precipitates are apparent within the grains. In creep tests conducted on Ti–30Ta, similarly appearing precipitates have been observed for tests conducted at 500 °C and 120 MPa, i.e., test parameters close to the one used for thermomechanical experiments in the present study. These precipitates were identified as Ti-rich β-Ti, Reference Rynko, Marquardt, Paulsen, Frenzel, Somsen and Eggeler21,Reference Rynko27 which can transform back to α″-martensite. However, the transformation temperatures would be very high, as this phase contains little tantalum. Thus, the Ti-rich β-Ti will be essentially retained upon cooling to 40 °C, which in turn results in loss of transformation strain. The overall kinetics of the process are, however, slower than in the 40–430 °C test.
Back-scattered electron image of Ti–25Ta after thermomechanical cycling between 40–520 °C under superimposed stress of 100 MPa with heating and cooling rates of 20 °C/s.

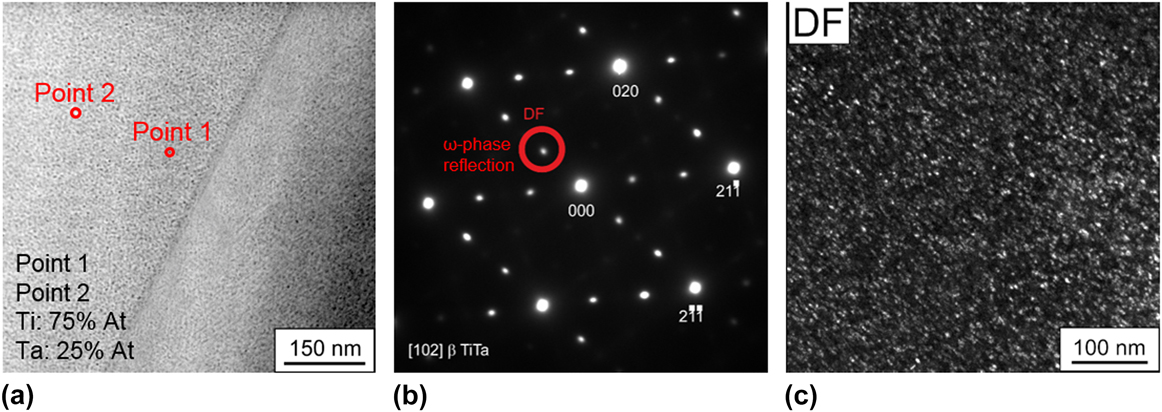
The TEM analysis of the sample thermomechanically fatigued between 40 °C and 520 °C also demonstrated the presence of the ω-phase. This phase is very small and hard to see in bright-field images. In annular dark-field mode, the contrast is improved [Fig. 6(a)] and the selected area diffraction pattern [Fig. 6(b)] clearly demonstrate the extra reflections from the ω-phase that has precipitated [Fig. 6(c)] with the β-matrix. This process hinders back transformation, and thus, functional degradation sets in. Moreover, the presence (and dissolution) of the ω-phase seems to fit with the extra peak observed in the DSC curves (Fig. 1). This rationale, however, requires additional microstructural studies.
TEM images of Ti–25Ta after thermomechanical cycling between 40 °C and 520 °C under a superimposed stress of 100 MPa: (a) annular dark-field image in STEM mode, (b) selected area diffraction pattern for [102]β TiTa showing reflections from the ω-phase, and (c) corresponding dark-field image.

In a previous study on Ti–30Ta, it has been demonstrated that a short heat treatment at 600 °C allows for a dissolution of the ω-phase. Reference Niendorf, Krooß, Batyrsina, Paulsen, Motemani, Ludwig, Buenconsejo, Frenzel, Eggeler and Maier18,Reference Niendorf, Krooß, Batyrsina, Paulsen, Frenzel, Eggeler and Maier19 Based on the data shown in Fig. 6, the maximum temperature of 520 °C is not high enough to provide for this effect in the thermomechanical fatigue tests conducted on Ti–25Ta. Thus, functional degradation in Ti–25Ta for the 40–520 °C case can be attributed to the combined effects of α-Ti-phase and β-Ta-phase formation at the grain boundaries, precipitation of needle-like β-Ti-phase within the grains along with formation of ω-phase and enhanced dislocation activity in the high-temperature part of the test.
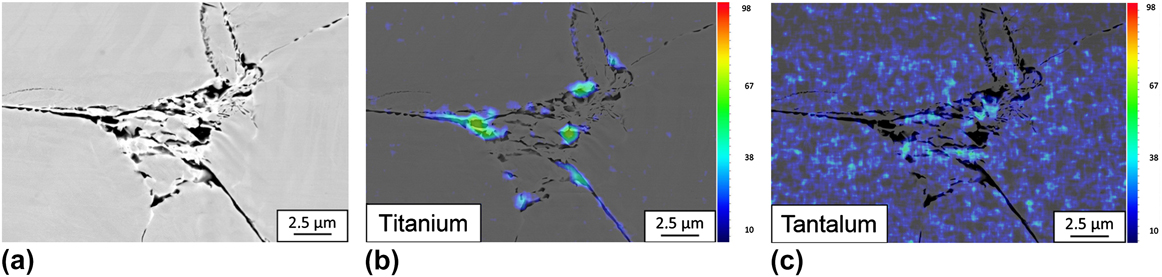
As demonstrated in Fig. 2(c), structural degradation is pronounced in the thermomechanical fatigue tests conducted on Ti–25Ta in the temperature range between 40 °C and 620 °C. In fact, the material failed by conventional fatigue crack nucleation and propagation. This substantial difference in behavior to the tests conducted with lower maximum test temperatures is again rooted in microstructure. In this case, the XRD data were not revealing accurate phase information as the peaks of the β- and α-phase almost coincide in the interesting regime for this alloy. Reference Rynko27 However, the SEM images shown in Fig. 7 clearly demonstrate that decomposition in Ti-rich [Fig. 7(b)] and Ta-rich [Fig. 7(c)] phases occur under these conditions as well. Given the higher maximum temperature, it is understandable that the effect is more pronounced than in the other test. More importantly, the decomposition clearly has started at the grain boundaries and triple points [Fig. 7(a)]. EDX analysis demonstrated up to 93 at.% Ti for the regions appearing dark in the SEM images and up to 36 at.% Ta for the bright ones. As the material still displayed an almost unchanged transformation strain after 700 cycles [Fig. 2(c)], it can be assumed that the material is essentially austenitic in the high-temperature part of cycle, but with locally Ti-rich and Ta-rich regions. In fact, EDX analysis revealed areas with a composition of Ti–25Ta, which explains the slight increase in transformation temperature seen upon cycling [Fig. 2(c)].
SEM images of Ti–25Ta after thermomechanical cycling between 40 °C and 620 °C under a superimposed stress of 100 MPa: (a) back-scattered electron image and corresponding elemental distribution map for (b) titanium and (c) tantalum.

Upon cooling, the chemical heterogeneity of the austenite results in the martensitic transformation to α″ with locally different Ti and Ta content. If the Ti content gets high enough, the transformation might get suppressed locally, and some of the Ti-rich phases seen at the grain boundaries should have formed this way.
As seen in Fig. 2(c), the upward shift in the hysteresis loops is small initially and then increases significantly. This shift is essentially due to conventional fatigue crack formation. These cracks started at the surface and propagated within the grains (not shown here). This indicates that the local decomposition observed at the grain boundaries (Fig. 7) does not play a significant role in this context. It is well known that Ti–Ta alloys are prone to high-temperature oxidation, Reference Vojtovich and Golovko37 and it appears that the oxidation-induced crack formation dominates in this case.
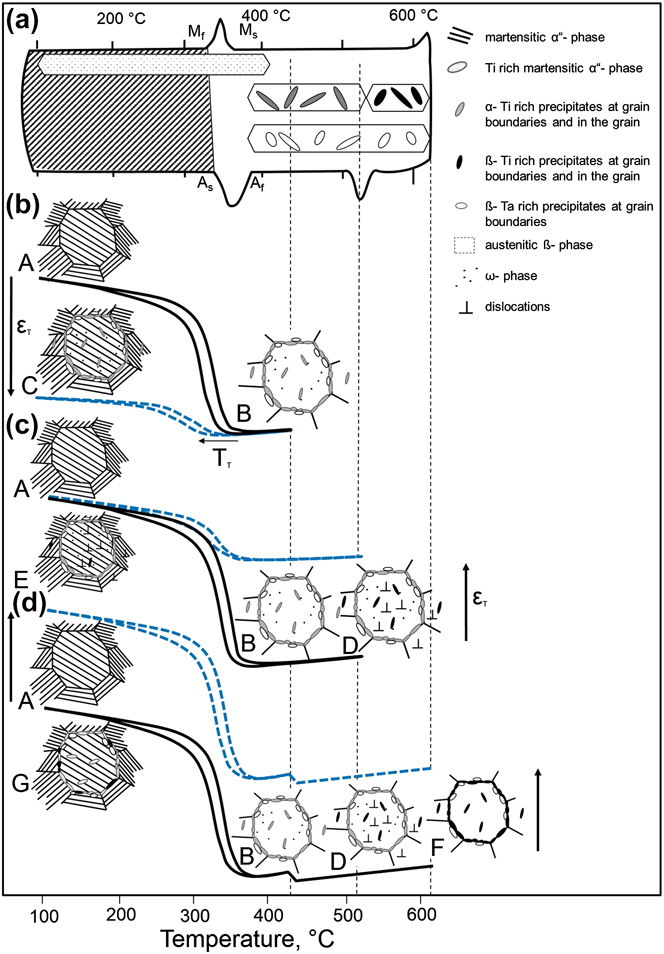
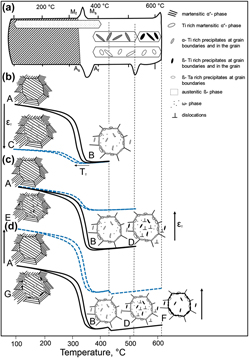
As detailed above, the microstructural evolution is quite complex in this system. Thus, the effect of temperature test regime on microstructural evolution along with the resulting changes in macroscopic strain–temperature response has been summarized in the schematic shown in Fig. 8. To ease interpretation a schematic DSC chart along with the key temperature regimes is shown in Fig. 8(a).
Schematic illustration of microstructural evolution that result in functional degradation of Ti–25Ta during thermomechanical cycling; (a) schematic DSC chart including the key microstructural features, (b), (c) and (d): corresponding strain-temperature hysteresis loops; see main text for details.

In each experiment, the test started with the material being in the martensitic state (marked by A in Fig. 8). Upon heating, the ω-phase is formed. The relevant temperature range for this process in Ti–Ta alloy is about 100–400 °C. Reference Buenconsejo, Kim, Hosoda and Miyazaki12,Reference Buenconsejo14 Starting at around 400 °C, α-phase formation sets in both at grain boundaries an in the grain interiors. In parallel to this Ti-rich phase, the Ta-rich β-phase forms at grain boundaries. Thus, at point B in Fig. 8(b), the bulk of the alloy is in the austenitic state, but there is ω-phase and α-phase in the grain interiors and α-phase and Ta-rich β-phase at the grain boundaries. For Ti–Zr alloys it has been reported that the α- and β-phase observed at the grain boundaries form by “consuming” β and ω. Reference Hickman15 A similar process might occur in Ti–25Ta as well. In fact, the formation of the α-phase upon dissolution of the ω-phase has been observed in Ti–30Ta upon heat treatment. Similarly, α-phase formation from ω-phase has been reported for Ti–Mo and Ti–Nb. Reference Hickman26
Upon cooling from 430 °C (point B), the detrimental phases ω, α-Ti, and β-Ta remain, and as the process is cyclically repeated, their volume fraction increases and rapid functional degradation sets in [point C in Fig. 8(b)]. As discussed above, the changes in matrix composition also cause a slight shift toward lower transformation temperatures as marked by the arrow in Fig. 8(b).
In case of the tests conducted up to the higher temperature of 520 °C [point D in Fig. 8(c)], the α-phase starts to transform to Ti-rich β. This process sets in around 500 °C in the grain interior and at about 520 °C also at the grain boundaries, and corresponds to the second peak in the DSC chart. This process appears to be mainly driven by temperature but not by cycling, as it has been reported for creep tests performed under similar test conditions. Reference Rynko, Marquardt, Paulsen, Frenzel, Somsen and Eggeler21,Reference Rynko27 Because of the combination of high temperature and superimposed stress, dislocation activity is enhanced as well. During cooling from point D, the ω-phase, the β-Ta, and α-Ti-phase at the grain boundaries and the dislocations all remain in the microstructure. Depending on their actual chemical composition the β-Ti precipitates in the grain interiors can transform to martensite or remain as well [point E in Fig. 8(c)]. As detailed above, these processes also result in functional degradation, but this time the effect is more pronounced on the high-temperature side of the loop [marked by εT in Fig. 8(c)].
The behavior in the modified test, where the external stress was not present in the high-temperature part of the cycle to curtail excessive plastic deformation, is sketched in Fig. 8(d). On heating, the detrimental ω-phase gets dissolved again and the α-Ti-phase transforms (partly) to β-Ti. In addition, dislocations can annihilate or rearrange. Upon cooling, the austenitic matrix, Ti-rich β-phase within the grain and at the grain boundaries and the β-Ta phase at the grain boundaries can all transform back to martensite. Depending on actual chemical composition, part of these may locally not transform. This effect is, however, only minor, and thus, functional degradation is not a key issue in this case. Given the high maximum temperature, oxidation becomes relevant instead and structural fatigue starts to govern fatigue life. As indicated by the arrows in Fig. 8(d), crack opening macroscopically results in an upward shift of the hysteresis loops.
Apparently, functional degradation can be minimized by appropriate temperature-time-profiles, but the high-temperature excursions needed will limit fatigue life. In case of the test shown in Fig. 8(d), the samples did not fail before 2000 cycles. As this will not suffice for many of the envisaged applications, research is underway to address oxidation behavior.
IV. CONCLUSIONS
The functional fatigue behavior of a Ti–25Ta shape memory alloy was studied under thermomechanical loading in different temperature regimes. The main results can be summarized as follows:
-
(1) The material shows a martensitic transformation at elevated temperatures (≈350 °C) with substantial transformation strain (≈2 pct) under a superimposed stress of 100 MPa.
-
(2) Functional degradation behavior does vary substantially with the maximum test temperature used in the thermomechanical test. For lower maximum test temperatures (T max ≈ 430 °C), formation of the ω-phase and local decomposition in Ti-rich and Ta-rich areas along with α-Ti formation are the dominant processes.
-
(3) As T max is increased further, the detrimental phases start to dissolve and functional behavior can be almost fully suppressed in thermomechanical test when T max substantially exceeds 520 °C as long as dislocation activity in the high-temperature part is not excessive.
-
(4) In thermomechanical fatigue tests with a T max of 620 °C, functional degradation could be essentially suppressed, but the samples finally failed beyond 2000 cycles by structural fatigue due to oxidation-induced crack formation.
ACKNOWLEDGMENT
Financial support by Deutsche Forschungsgemeinschaft within the Research Unit Program “Hochtemperatur-Formgedächtnislegierungen” (Contract nos. MA1175/34-2, LU1175/11-2, and NI1327/2-2) is gratefully acknowledged.