1. Introduction
The Clean Development Mechanism (CDM) of the Kyoto Protocol is a market-based provision that helps industrialized countries comply with their pledged emission limits by investing in greenhouse gas (GHG) abatement projects in developing or emerging economies. The stated objectives of the CDM are to facilitate reduction in global emissions at a lower cost and promote sustainable development through mobilization of private foreign direct investments (FDI) and technology transfer.Footnote 1 Critics contend that the CDM has not achieved its development objectives (Olsen, Reference Olsen2007). Still, with its dual objectives, the CDM has successfully attracted both industrialized (listed in Annex B of the Protocol) and developing (non-Annex B) countries.Footnote 2 The CDM portfolio has rapidly grown since its inception in 2003, with more than 10,000 projects hosted in more than 100 developing countries. However, a large majority of the projects are energy related and concentrated in a handful of emerging countries while many countries with large potentials for mitigation have attracted few projects.
The purpose of this paper is to examine the factors that influence the pattern of CDM project location as well as the resulting pattern of abatement activity. The first question we address is why some countries host CDM projects while others do not. The second question we address is what factors determine the extent of CDM project hosting by the developing countries. Understanding why countries participate in the program and distinguishing between the rate and extent of their participation is important for policy, as it provides insights into the types of instruments necessary to broaden and deepen the reach of the program. It can also provide insights into the appropriate role for markets in mobilizing privately financed mitigation projects under future programs.
Conceptually, we treat the CDM as a new innovation that combines GHG abatement with sustainable development objectives. We describe expected patterns of country participation in the CDM in light of existing theoretical models and then evaluate the theoretical predictions using project- and country-level data. Based on the empirical results, we suggest policy interventions that facilitate project investments under the CDM.
Three previous studies have identified potential host countries for CDM attractiveness (Jung, Reference Jung2006; Oleschak and Springer, Reference Oleschak and Springer2007; Point Carbon, Reference Carbon2009). Three other studies have empirically examined the determinants of differential distribution of CDM projects across potential host countries or regions (Flues, Reference Flues2010; Winkelman and Moore, Reference Winkelman and Moore2011; Bayer et al., Reference Bayer, Urpelainen and Wallace2013). Two studies have examined how bilateral ties between industrialized and developing countries influence the location and level of CDM activities (Dinar et al., Reference Dinar, Rahman, Larson and Ambrosi2011; Dolsak and Crandall, Reference Dolsak and Crandall2013). Whereas previous studies consider only developing country characteristics, we also take account of CDM project heterogeneity to explain differences in incidence and extent of the CDM across potential host countries. In particular, we distinguish between CDM projects by major technology type and investment characteristics (domestic or foreign). While some of our findings are consistent with those of the previous studies, we also find contrasting and additional results that provide further insights and policy implications towards the fulfillment of the CDM objectives.
The remainder of the paper is organized as follows. Section 2 describes the spread of the CDM since the program's inception. Section 3 provides the theoretical framework for the study, outlines alternative empirical models and discusses potential determinants of incidence and extent of the CDM in the host countries. Section 4 describes the data and specifies the set of explanatory variables used in the empirical models. Section 5 delineates the empirical procedures and presents empirical results. Section 6 discusses the implications of empirical results, indicates areas of future research, and concludes.
2. Expansion of the CDM
The CDM portfolio has rapidly expanded since its inception in 2003. By the end of December 2012, 10,934 CDM projects had been sent to UNFCCC for validation (Risoe, Reference Risoe2013). Only 5,547 of these projects were registered; 476 projects were in the process of registration, and 2,965 projects were in the process of validation, while 228 projects were rejected by the executive board. Validation of 1,615 projects was terminated or termed negative, and 57 were withdrawn (Risoe, Reference Risoe2013). For the purpose of examining the determinants of incidence and extent of the CDM, this paper uses all reported projects, except for those withdrawn by the submitters.
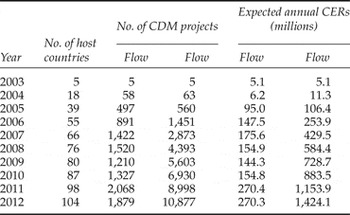
Table 1 shows the flow and stock of CDM projects submitted for validation in each year during 2003–2012.Footnote 3 The estimated annual flow and stock of estimated certified emissions reductions (CERs, each equivalent to 1 ton of CO2 equivalent emissions reduction) from these projects are also reported in table 1. It is evident from the table that CDM activities, measured in terms of number of projects and expected CERs, increased over time at an increasing rate until 2007. The rate of CDM growth declined during 2008–2009, slightly increased during 2010–2011, but declined again in 2012.Footnote 4
Number of developing countries hosting CDM projects and flows and stocks of CDM projects and expected annual certified emissions reductions (CERs) during 2003–2012

Source: Risoe (Reference Risoe2013).
The projects in the CDM pipeline can be categorized by technology type and also by the nature of investment. There are 27 specific types of projects as listed in the CDM/JI Pipeline Analysis and Database. We consolidate these into four major types: renewable energy (66 per cent), energy efficiency (13 per cent), CO2 reduction (3 per cent) and non-CO2 gas reduction projects (18 per cent). The renewable energy category includes biomass energy, geothermal, hydro, solar, tidal and wind power projects. Different types of demand- and supply-side energy efficiency projects fall into the energy efficiency category. The CO2 reduction category includes afforestation and reforestation, transportation, CO2 usage and fossil fuel switch projects. The non-CO2 gas reduction category includes methane avoidance/reduction, coal bed/mine methane reduction, HFCs, PFCs, SF6 and N2O reduction, agricultural, cement and fugitive projects.
We recognize capital investments in CDM projects of two distinct types: investments made by domestic agencies or firms in the host countries (unilateral hereafter) or by foreign agencies or firms in cooperation with a domestic entity (bi- or multilateral hereafter). According to the type of investments, we categorize CDM projects into two groups: unilateral (43 per cent) and bi- or multilateral (57 per cent).
The CDM activities started in 2003 with four bi- or multilateral projects initiated by four foreign agencies/firms in four host countries, and one unilateral project initiated by one firm in another host country. Since then, the number of participating hosts and investors, the number of CDM projects and the expected CERs from those projects have rapidly increased over time. By the end of 2012, 104 of the 175 developing countries were hosting at least one CDM project (table 1). Seventy-one of these host countries have both unilateral and bi- or multilateral projects; 14 host countries have only unilateral projects and 19 host countries have only bi- or multilateral projects.
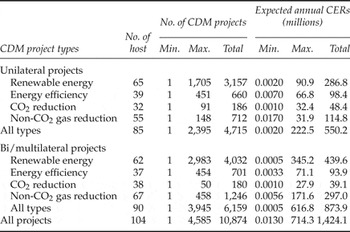
The extent of CDM activity varies widely across host countries. Table 2 summarizes the distribution of different types of CDM projects across host countries and expected annual CERs from those projects. As of December 2012, the number of unilateral CDM projects in a single host country ranged from 1 to 2,395, while the number of bi- or multilateral projects in a host country ranged from 1 to 3,945. India hosts the largest numbers of all four types of unilateral projects, while China hosts the largest numbers of all four types of bi/multilateral projects. In terms of expected annual CERs, the size of the projects widely varies within as well as across the host countries and project categories (table 2). The estimated emissions reductions from a single unilateral project range from 2,000 CERs to 90.85 million CERs per year. On the other hand, the estimated emissions reductions from a single bi- or multilateral project range from 500 CERs to 345.21 million CERs per year.
Distribution of different types of CDM projects across host countries

Note: Unilateral refers to the projects in which investments are made by domestic agencies or firms in the host countries, and bi-/multilateral refers to the projects in which investments are made by foreign agencies or firms in cooperation with a domestic entity.
China, India and Brazil are the three largest host countries, respectively. More than 72 per cent of the projects in the CDM portfolio are hosted by these countries, which in turn account for more than 75 per cent of expected annual CERs. Brazil and India were early participants in the CDM, hosting their first projects in 2003. Other early adopters include Chile, Guatemala and South Korea. China entered the CDM later with its first two projects in 2004, but soon surpassed Brazil and India both in number of projects and expected CERs. In terms of annual CER generation, projects in China are on average much larger than the projects in India or Brazil. In general, the flow of CDM projects and expected CERs vary widely across the host countries.Footnote 5
3. Conceptual framework, empirical models, and potential determinants
Several models have been developed to explain the diffusion of new technologies and consumer products. All of those models are founded on theories concerning the spread of information either through the interactions between adopters and non-adopters or through exogenous sources (Feder and Umali, Reference Feder and Umali1993). Aggregate models of technology diffusion are based on the epidemic or logistic model (e.g., Griliches, Reference Griliches1957; Griliches, Reference Griliches1980; Mansfield, Reference Mansfield1961; Doessel and Strong, Reference Doessel and Strong1991; Knudson, Reference Knudson1991; Dinar and Yaron, Reference Dinar and Yaron1992). The logistic model views the diffusion process as similar to the spread of an infectious disease, with the analogy that contact with other adopters (i.e., learning from the experience of others) and exposure to information on innovation (i.e., demonstration effect) lead to adoption. The diffusion of innovation is expected to follow a symmetric S-shaped function over time.
The symmetry of the logistic model, however, does not always fit observed patterns. To account for asymmetric growth patterns, a family of exponential growth models has been developed and used. The exponential growth models include the Gompertz, the flexible logistic, the log-normal and the cumulative log-normal models. The Gompertz model imposes an asymmetric S-shape on the growth curve and attains its point of inflection when diffusion has reached approximately 37 per cent of the upper bound (Dixon, Reference Dixon1980; Michalakelis et al., Reference Michalakelis, Varoutas and Sphicopoulos2008). While the logistic and Gompertz models have fixed inflection points, the point of inflection and degree of symmetry of the flexible logistic model are determined by the data (Bewley and Fiebig, Reference Bewley and Fiebig1988). The log-normal distribution may be more appropriate in some economic applications, since many economic variables cannot have negative values and do not have symmetric distributions as the normal distribution has (Maddala, Reference Maddala1977). The inflection point is variable in the cumulative log-normal model. Thus, the model can generate a family of asymmetric S-shaped curves. However, instead of a single diffusion curve, there may exist an envelope of successive diffusion curves, each associated with a given set of innovations and environmental characteristics, adoption ceiling and rate of adoption (Metcalfe, Reference Metcalfe1981).
Not only internal sources of information (i.e., learning from the adopters) but also external sources of information (e.g., the mass media) may shape the diffusion process (Lekvall and Wahlbin, Reference Lekvall and Wahlbin1973). Moreover, heterogeneity of the population may also affect the diffusion process (Davies, Reference Davies1979). Taking account of dual (endogenous and exogenous) sources of information and population heterogeneity, Bass (Reference Bass1969) developed a model for the growth of market share of a new product. Mahajan and Schoeman (Reference Mahajan and Schoeman1977) proposed a similar model for technology diffusion.
In the case of the CDM, the analogy to the diffusion model is that exposure to the opportunity and learning from the experience of the countries that have already started CDM activities lead new countries to follow. The process is particularly open, since the project proposal documents are posted on the web and are subject to comments prior to project commencement. The same is true with the methodologies for establishing project baselines. Also, the ability of investor countries to invest in several host countries enhances learning opportunities.
3.1. The empirical models
We start our empirical investigation with a binary response model to examine the factors that influence the incidence of the CDM in the developing (host) countries. Then we use two empirical versions of the epidemic model to provide a detailed account of the determinants that influence the incidence and extent of the CDM in the host countries.
First, following the literature (e.g., Rogers, Reference Rogers2003), the incidence of the CDM in potential host countries is represented by a dichotomous variable indicating whether a developing country is engaged in CDM activity (i.e., hosting at least one CDM project by the end of 2012). Using this indicator as a dependent variable in the following equation, we examine whether variations in country attributes sufficiently explain the binary choice.
 $$I_{i}=\alpha +X_{i}\beta +\varepsilon_{i} $$
where I i indicates CDM incidence in country i, the value of which is set equal to 1 if it was involved in at least one CDM project during 2003–2012, and zero otherwise. X i is a vector of country-specific variables that determine CDM incidence, and ε i is an independently and identically distributed random disturbance that varies across countries.
In the second regression model, the extent (level) of CDM program participation in a host country at a particular point in time is given by the cumulative expected CERs per year from the country's projects. The Annex B countries' 2012 Kyoto obligation (i.e., the total amount of emissions reductions by Annex B countries in the final year of the first commitment period as set by the Kyoto Protocol) can be used as a proxy for the population in the logistic function. Using the natural log of the ratio of the cumulative expected CERs to the Annex B countries' aggregate emissions reduction target as the dependent variable, the determinants of differences in the levels of the CDM across countries can be examined by:
 $$\ln \left(\displaystyle{{y_{i}}\over{Y}} \right)\, =\, \theta\, +\, X_{i}\gamma+{\xi}_{i}\comma \; $$
where y i is the cumulative expected CERs per year from the projects of country i, Y is the Annex B countries' 2012 emissions reduction target, X i is a vector of country-specific variables that influence incidence and extent of the CDM, and ξ i is an independently and identically distributed random disturbance that varies across countries.
Finally, following Comin and Hobijn (Reference Comin and Hobijn2004) and Caselli and Coleman (Reference Caselli and Coleman2001), the determinants of differences in the levels of the CDM across potential host countries and over time are examined using the equation:
 $$\ln \left(\displaystyle{{y_{it}} \over {Y}} \right)=\delta +X_{it}\phi +D_{t}\lambda+{\eta}_{i}+{\mu}_{it}\comma \; $$
where (y it /Y) is the ratio of expected CERs from the projects of country i in year t to Annex B countries' 2012 emissions reduction target, D t is a set of year dummies, η i is a random country effect (unobserved heterogeneity) that differs across countries but not over time, and μ it is an independently and identically distributed random disturbance that varies across countries and years. The set of year dummies in equation (3) demeans the measure of CDM level in each year. Thus, the deviation ln(y it /Y) – D t reflects the CDM disparity of country i from the average level across countries. The coefficients of year dummies are likely to be positive and increasing as the end of the first commitment period of the Kyoto Protocol approaches.
Since the aggregate Kyoto target, Y, is the same across countries, the denominators in equations (2) and (3) can be normalized to 1 in order to avoid unnecessary complexity. With this simplification, we use the log of cumulative expected CERs as the dependent variable in equations (2) and (3). We also examine the cumulative number of projects of country i at a specific point in time as a measure of the CDM level in equations (2) and (3).
3.2. Potential determinants of incidence and extent of the CDM
Three previous studies have ranked potential host countries for CDM attractiveness. Jung (Reference Jung2006) used cluster analysis to rank 114 potential host countries into four distinct categories for CDM attractiveness: very attractive, attractive, attractive to a limited extent, and very unattractive. Her explanatory variables include: emissions reduction potential as measured by expected GHG emissions in 2010; the CDM institutional strength of countries as measured by Kyoto ratification and Designated National Authority (DNA) establishment; participation in capacity building efforts and production of a national CDM strategy paper; and the general investment climate based upon World Governance Indicators for political stability, rule of law and regulatory quality. Oleschak and Springer (Reference Oleschak and Springer2007) provide a composite index showing relative risk for CDM investments in 106 potential host countries. They construct their index using several variables (with weights for variables based upon principal components analysis): CDM institutions including Kyoto ratification and DNA establishment; national communications submitted to the UNFCCC; number of capacity building programs; memoranda of understanding with other countries; the presence of CDM policy in national communications; CDM experience including the number of CDM projects and stage of registration; and the regulatory environment in the country including enforcing contracts, starting a business, registering property, and economic and default risk. Point Carbon (Reference Carbon2009) provides a ranking for the top 16 countries for CDM investments, based on measures related to CDM institutional strength, the general investment climate, the number and status of CDM projects and the GHG mitigation potential of host countries.
Three studies have empirically examined the determinants of differential distribution of CDM projects across potential host countries or regions. Flues (Reference Flues2010) found that the level of per capita GDP, per capita GDP growth, fossil fuel energy per GDP, renewable energy potential, and links to developed countries and institutional quality positively affect the number of projects hosted by a developing country. Additional explanatory variables used by Flues also include population, gross fixed capital formation, trade openness, FDI inflow and political freedom. Winkelman and Moore (Reference Winkelman and Moore2011) found that economies with a growing demand for electricity had larger CER production, and CDM hosting was positively influenced by the level of total emissions, emission intensity and education. They also used institutional capacity for the CDM and FDI as explanatory variables in the empirical models. In their analysis of projects across Chinese provinces, Bayer et al. (Reference Bayer, Urpelainen and Wallace2013) found that high electricity consumption, low per capita income and a lack of FDI are all associated with CDM project implementation. They also used renewable energy potential, economic growth, share of primary sector in the GDP and population.
Two studies have examined how bilateral ties between industrialized and developing countries influence the location and level of CDM activities. Dinar et al. (Reference Dinar, Rahman, Larson and Ambrosi2011) found that countries with strong trade relations are more likely to cooperate in CDM activities, and that the level of ease of doing business in the host countries positively influences the level of cooperation between hosts and investors. Dolsak and Crandall (Reference Dolsak and Crandall2013) found that bilateral trade and aid strongly influence CDM location decisions. They also found that the level of CO2 emissions and UNFCCC-specific domestic institutions in the host countries influence CDM location decisions.
Taken together, the previous studies suggest an unmanageably large set of potential determinants to explain the distribution of projects under the CDM. Based on these studies, we categorize the potential determinants into four groups: mitigation potential, investment climate, CDM capacity and international relations. To begin our empirical analysis, we consider a broad set of explanatory variables for each group (listed in online appendix table A1), which we pare down for our eventual analysis.
3.2.1. Mitigation potential
From a classical economic perspective, the attractiveness of a CDM host country depends mainly on the availability of cheap abatement opportunities. Following previous studies, we recognize that a host country's mitigation potential and associated costs in turn depend on several factors such as: the volume of GHG emissions per year; emission intensity (measured by emissions per unit of GDP); structure of the economy (measured by the shares of agriculture and manufacturing sectors in GDP and their growth rate, energy use and intensity, and electricity use and intensity);, level of economic development (measured by real GDP, per capita real GDP and GDP growth rate); availability of capital (measured by adjusted net savings); renewable energy potential; and sequestration potential. We also consider the source vulnerability index developed by Buys et al. (Reference Buys, Deichmann, Meisner, That and Wheeler2007) as an alternative to renewable energy potential.
3.2.2. Investment climate
Whether the mitigation potential of a host country can be exploited crucially depends on the country's investment climate. While engaging in CDM projects, investors are likely to face substantial transaction costs related to the time and resources used for information gathering, project design, approval, validation and verification, contract negotiation, monitoring and enforcement, and insurance, as well as the certification and sale of CERs. To indicate variation in the general investment climate of host countries, we consider a the governance indicator, ease of doing business (EDB) index and the World Bank's Country Policy and Institutional Assessment (CPIA) rating for property rights and rules of governance (1= low to 6= high) as well as the CPIA rating for business regulatory environment (1= low to 6= high).
3.2.3. CDM capacity
Following previous studies, an indicator variable showing whether a potential host country had established its DNA by 2005 can be used as a proxy for the CDM capacity of the country. An alternative is to use an indicator variable showing whether the host country received any donor funding (or the amount of donor funding received by the host country) for building CDM capacities. Because establishment of DNA or acquiring donor funding for CDM capacity building indicates a host country's willingness and initiative to attract CDM projects, both of these measures are likely to be endogenous. Instead, we use an index showing countries' relative political feasibility of government policy change and the World Bank's CPIA rating for policy and institutions for environmental sustainability (IRAI, 2010). The CPIA rating assesses the extent to which a country's environmental regulations and policies (and implementation thereof) foster the protection and sustainable use of natural resources and the management of pollution (1= low to 6= high). We also consider the impact vulnerability index developed by Buys et al. (Reference Buys, Deichmann, Meisner, That and Wheeler2007), as vulnerability to climate change impact may provide an incentive to increase host countries' willingness to undertake mitigation actions such as CDM.
Prior to the Kyoto Protocol, the UNFCCC sponsored a set of national programs to pilot bilateral mitigation projects, loosely organized by a common reporting framework dubbed the activities implemented jointly (AIJ). The pilots influenced the eventual CDM and joint implementation (JI) programs, and some AIJ projects led to some of the earliest CDM projects. To take into account the human and institutional capital established under the AIJ, we included the number of years of experience with AIJ projects as a determinant.Footnote 6 We also tried to capture the ‘neighbor’ knowledge transfer effect by creating a variable that measures the number of projects of a certain type in a given sub-region of the world.
3.2.4. Strength of international relationships
We consider alternative measures for host countries' economic relationship with industrialized countries that are likely to influence the location and level of CDM activities. In particular, we consider volumes of trade and inflows of FDI (as percentages of GDP) with the presumption that higher trade volume and FDI inflows indicate stronger international economic relationships.
Some of these potential determinants may or may not be able to explain variations in CDM incidence and extent across host countries, and some may be correlated with each other. We obtain data for each of these variables first. Then, based on pairwise correlation and univariate regression analysis, we select the variables in each group that are to be used in the empirical models.
4. Data and model specification
Data for the dependent and explanatory variables as described above are derived from several different sources. As mentioned earlier, individual CDM project-level data were obtained from the CDM/JI Pipeline Analysis and Database of the United Nations Environment Programme Risoe Center (Risoe, Reference Risoe2013). From the project-level data, cumulative number of projects and expected annual CERs were calculated for each host country in each year during 2003–2012. To account for the dispersion effect, we distinguish the projects into renewable energy, energy efficiency, CO2 reduction and non-CO2 gas reduction categories as defined earlier. We also distinguish the projects in each category with unilateral and bi- or multilateral investments. The upper panel of table A2 in the online appendix provides summary statistics of the dependent variables distinguished by project types and nature of investments (unilateral and bi- or multilateral).
We created a count variable to capture additional learning process of the investors (both unilateral and bi/multilateral). The variable measures the number of similar types of projects in the sub-region. There are 21 sub-regions as categorized by UNEP Risoe. We have computed the numbers of unilateral and bi/multilateral projects of the four types in each sub-region.
Country-specific historical macro-economic data were obtained from the World Bank (WDI, 2014). In particular, total and per capita real GDP (constant 2005 US$), GDP growth rate, CO2 emissions (kiloton of oil equivalent), CO2 emission per dollar of 2005 PPP GDP, total and per capita energy and electricity use, the shares of agriculture and manufacturing sectors in GDP and their growth rates, adjusted net savings (per cent of GNI), volume of all trades, and net inflows of FDI for all developing countries during 2001–2010 were obtained.
Data on host countries' renewable energy potentials and sequestration potentials were obtained from Buys et al. (Reference Buys, Deichmann, Meisner, That and Wheeler2007). They construct an index for countries according to their relative vulnerability to climate change impacts (impact vulnerability hereafter) such as sea-level rise and weather damage. The index ranks countries on a scale of 1–100, with a lower rank indicating more vulnerability to climate change impacts. Based on individual countries' access to fossil fuels and renewable energy sources, options for sequestering GHG emissions and the potential size of employment and income shocks, they also construct another index for the countries' vulnerability to emissions reduction mandates (source vulnerability hereafter). The index ranks countries on a scale of 1–100, with a higher rank indicating lower source vulnerability (i.e., greater access to energy resources). Buys et al. (Reference Buys, Deichmann, Meisner, That and Wheeler2007) show that resistance to a new global protocol should be greatest from countries with low impact vulnerability and high source vulnerability, and vice versa. Because the CDM project cycle is largely a bilateral process, we expect that countries vulnerable to climate change will seek out investors and lower domestic bureaucratic impediments to support and accelerate the CDM process. Using evidence on CDM incidence between country pairs, Dinar et al. (Reference Dinar, Rahman, Larson and Ambrosi2011) show that the level of CDM cooperation between host and investor countries is higher for higher impact vulnerability. Since the indices assign higher values for countries with lower impact and source vulnerability, we expect positive coefficients for source vulnerability and negative coefficients for impact vulnerability in the regression equations.
Estimates of six dimensions of governance of the host countries are obtained from Kaufmann et al. (Reference Kaufmann, Kraay and Mastruzzi2010). The six dimensions of governance are: voice and accountability; political stability and absence of violence; government effectiveness; regulatory quality; rule of law; and control of corruption. Estimates for each of these dimensions are normally distributed between –2.5 and 2.5 (higher scores indicate better outcomes) with a mean of zero and standard deviation of one. Combining these governance measures, a country-level composite governance variable is constructed employing a principal component analysis (PCA).
The International Finance Corporation (IFC) of the World Bank Group provides a composite index, named the ease of doing business (EDB) index, which ranks economies according to the state of business regulations and protection of property rights. Economies are ranked 1–183 on their ease of doing business. A high ranking on the EDB index means the regulatory environment is more conducive to the starting and operation of a local firm.
As alternative measures to the governance indicator and EDB index, we also obtain the CPIA rating for property rights and rules of governance and the CPIA rating for business regulatory environment. These two CPIA ratings, as well as the CPIA rating for policy and institutions for environmental sustainability, are obtained from the World Bank (WDI, 2014).
Finally, to take account of the political feasibility for government policy change, we use the political constraints index for each individual country constructed by Henisz (Reference Henisz2002). The political constraint index ranges from 0 to 1, with a larger value indicating that the political environment of a country is less favorable for government policy change. Thus, a host country with a higher index value faces a higher level of difficulty in CDM-related policy change.
Before specifying the empirical model, we check pairwise correlations between dependent and explanatory variables (see table A1) and perform univariate regressions of expected annual CERs on each explanatory variable separately to identify those which can explain variations in CDM extent across host countries (see table A3). Based on correlation coefficients and univariate regression results, we identify nine variables which are able to explain variations in the dependent variables but which are not highly correlated with each other. These are the volume of annual CO2 emissions, per capita real GDP, GDP growth rate, source vulnerability index, AIJ experience, number of projects in the sub-region, CPIA rating for policy and institutions for environmental sustainability, and net FDI inflows. The first five of the selected variables represent the mitigation potential of the host countries. The impact vulnerability index, AIJ experience, number of projects in the sub-region and CPIA rating represent CDM capacity. The CPIA rating also represents the host countries' investment climate. Net inflows of FDI represent the level of international relationship. A summary of the statistics of these variables is presented in the lower panel of table A2.
5. Estimation procedures and results
To investigate the differences in the CDM across developing countries, the empirical models in equations (1)–(3) are estimated by employing standard econometric techniques. First, the CDM incidence represented by a dichotomous dependent variable indicating participation in the CDM activity (equation (1)) is estimated using a probit regression. Secondly, using the natural log of cumulative CERs from the projects in each country as the dependent variable in equation (2), the incidence and extent of the CDM across countries is estimated by Heckman's two-step (selection) or tobit model as appropriate. While the tobit regression assumes that the same probability mechanism determines the incidence and extent of the CDM, Heckman's two-step model allows for the possibility that the incidence and extent are determined by different probability mechanisms that may not be independent. Thirdly, using the natural log of cumulative expected CERs from the projects in each country in each year during 2003–2012 as the dependent variable in equation (3), the incidence and extent of the CDM are estimated by employing a random effects (RE hereafter) tobit or a combination of RE probit and GLS regressions as appropriate. The panel structure of the data set captures time variation as well as cross-sectional variation in the variables. Finally, using the number of CDM projects in each country as the dependent variable in equation (2), the extent of cross-country CDM is estimated by count data models, specifically Poisson, negative binomial (NB), zero-inflated Poisson (ZIP hereafter) and zero-inflated negative binomial (ZINB hereafter) models, depending on over-dispersion parameter and test diagnostics.Footnote 7
The same set of explanatory variables is used in each regression model. We treat selected variables as exogenous for the measures of the CDM because the reverse causation is unlikely. Even for countries like Brazil, China and India, where a majority of the CDM projects are located, the extent of CDM activity is not large enough to have an impact on annual GHG emissions or per capita GDP. While many of the CDM projects have power generation capacity, which may influence the availability of renewable energy, most of the projects are still not in operation. That said, we do account for regional learning effects by including a count of sub-regional projects.
As a precaution we take additional steps to avoid potential endogeneity problems; we employ two-year lagged values for the macroeconomic variables that are used in the RE models following Murray, (Reference Murray2006). In the probit, Heckman's two-step, tobit and count data models, 2001–2010 averages of the macro-economic factors are used to cover the study period with a two-year lag and also to take account of the status quo bias in policy decisions as pointed out by Samuelson and Zeckhauser (Reference Samuelson and Zeckhauser1988). We estimate the models for each type of projects and investments separately.
5.1. Renewable energy projects
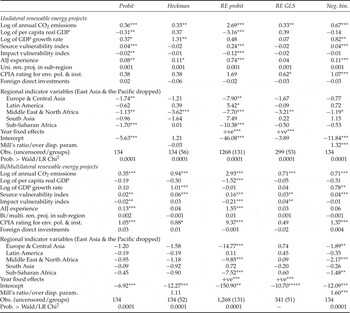
The probit, Heckman's two-step (sample selection), RE probit and GLS and NB regression results for the unilateral and bi/multilateral renewable energy projects are presented in table 3. In addition to the continuous explanatory variables as listed above, a set of indicator variables for different regions is used in each of these models.Footnote 8 An additional set of indicator variables for different project start years is used in the RE probit and GLS models. To conserve space, only estimated coefficients are presented in table 3. Note that the coefficients of log-transformed continuous variables represent corresponding truncated (conditional) elasticities.
Estimation results for renewable energy projects

Note: The dependent variables in the probit and RE probit models are dummy variables indicating whether a country has any renewable energy project, the log of annual CERs in the Heckman and RE OLS models, and the number of such projects in the negative binomial model. ***, ** and * indicate 1%, 5% and 10% significance, respectively, and ‘ + ve’ denotes positive.
The probit regression results suggest that the likelihoods of both unilateral and bi/multilateral renewable energy projects significantly increase with the volume of annual CO2 emissions, access to energy resources (as measured by source vulnerability index), vulnerability to climate change impacts (as higher indices indicate less vulnerability), and AIJ experience (table 3). The likelihood of unilateral projects also increases (decreases) with GDP growth rate (per capita real GDP), while the probability of bi/multilateral renewable energy projects is higher for the countries with higher CPIA rating for policy and institution for environmental sustainability. The results also indicate that the likelihood of renewable energy projects is lower in the countries in Europe and Central Asia, Middle East and North Africa and Sub-Saharan Africa than in the countries in other regions, while differences are not statistically significant in the case of the bi/multilateral projects. Additionally, neither FDI nor the number of projects in the sub-region is found to be significant in either case.
The Heckman two-step model is run without imposing an exclusion restriction. The estimation results for the selection part of the Heckman model are the same as the probit results. The results from the outcome part are presented in column 3 of table 3. The estimated coefficient for the inverse of the Mill's ratio (i.e., the non-selection hazard) in the Heckman model is not different from zero at standard critical levels, providing no evidence of sample selection bias. Thus, the selection part and outcome part of the Heckman model can be considered to be independent. The selection and outcome equations, however, are not the same. For both unilateral and bi/multilateral renewable energy projects, the level of CO2 emissions and GDP growth rate are statistically significant and positive. AIJ experience is positive and significant for unilateral renewable energy projects, while source vulnerability and the CPIA rating are positive and significant for bi/multilateral projects. The estimated coefficients for per capita GDP, impact vulnerability and FDI inflows are not statistically significant in either case. The estimated coefficient of the dummy variable for the Middle East and North Africa is negative and significant in the case of unilateral projects, but none of the coefficients of regional dummy variables is significant in the case of bi/multilateral renewable energy projects.
Because the selection and outcome equations in Heckman's two-step model are not determined by the same probability mechanism, we do not estimate the tobit model for renewable energy projects. As there is no sample selection bias, we estimate a combination of RE probit and RE GLS regressions. The results are presented in columns 4 and 5 of table 3. The RE probit results are similar for unilateral and bi/multilateral renewable energy projects, showing that the likelihood of renewable energy projects is higher for the countries with higher CO2 emissions, access to energy resources, vulnerability to climate change impacts and AIJ experience, but lower for the countries with higher per capita GDP. Although positive in both cases, the CPIA rating is significant only for the bi/multilateral projects. In both cases, the regional dummies for countries in Europe and Central Asia, the Middle East and North Africa and Sub-Saharan Africa are negative and significant. In neither case did the number of projects in the sub-region prove significant.
The RE GLS results show that the extent of unilateral as well as bi/multilateral renewable energy projects is higher for the countries with larger CO2 emissions. For unilateral projects, the institutional measure was significant. The extent of bi/multilateral renewable energy projects is also higher for countries with greater access to energy resources and greater vulnerability to climate change. The regional dummies show that the extent of unilateral investments in renewable energy projects is lower for the countries in the Middle East and North Africa but is otherwise insignificant. However, region effects are not significant for bi/multilateral projects. The coefficients of the variables indicating project start years are positive and highly significant in both RE probit and RE GLS models for unilateral as well as bi/multilateral projects. Moreover, the value of the coefficients increases over time at an increasing rate up until year 2008 but at a decreasing rate thereafter (not shown in table 3 to conserve space). Thus, the extent of renewable energy projects under the CDM increases over time but the rate declines as the first commitment period of the Kyoto Protocol approaches.
The NB regression results are presented in the last column of table 3. The estimates of the over-dispersion parameter are positive and significant for both unilateral and bi/multilateral projects. However, the Vuong likelihood ratio test statistics for NB versus ZINB models are not significantly different from zero, thus suggesting that the zero-inflated variant is not essential. The results show that the number of both unilateral and bi/multilateral renewable energy projects increases with CO2 emissions, GDP growth rate, access to energy resources, and CPIA rating for policy and institutions for environmental sustainability. In addition, the number of unilateral projects is larger for the countries with greater AIJ experience. The level of per capita GDP, vulnerability to climate change impacts, the number of sub-regional projects and FDI are not significant in the NB model. The coefficient estimates of the regional dummy variables show some variation. The dummy for projects in the Middle East and North Africa are both negative and significant; additionally, the Europe and Central Asia and Sub-Saharan Africa dummies are significant for bi/multilateral projects.
In general, estimation results from each of these econometric models confirm that the likelihood as well as the extent of renewable energy projects under the CDM is higher for the developing countries with higher mitigation potential, better investment climate and higher CDM capacity. However, the incidence or extent of renewable energy projects under the CDM does not vary with the level of international economic relationships. While results are net of regional differences, we do not see any systematic difference between the set of variables which determine domestic (unilateral) versus foreign (bi/multilateral) investments in renewable energy projects.
The results indicating that the extent of renewable energy projects is higher in the developing countries with larger volume of annual CO2 emissions, higher GDP growth rate and better CPIA rating for policy and institutions for environmental sustainability are particularly important. As the volume of CO2 emissions is highly positively correlated with the levels of GDP, energy use and electricity use (see table A1), the result implies that larger developing economies are better equipped with institutional infrastructure, and thus more supportive of renewable energy projects. The faster growing economies are also more welcoming to renewable energy projects, likely because of increasing demand for electricity. However, the success in attracting investments in renewable energy projects depends crucially on favorable policy and institutions for environmental sustainability, preserving property rights and facilitating business. In addition to general policy and institutions for sustainable development, major host countries also provide specific incentives for investments in renewable energy projects. For example, the Chinese government's support for renewable energy projects includes reduced corporate income taxes, significant reductions in value added taxes, and feed-in tariffs and subsidies to operators of renewable energy projects to compensate for their costs (KPMG International Cooperative, 2011). In Brazil, feed-in tariffs are available for electricity generation from wind, biomass and hydro projects, and a special tax regime is applicable to the producers of biodiesel (KPMG International Cooperative, 2011).
5.2. Energy efficiency, CO2 reduction, and non-CO2 gas reduction projects
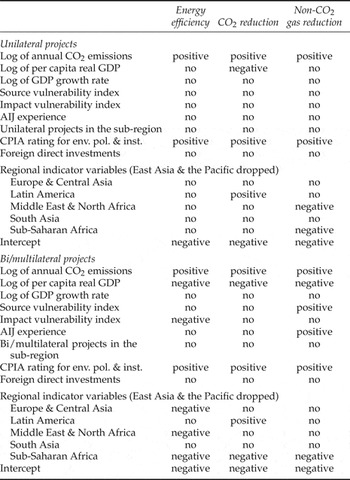
We repeat the estimation procedure for unilateral as well as bi/multilateral energy efficiency, CO2 reduction and non-CO2 gas reduction projects. To conserve space, a summary of the estimation results is presented in table 4. The results are summarized based on estimated coefficients from probit, Heckman's two-step (sample selection), RE probit and GLS and NB regressions. Detailed results for energy efficiency, CO2 reduction and non-CO2 gas reduction projects are presented in tables A4, A5 and A6, respectively. The same set of explanatory variables is used in each model. The Heckman two-step model is run without imposing an exclusion restriction. For each project and investment category, the estimated coefficient for the inverse of the Mill's ratio in the Heckman model is not different from zero at standard critical levels, providing no evidence of sample selection bias. We do not estimate the tobit model because the selection and outcome equations in Heckman's two-step model are not determined by the same probability mechanism. We employ a combination of RE probit and RE GLS regressions as there is no sample selection bias. We report only NB regression results because the estimates of the over-dispersion parameters are positive and significant for both unilateral and bi/multilateral projects, and the Vuong likelihood ratio test statistics suggest that the zero-inflated variant is not essential.
Summary of estimation results for energy efficiency, CO2 reduction, and non-CO2 gas reduction projects

Notes: ‘Positive’ (‘negative’) indicates that the estimated coefficient of the explanatory variable is positive (negative) and significant in most of the econometric models. ‘No’ indicates that the estimated coefficient of the explanatory variable is not significant in most of the models. See online appendix tables A4–A6 for detailed results.
Summary results for the unilateral and bi/multilateral energy efficiency projects are presented in the second column of table 4 (see online appendix table A4 for detailed coefficient estimates). The results show that the incidence as well as the extent of both unilateral and bi/multilateral energy efficiency projects is greater for the countries with higher CO2 emissions, and the CPIA rating for policy and institutions for environmental sustainability (see table 4). For bi/multilateral projects, the results also show that the likelihood of unilateral energy efficiency projects is larger for the countries with smaller per capita real GDP and greater vulnerability to climate change. GDP growth, source vulnerability, AIJ experience, FDI and the number of sub-regional projects did not significantly affect any of the outcomes. For unilateral projects, none of the regional dummies was significant; in the case of bi/multilateral projects, the dummies on countries from Europe and Central Asia, the Middle East and North Africa and Sub-Saharan Africa were negative and significant.
Summary results for CO2 reduction projects are presented in the third column of table 4 (see online appendix table A5 for detailed coefficient estimates). Results show that the incidence as well as the extent of both unilateral and bi/multilateral CO2 reduction projects is greater for the countries with higher CO2 emissions, and higher CPIA ratings for policy and institutions for environmental sustainability. On the other hand, the likelihood and extent of unilateral as well as bi/multilateral CO2 reduction projects is lower for the countries with higher per capita real GDP. Other factors, including FDI flows and the number of projects in the sub-region, do not show up as significant. For both unilateral and bi/multilateral projects, CO2-reduction projects are more likely to be located in Latin America than other regions; bi/multilateral projects are less likely to take place in Sub-Saharan Africa.
The last column of table 4 shows the summary results for non-CO2 gas reduction projects (see online appendix table A6 for detailed coefficient estimates). Results show that the incidence as well as the extent of unilateral non-CO2 gas reduction projects is greater for the countries with higher CO2 emissions and higher CPIA ratings for policy and institutions for environmental sustainability. As with other types of projects, bi/multilateral non-CO2 gas reduction projects are more likely to take place in lower income countries. Source vulnerability and AIJ experience show up as significant determinants for bi/multilateral projects. There is no evidence that projects are crowded out by other investments, since the estimated parameter on the number of projects in the sub-region is insignificant for both unilateral and bi/multilateral projects. In the case of unilateral projects, the fixed effect for countries in the Middle East and South Africa is negative. For both unilateral and bi/multilateral projects, the fixed effect for countries in Sub-Saharan Africa is negative.
As shown in tables 3 and 4, factors that determine the incidence and extent of renewable energy projects and other CDM projects are not quite the same. The level of annual CO2 emissions and CPIA rating for policy and institutions for environmental sustainability are the common factors which positively influence the likelihood as well as the extent of all project categories and investment types. In general, bi/multilateral projects are more likely to be located in countries with a lower GDP, but this result is somewhat sensitive to choices about estimation methods. Projects of all types appear less likely to be located in Sub-Saharan Africa. In all cases, there is no evidence that the number of projects in the region crowds out further investments.
6. Conclusions and policy implications
This paper empirically examines why there are differences in the incidence and extent of CDM projects across developing countries. The authors estimate alternative measures of the CDM, taking into consideration the heterogeneity among developing countries as well as CDM projects. We measure the incidence of the CDM by a dichotomous variable indicating whether or not a country has hosted CDM projects. To measure CDM extent, we use the number of CDM projects in a host country and also the expected annual aggregate abatement flows from those projects. We distinguish between CDM projects by the nature of investments (unilateral or bi/multilateral) and also by major categories (renewable energy, energy efficiency, CO2 reduction and non-CO2 gas reduction). For each project and investment type, we regress the measures of CDM extent on host countries' mitigation potential, investment climate, CDM capacity and international economic relationship. Appropriate econometric models such as binary choice, censored data, panel data and count data models are employed to estimate the distribution of CDM projects across countries.
The results suggest a set of core determinants that drive CDM project investments of all kinds. To start with, higher carbon emissions are strongly associated with the incidence and extent of CDM projects, suggesting that the mechanism was successful in directing investments to countries where mitigation opportunities were likely to be plentiful. In addition, the strength of host countries' policy and institutions for environmental sustainability, as measured by the CPIA, matters for all types of projects. It may be likely that the business for climate change projects is strong where the general business climate is strong. This finding is also reported in Flues (Reference Flues2010), and we also find that CPIA ratings for policy and institutions for environmental sustainability are highly positively correlated with CPIA ratings for business regulatory environment and CPIA ratings for property rights and rules of governance. Nonetheless, in contrast to Flues (Reference Flues2010), including the level of FDI did not add explanatory power in our regressions, perhaps because the relevant information is already captured by the CPIA. In addition, we find no evidence that CDM markets have become saturated, slowing the pace of CDM investment, as the number of sub-regional projects accumulated.
Host countries' mitigation potential measured by the level of annual CO2 emissions and CDM capacity measured by the CPIA ratings for policy and institutions for environmental sustainability are the common drivers of unilateral and bi/multilateral investments in projects under each category. For energy efficiency, CO2 reduction and non-CO2 gas reduction projects, bi/multilateral investments are more strongly associated with lower per capita GDP. In contrast, the significance of this variable varies by type of project in the case of unilateral investments. In general, the result is consistent with the notion that capital available for CDM investments is constrained in poorer developing countries, leading to a greater share of project investments from abroad.
There are also differences tied to the project type. For one, the association between low income and CDM projects does not prove robust for renewable energy projects. We suspect that these types of projects require a more sophisticated infrastructure (e.g., energy grid) or energy policy that partly offsets the economic drivers associated with other energy projects. Renewables are different from other energy projects in additional ways as well. In the case of bi/multilateral projects, rapidly growing economies are more likely to attract CDM projects in renewable energy, while growth rate matters little for other types of bi/multilateral projects. Source vulnerability and AIJ participation are significant only for renewable energy projects and bi/multilateral non-CO2 gas reduction projects. Still, on the whole, we find some measure of support for the finding reported in Winkelman and Moore (Reference Winkelman and Moore2011) that developing countries with growing markets for electricity and superior human capital are more likely to be the CDM hosts.
Sustainable development is one of the stated objectives of the CDM; however, our results are disappointing for least developed Africa, showing that poor African countries lag behind their peers when it comes to attracting CDM projects. Part of this is likely due to weak CDM institutions and other in-country governance; however, regional dummy variables are consistently negative in our regression estimates even after controlling for institutions. An additional explanation, which we are unable to test, is that much of the mitigation potential in Africa lies outside the energy sector. For example, Lal (Reference Lal2004) notes that Sub-Saharan Africa has significant potential for soil carbon sequestration; however, as noted by Larson et al. (Reference Larson, Dinar, Frisbie, Dinar and Mendelsohn2011), the CDM is poorly structured for soil sequestration projects.
In summary, our research suggests that the CDM was broadly effective at directing both bi/multilateral and unilateral investments. The strength of local CDM institutions and features of the CDM appear to have played a role in directing the types of projects under the mechanism in addition to project location. In other words, transaction costs related to the governance of the mechanism seem to matter in addition to fundamental mitigation costs. As countries gather to negotiate a new set of mechanisms and a potential modification of the CDM, our research suggests that finding ways that allow the CDM to work more efficiently will expand the number of countries that benefit from it and expand the types of mitigation opportunities that can be tapped to slow the pace of climate change.