Introduction
The measurement of the height of horses and ponies is required for their description and classification in competitions. A fast growth is one of the risk factors in the occurrence of developmental diseases as well as nutritional and genetic factors (Van Weeren et al., Reference Van Weeren, Sloet van Oldruitenborgh-Oosterbaan and Barneveld1999; Martin-Rosset, Reference Martin-Rosset2005). Therefore, the follow-up of the growth of foals, by regular measurements, makes it possible to optimise their athletic potential by decreasing the risks associated with an abnormal growth (Trillaud-Geyl et al., 2004). However, growth rates of the French breed horses are not as well described as they are in other species and accurate data would be needed to strengthen our understanding of their skeletal development.
Among statistical procedures available for analysing growth data, fitting a non-linear function offers an opportunity to summarise the information contained in the entire sequence of size–age points into a small set of parameters that can be interpreted biologically and used to derive other growth traits (Perotto et al., Reference Perotto, Cue and Lee1992). The models of growth can be expressed by various equations: linear, polynomial of the second order or third order, logarithmic curves or power. The logistic model (Pearl and Reed, Reference Pearl and Reed1923), the model of Gompertz (Winsor, Reference Winsor1932), the monomolecular model (Brody, Reference Brody1945) and the model of Richards (Reference Richards1959) have been used to follow the growth of bovines (Perotto et al., Reference Perotto, Cue and Lee1992), Ardennes foals (Delobel et al., Reference Delobel, Vandervorst, Lejeune, De Behr, Serteyn, Dufrasne and Istasse2005) and Thoroughbred foals (Staniar et al., Reference Staniar, Kronfeld, Hoffman, Wilson and Harris2004).
The aims of this work were to establish standards for growth and to model the evolution of wither height (WH) between birth and adult age in three different breeds of sport- and race-horses. Therefore, the abilities of different functions to fit the observed growth curve of horses were compared through an analysis of variance. The functions giving the most reliable estimates of the observed growth curve were then used to compare the growth of the three investigated breeds.
Material and methods
Animals and measurements
This study was conducted on 21 stud farms in Basse-Normandy (France). The population consisted of 398 foals from three breeds: 137 Thoroughbreds (Tb, 1150 measurements), 162 French Trotters Standardbreds (FT, 965 measurements) and 99 Selle Français horses (SF, 555 measurements) from three consecutive crops (2002 to 2004). They were followed from birth to the beginning of training at about 18 months. On each of them, wither height (WH) was measured every 6 weeks until weaning, then every 2 to 3 months. As a result, six to nine measures were available on each horse. Horses were placed on a horizontal plan and measured with a height gauge by a unique operator during the whole study. The accuracy of the measurement was evaluated to 1 cm; so, the relative error represented approximately 0.7% of the WH.
Models of growth
As stated in the introduction, there are many models that have been used to model growth of domestic animals. In the present study, only eight models among the most usually used were retained to describe the evolution of WH with time. They are the as follows:
linear: Y = aX + k,
quadratic: Y = aX 2 + bX + k,
cubic: Y=aX 3 + bX 2 + cX + k,
logarithmic: Y = a Ln (X) + k,
power: Y = aX b,
logistic: Y = a/(1 + b exp (−cX)),
Gompertz: Y = a exp ((−b/c) exp (−cX)),
monomolecular: Y = a – b exp (−cX),
where X is the age in months, Y the WH in cm and k a constant depending on the model (mean calculated value of WH at birth in cm).
These equations allow predicting the WH of the horse with only the knowledge of age. Some other models and especially the exponential model and the model of Richards were not tested as the first one has been demonstrated previously to be inaccurate for predicting the horse’s growth, and the second one is a general model (Perotto et al., Reference Perotto, Cue and Lee1992).
Data analysis
Parameters of each model were determined to best fit the measured values for each breed using REG and NLIN procedures in Statistical Analysis Systems Institute (2002), Version 9.1. The adaptation of the models to the measured data was evaluated through the determining coefficient (R 2) and the standard error of estimation (s.e.).
In a second approach, the mean values of WH were established for each breed at standardised ages using the real values obtained from 30 horses measured at the precise age±5 days. The interval of WH values for mature size (at 6 years of age or more) was obtained from the studbooks. Then, the established equations were used to predict WH at the standardised age from birth to 2 years, and at 6 years. The accuracy (per cent) was calculated for each method of estimation when compared with the mean measured value on the 30 horses for each breed. The most accurate method was then determined for each breed.
Finally, the model that was found to best fit the growth for the three breeds was retained to estimate the average growth curves. A simple linear statistical model was subsequently used to examine breed differences on growth related to the shape of the growth curve.
Results
Equations of growth
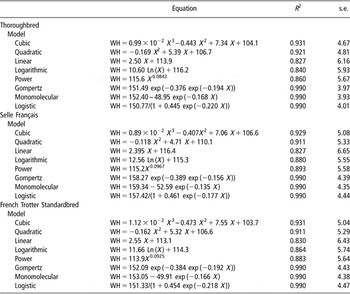
Table 1 gives the equations for growth between birth and 18 months of age for the various models. Determining coefficients (R 2) varied between 0.827 and 0.990, and s.e. varied between 3.93 and 6.65. The highest R 2 and the smallest s.e. were obtained for the Gompertz, monomolecular and logistic models that best fit the measured values. Conversely, the linear model, which was more far from the real values, showed the smallest R 2 and the highest s.e. in the three breeds. The R 2 and s.e. values for quadratic and cubic models were better than those for logarithmic and power models.
Equations of growth for the various models for the three investigated breeds; X = age (months) and WH = wither height (cm)

s.e. = standard error of estimation.
Comparison of growth functions
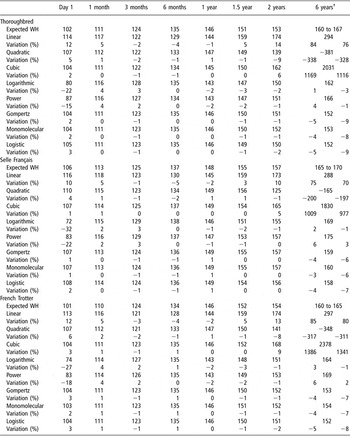
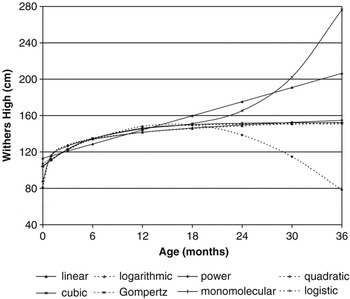
Table 2 gives the average measurements obtained at standard age and the most probable WH calculated using the equations from Table 1. The difference between mean measured values and estimated values is given in percentage (%). All the models gave correct estimation of WH between 1 and 18 months of age, but were inappropriate for estimating WH at birth or/and after 2 years. The linear model systematically overestimated WH at birth and after 18 months of age. The quadratic and cubic models gave correct estimations of WH at birth and up to 18 months (Tb and FT) or 2 years (SF), but they completely lost their accuracy to estimate WH at adult age. The quadratic model underestimated WH after 18 months and gave negative values at 6 years, while the cubic model overestimated WH after 18 months and gave abnormal values (Figure 1). The quadratic model appeared slightly less precise than the cubic model to estimate WH at birth. The logarithmic and power models underestimated WH at birth but gave satisfactory estimation of WH from 1 month until adult age in the three breeds. The Gompertz, logistic and monomolecular models provided good estimations of WH at birth and throughout the measurement period until 3 years of age, but slightly underestimated WH at adult age in the three breeds.
Predicted wither heights (WH, cm) at different ages for each tested model for the three investigated breeds

†Range values obtained from studbooks.
Growth curves obtained from the eight investigated models.

As a consequence, there was no model that completely fit the measured values throughout the growth period. The Gompertz, logistic and monomolecular models appeared adapted and equivalent to estimate WH in the first 2 years. The logarithmic and power model seemed better in the last part of the growth period (2 to 6 years).
Comparison of the three breeds
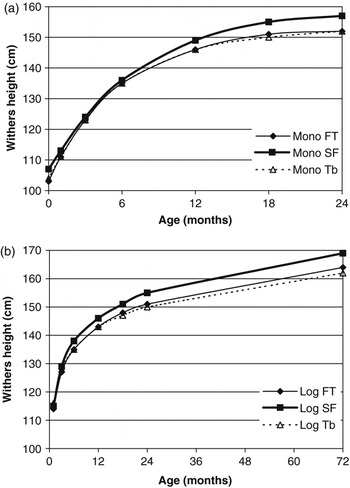
Considering these results, the monomolecular and the logarithmic models were used to compare growth in the three breeds from birth to 18 months and from 3 months to 6 years, respectively (Figure 2). It was not possible to find any difference between breeds at birth and till 1 year. From 15 months to adult age, SF are taller (P < 0.05) than the FT and Tb, and FT are taller (P < 0.05) than Tb. During their first 6 months, the three breeds show the same rapid growth (around 5 cm/month). After 6 months, the growth of Tb and FT slows down more rapidly than the growth of SF (2.6 v. 3.2 cm/month). From 18 months to adult age, the three breeds demonstrate the same slow growth (around 0.3 cm/month).
Average growth curves of Thoroughbreds (Tb), French Trotter Standardbreds (FT) and Selle Français horses (SF) estimated by fitting monomolecular function to the averages of predicted wither heights (WHs) for the first 2 years (a) and logarithmic model for the first 6 years (b).

Discussion
This study evaluates the accuracy of eight models commonly used to describe the growth of domestic animals. It compares the theoretical values to data obtained from a large population of young horses. Values at mature age were obtained from studbooks and are therefore somewhat approximate. Nevertheless, models that were considered inappropriate to describe growth led to errors of about 10 to >100 cm at one time of the growth period, which is very high when compared with the approximation of the studbooks.
Similarly, the use of a height gauge leads to measurement errors, especially in foals and young horses that are difficult to keep in a proper way. It can be assumed that these errors were somewhat minimised, as measurements were always performed by the same person; the habituation of horses, due to repetition of measurements probably contributed to limited errors too. The bias of measurement was evaluated in foals at weaning (personal data) and represents about 1 cm. Once again, this is few when compared with the inaccuracy of several models.
For all three breeds, all the models gave WH estimates that were satisfactory for the period from 3 to 18 months. It was found that most models were inappropriate to estimate WH at birth or after 18 months or 2 years of age and there were almost no breed differences. The linear model was the simplest but least accurate method, being unreliable both at birth and after 18 months of age. The cubic model was an accurate model from birth to 18 months; it is based on measurements made at regular intervals and is therefore not satisfactory in predicting the future growth of foal when it does not lie out any more measures. The monomolecular, Gompertz and logistic models are more satisfactory (R 2 = 0.99) to describe the growth, because they take into account the shape of the curves. They can be recommended to accurately predict a horse’s WH from birth to 2 or 3 years. But these models suffer from the lack of data after 18 months and describe an asymptote after 2 years, which cannot allow for predicting correct WH at 6 years. Except at birth, the logarithmic and power models are reliable until adult age in the three breeds and can be recommended based on the facility of their calculation.
The results of this study clearly show that some of the methods for predicting the WH of horses were more accurate than others. However, it cannot be assumed that one most accurate method can be established for predicting the growth of any horse. At present, it would seem best to recommend methods according to the age, which has been reported previously. To describe the growth of the Ardennes horse, Delobel et al. (Reference Delobel, Vandervorst, Lejeune, De Behr, Serteyn, Dufrasne and Istasse2005) retained the Gompertz and the segment models with two equations applied to foals of 0 to 425 days of age, then followed for horses older than 425 days. Staniar et al. (Reference Staniar, Kronfeld, Hoffman, Wilson and Harris2004) used the sigmoid growth model to describe the growth of 175 Tb foals; they found a systematic deviation in the weight–age data characterised by a decrease and then a subsequent increase in the rate of growth between 210 and 420 days of age.
The growth patterns observed in the three breeds showed very few differences. They all exhibit the same intense growth during the first month. In the first 3 months, growth is most rapid, during the next 3 months it is slightly slower and in the period from 6 to 12 months growth proceeds at much the same rate. Although the growth rate slows down, there are no step changes and there is a steady progression in development. The uniformity of growth for most light horse breeds has been reported earlier (Hintz et al., Reference Hintz, Hintz and Van Vleck1979). The same author explains that large Draught horses apparently reach mature weights later than light horses, which could explain the relative slowest growth in SF (that have a small part of Draught horse genes) than in Tb or FT.
Several studies have examined growth in Tb, and documented measurements in the first and second years of growth. The Tb foals’ average WH in this study closely matched those reported previously (Ruff et al., Reference Ruff, Wood, Aaron and Lawrence1993; Thompson, Reference Thompson1995; Pagan et al., 1996). The averaged WH at 12, 18 and 24 months (146, 151 and 154 cm) were similar to the data presented by Thompson (Reference Thompson1995) and Anderson and McIlwraith (Reference Anderson and McIlwraith2004). Green (Reference Green1969 and Reference Green1976) collected data from foals, yearlings and 2-year-old Tb and found that they were slightly taller than the Tb from our study at birth and 2 years, but gave the same measurements from 3 to 18 months. These results suggest that the growth rates from Tb raised in Basse-Normandy (France) do not differ from those of Tb born in Kentucky, Canada or Great Britain.
In 45 Standardbred foals studied during their first 400 days of life, Persson and Ullberg (Reference Persson and Ullberg1981) observed that the body size increased curvilinearly with a much faster growth rate during the first month of life. These relationships could be fitted to second-degree quadratic functions, but a critical point was noted around 100 days, before and after which the relationship appeared to be approximately linear. After the age of about 100 days, the dimensional growth was retarded. We observed a quite similar pattern in our French Trotter Standardbreds.
The growth of 24 saddle horses from French breeds has been reported by Trillaud-Geyl et al. (2004). They found a WH varying from 156 to 165 cm at the age of 36 months. Our results are compatible with these measurements.
The growth data from 400 foals from three breeds presented here provide useful reference for comparison with new data. In order to prevent musculoskeletal disorders, it is recommended to control growth indeed. Skeleton growth has been shown to be directly proportional to body weight variations in growing horses (Cymbaluk et al., Reference Cymbaluk, Christison and Leach1990; Trillaud-Geyl et al., 2004). Cymbaluk et al. (Reference Cymbaluk, Christison and Leach1990) showed that dietary treatment affected WH. At 24 months of age, their ad libitum-fed horses were 3.6% taller and had a higher occurrence of conformational and musculoskeletal abnormalities than those fed limited amounts between 6 and 24 months. In another study (Ruff et al., Reference Ruff, Wood, Aaron and Lawrence1993), foals diagnosed with cervical vertebral malformation tended to be heavier and taller at some time intervals in their first months of life than normal foals. It is recognised that growth can be easily influenced by the level of feed intake (Hintz et al., Reference Hintz, Hintz and Van Vleck1979), and it has been demonstrated on 36 New Forest filly foals that an imposed restricted nutrition between 6 and 12 months inhibited skeletal growth (Ellis and Lawrence, Reference Ellis and Lawrence1978).
As a conclusion, most models are adapted for describing the growth curve of horses between 1 and 18 months. But only the logarithmic and power model correctly fit the growth curve in the last part of the growth period (2 to 6 years). These models may be used to predict the adult WH from measurements performed in the first months of life, and then design feeding and management schemes in order to let the horse express its maximum genetic growth potential or conversely to limit the growth. The growth rates presented in this paper should help to define normal growth patterns in French horses. They are therefore useful for breeders and practitioners to detect early abnormal growth. These data can be used for comparisons between normal and abnormal growth rates that are necessary to describe the occurrence of orthopaedic diseases in young horses.
Acknowledgements
This work was financially supported by the Haras Nationaux, the Conseil Régional de Basse Normandie, the Institut National de la Recherche Agronomique and the French Ministère de l’Agriculture.