Introduction
The McMurdo Dry Valleys (MDVs) are the largest ice-free region in Antarctica, with a combined area of 4500 km2 (Levy Reference Levy2013). Ice-free conditions are maintained by the presence of the Transantarctic Mountains, which create a precipitation shadow and prevent the flow of the East Antarctic Ice Sheet into the valleys (Fountain et al. Reference Fountain, Nylen, Monaghan, Basagic and Bromwich2010). Taylor Valley has been the site of extensive study by the McMurdo Long Term Ecological Research group (MCM LTER) since the early 1990s. Closed-basin lakes beneath thick perennial ice covers persist in the MDVs because the short summer is warm enough for liquid water inflow into the lakes from glacial melt, yet not warm enough to melt the entire ice cover. An equilibrium ice thickness is maintained by a balance between year-round ablation and new ice forming at the bottom of the ice cover (Obryk et al. Reference Obryk, Doran, Hicks, McKay and Priscu2016). The protection of the ice cover, combined with extreme density stratification from strong salinity gradients, create highly stable water columns in most of the dry valley lakes (Spigel & Priscu Reference Spigel and Priscu1998). Lake temperatures respond to seasonal and annual variations in weather, climate and lake levels in the MDVs, but much less than in temperate lakes (Spigel & Priscu Reference Spigel and Priscu1998).
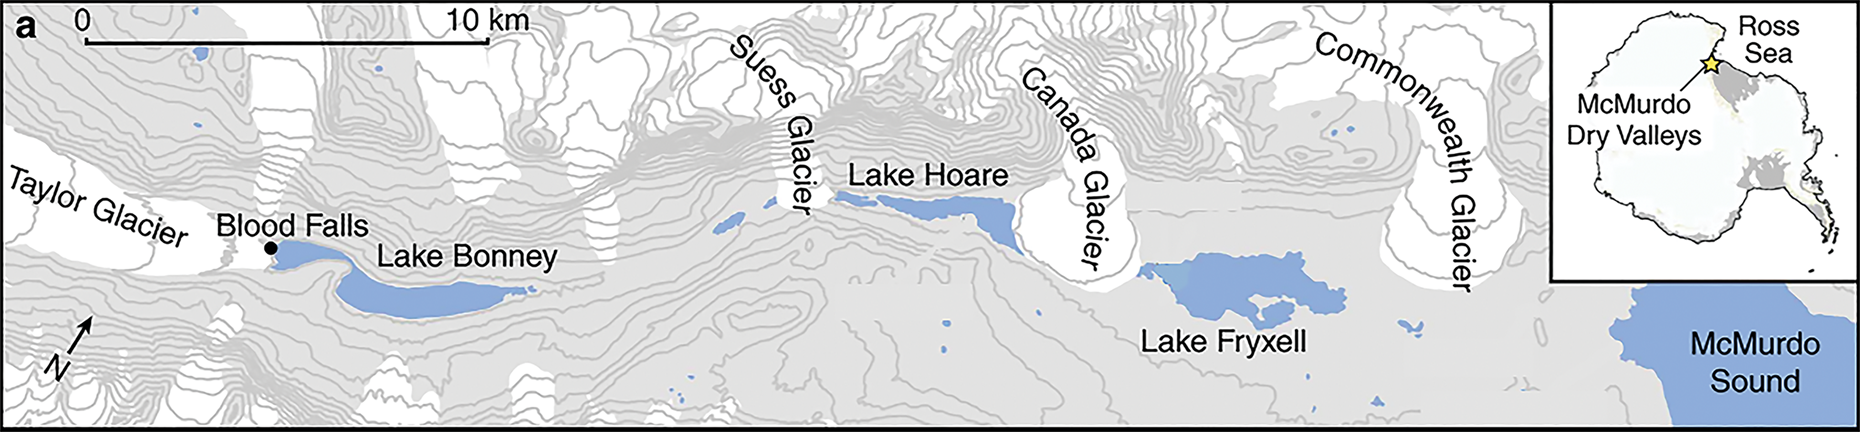
Lake Bonney, the westernmost lake in Taylor Valley, has extreme salinities below the chemocline (Spigel & Priscu Reference Spigel and Priscu1998) due to its evaporative history and the direct input of hypersaline, anoxic and iron-rich subglacial brine (Lyons et al. Reference Lyons, Welch, Snyder, Olesik, Graham, Marion and Poreda2005). The lake is divided into two lobes separated by a shallow sill that restricts exchange of deep water brines between the lobes (Spigel & Priscu Reference Spigel and Priscu1998). West Lobe Bonney (WLB) abuts the terminus of Taylor Glacier, which flows from Taylor Dome on the polar plateau (Fig. 1). The interaction of WLB with the Taylor Glacier terminus causes WLB to be significantly colder and more thermally variable than the East Lobe of Lake Bonney (ELB). Although some water is exchanged between ELB and WLB, particularly above the chemocline (Spigel & Priscu Reference Spigel and Priscu1998, Doran et al. Reference Doran, Kenig, Knoeple, Mikucki and Lyons2014), the biogeochemistry of each lobe is distinct (Lee et al. Reference Lee, Mikucki, Foreman, Priscu, DiTullio and Riseman2004, Priscu et al. Reference Priscu, Christner, Dore, Westley, Popp, Casciotti and Lyons2008). The ice cover thickness and maximum water depth for both lobes ranges from 3 to 4 m and 40 m, respectively (Spigel & Priscu Reference Spigel and Priscu1998, Obryk et al. Reference Obryk, Doran, Hicks, McKay and Priscu2016).
Map of Taylor Valley, with Lake Bonney at the eastern end. The inset shows the location of the McMurdo Dry Valleys on the Antarctic continent. Note the two distinct lobes of Lake Bonney. Adapted from Mikucki et al. (Reference Mikucki, Auken, Tulaczyk, Virginia, Schamper and Sørensen2015).

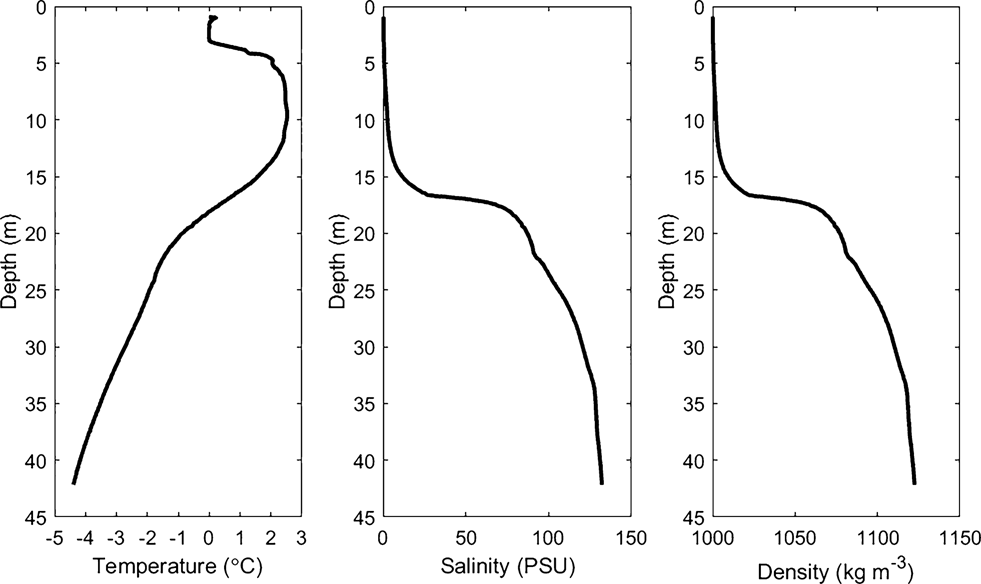
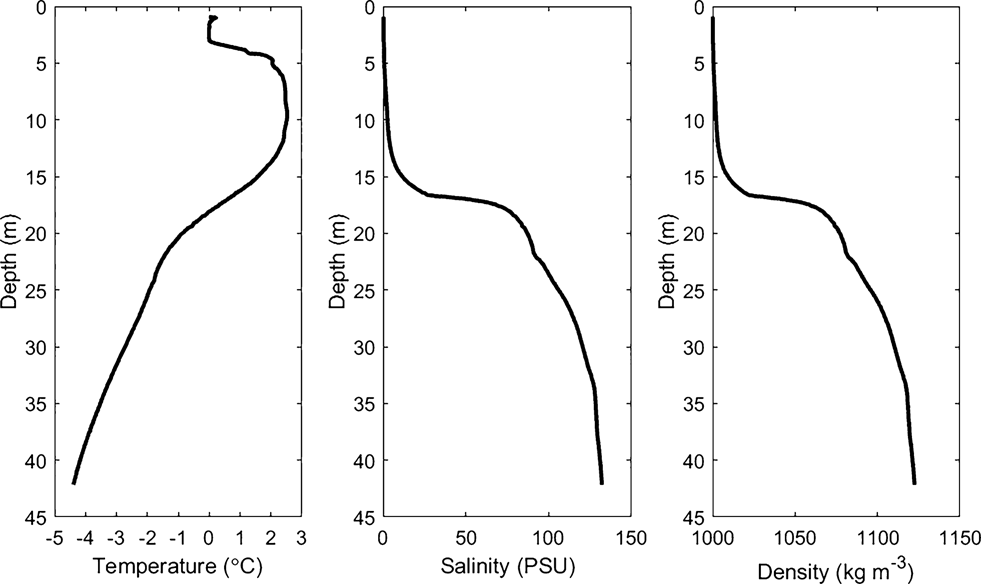
The steep salinity gradient in WLB results in a distinct mid-depth chemocline that produces a highly stable water column (Spigel & Priscu Reference Spigel and Priscu1998, Spigel et al. Reference Spigel, Priscu, Obryk, Stone and Doran2018). Temperature exerts such a small effect on density in WLB that it can be used as a passive tracer to identify water movements in the highly saline water below the chemocline (Spigel & Priscu Reference Spigel and Priscu1998). This scenario is the opposite of that in typical freshwater lakes, where density is primarily determined by temperature and small changes in conductivity can usually be used to trace water movements. The depth of the chemocline in WLB is determined by the elevation of the sill between the two lobes. Salty, dense water that extends above the level of the sill in the west lobe pours over the sill into the east lobe in a phenomenon that has been referred to as ‘chemocline leakage’ (Doran et al. Reference Doran, Kenig, Knoeple, Mikucki and Lyons2014). This net west–east transport through the narrows maintains a sharp chemocline and a peak in stability at the elevation of the sill in the west lobe compared to a more diffuse chemocline in ELB (Spigel & Priscu Reference Spigel and Priscu1998). Typical profiles for temperature, density and salinity for WLB are shown in Fig. 2.
Typical profiles of temperature, salinity and density in West Lobe Bonney from a conductivity, temperature and depth/pressure cast in December 2014. The similar shape of the salinity and density profiles reflects the degree to which salinity determines density below the chemocline (unpublished data from www.mcmlter.org).
The extreme density stratification in WLB inhibits turbulent mixing beneath the ice cover, although turbulent mixing has been observed above the chemocline during one high streamflow event (Foreman et al. Reference Foreman, Wolf and Priscu2004), and in the narrows between the two lobes due to complex exchange flow (Spigel & Priscu Reference Spigel and Priscu1998). Additionally, small oscillations in the salinity and temperature profiles in the region of WLB directly adjacent to the glacier face are evidence of static instability caused by glacial melt (Spigel et al. Reference Spigel, Priscu, Obryk, Stone and Doran2018).
Subglacial aquatic environments in Antarctica have attracted significant attention in recent years due to their importance as isolated biological refugia and for our understanding of sub-ice hydrological systems (Priscu et al. Reference Priscu, Adams, Lyons, Voytek, Mogk and Brown1999, Mikucki et al. Reference Mikucki, Pearson, Johnston, Turchyn, Farǫuhar and Schrag2009, Siegert et al. Reference Siegert, Kennicutt and Bindschadler2013). The hypersaline brine system beneath Taylor Glacier is unique because it lies beneath relatively thin ice and is more accessibly studied at Blood Falls, a surface brine outlet at the northern terminus of Taylor Glacier. Blood Falls is a well-characterized feature in the MDVs due to the visible red stain that iron oxides in the brine form on the surface of the ice. The brine density at the Blood Falls outflow is 1100 kg m-3 (Keys Reference Keys1979) and can remain liquid below -7°C (Badgeley et al. Reference Badgeley, Pettit, Carr, Tulaczyk, Mikucki and Lyons2017). The brine outflow is episodic and highly variable, although Keys (Reference Keys1979) estimated that Blood Falls discharge averages 2000 m3 per year based on the volume of saline icing visible after discharge events. The brine system is hydrologically connected to WLB (Mikucki et al. Reference Mikucki, Auken, Tulaczyk, Virginia, Schamper and Sørensen2015) and strongly influences the geochemistry of the lake (Lyons et al. Reference Lyons, Welch, Snyder, Olesik, Graham, Marion and Poreda2005). The brine is hypersaline, anoxic and has high concentrations of ferrous iron, silica and sulphate (Mikucki et al. Reference Mikucki, Pearson, Johnston, Turchyn, Farǫuhar and Schrag2009). It supports a metabolically active microbial community that influences subglacial weathering of iron and silica, which then enters WLB and influences ecosystem processes (Mikucki et al. Reference Mikucki, Auken, Tulaczyk, Virginia, Schamper and Sørensen2015). The subglacial brine environment may also be an important source of dissolved organic carbon for heterotrophic bacteria in Lake Bonney (Mikucki et al. Reference Mikucki, Foreman, Sattler, Lyons and Priscu2004). The brine is most probably a remnant feature from an incursion of marine water into the MDVs from the Ross Sea during the Miocene, when the MDVs were a series of fjords (Elston & Bressler Reference Elston, Bressler and Mcginnis1981). Radar and airborne transient electromagnetic surveys of Taylor Glacier suggest that liquid brine or brine-saturated sediments lie beneath Taylor Glacier from the terminus to at least 6 km up-glacier (Hubbard et al. Reference Hubbard, Lawson, Anderson, Hubbard and Blatter2004, Mikucki et al. Reference Mikucki, Auken, Tulaczyk, Virginia, Schamper and Sørensen2015).
Subglacial pockets of liquid brine are advected towards the terminus presumably by the dynamic nature of glacier flow (3–4 m yr-1; Pettit et al. Reference Pettit, Whorton, Waddington and Sletten2014). Badgeley et al. (Reference Badgeley, Pettit, Carr, Tulaczyk, Mikucki and Lyons2017) used subglacial hydraulic potential modelling to determine that subglacial brine flows along specific pathways at the bed of the glacier. Badgeley et al. (Reference Badgeley, Pettit, Carr, Tulaczyk, Mikucki and Lyons2017) also identified multiple englacial brine pathways converging at the north end of the terminus, consistent with the Blood Falls discharge location, as well as brine pathways routing towards the southern end of the glacier and towards the middle of the glacier terminus. Physical barriers and differences in surface topography prevent the formation of a system similar to Blood Falls in the southern part of the terminus, and the southern and middle brine pathways are expected to flow directly into the bulk water cavity of WLB (Badgeley et al. Reference Badgeley, Pettit, Carr, Tulaczyk, Mikucki and Lyons2017).
While research has examined surface inflows of brine from Blood Falls into WLB, little work has been able to directly identify the presence and duration of potential subglacial brine flows directly into WLB. Direct subglacial inflows have been suggested through glacial modelling (Badgeley et al. Reference Badgeley, Pettit, Carr, Tulaczyk, Mikucki and Lyons2017) and through physical measurements of the water column near the glacier (Spigel & Priscu Reference Spigel and Priscu1998, Doran et al. Reference Doran, Kenig, Knoeple, Mikucki and Lyons2014, Spigel et al. Reference Spigel, Priscu, Obryk, Stone and Doran2018). However, most past work has focused primarily on brine flow during the summer and has lacked the observations to identify year-round inflows (Spigel & Priscu Reference Spigel and Priscu1998, Spigel et al. Reference Spigel, Priscu, Obryk, Stone and Doran2018). Additionally, little work has examined the role of brine inputs in altering the physical structure and dynamics of WLB (Spigel et al. Reference Spigel, Priscu, Obryk, Stone and Doran2018).
In this study, we examined the wintertime dynamics of subglacial inflow into WLB, as well as their potential role in lake hydrodynamics, at relatively high temporal resolution using a combination of high-frequency, autonomous and manual sensor observations. Deployments of thermistors and combined conductivity, temperature and depth/pressure (CTD) sensors moored year-round beneath the ice cover and manual CTD profiles were used to assess the thermal variability of WLB. With these data, we identified subglacial brine intrusions through anomalously cold temperatures at specific depths. Furthermore, we used wavelet frequency analysis of high-resolution CTD measurements to identify internal hydrodynamic variability within the WLB water column. Lastly, spatially explicit, high-resolution near-glacier CTD profiles provide insight into the behaviour of brine inflows as they intrude into the water column. Our data advance the current understanding of subglacial brine intrusions and their effects on the physical structure of the water column of WLB, a permanently ice-covered proglacial Antarctic lake.
Methods
Our study site is located within the MDVs in Victoria Land, Antarctica, and is associated with the MCM LTER site (Lyons et al. Reference Lyons, Welch, Priscu, Labourn-Parry, Moorhead and McKnight2008, Gooseff et al. Reference Gooseff, Barrett, Adams, Doran, Fountain and Lyons2017).
High-resolution thermistors and CTDs
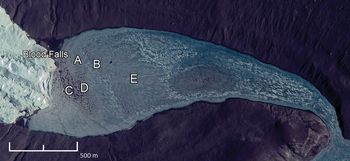
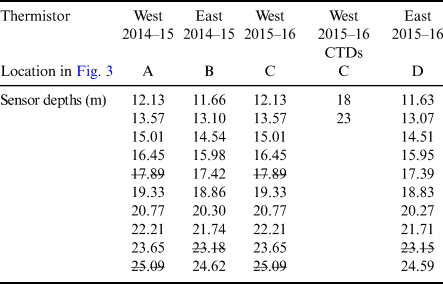
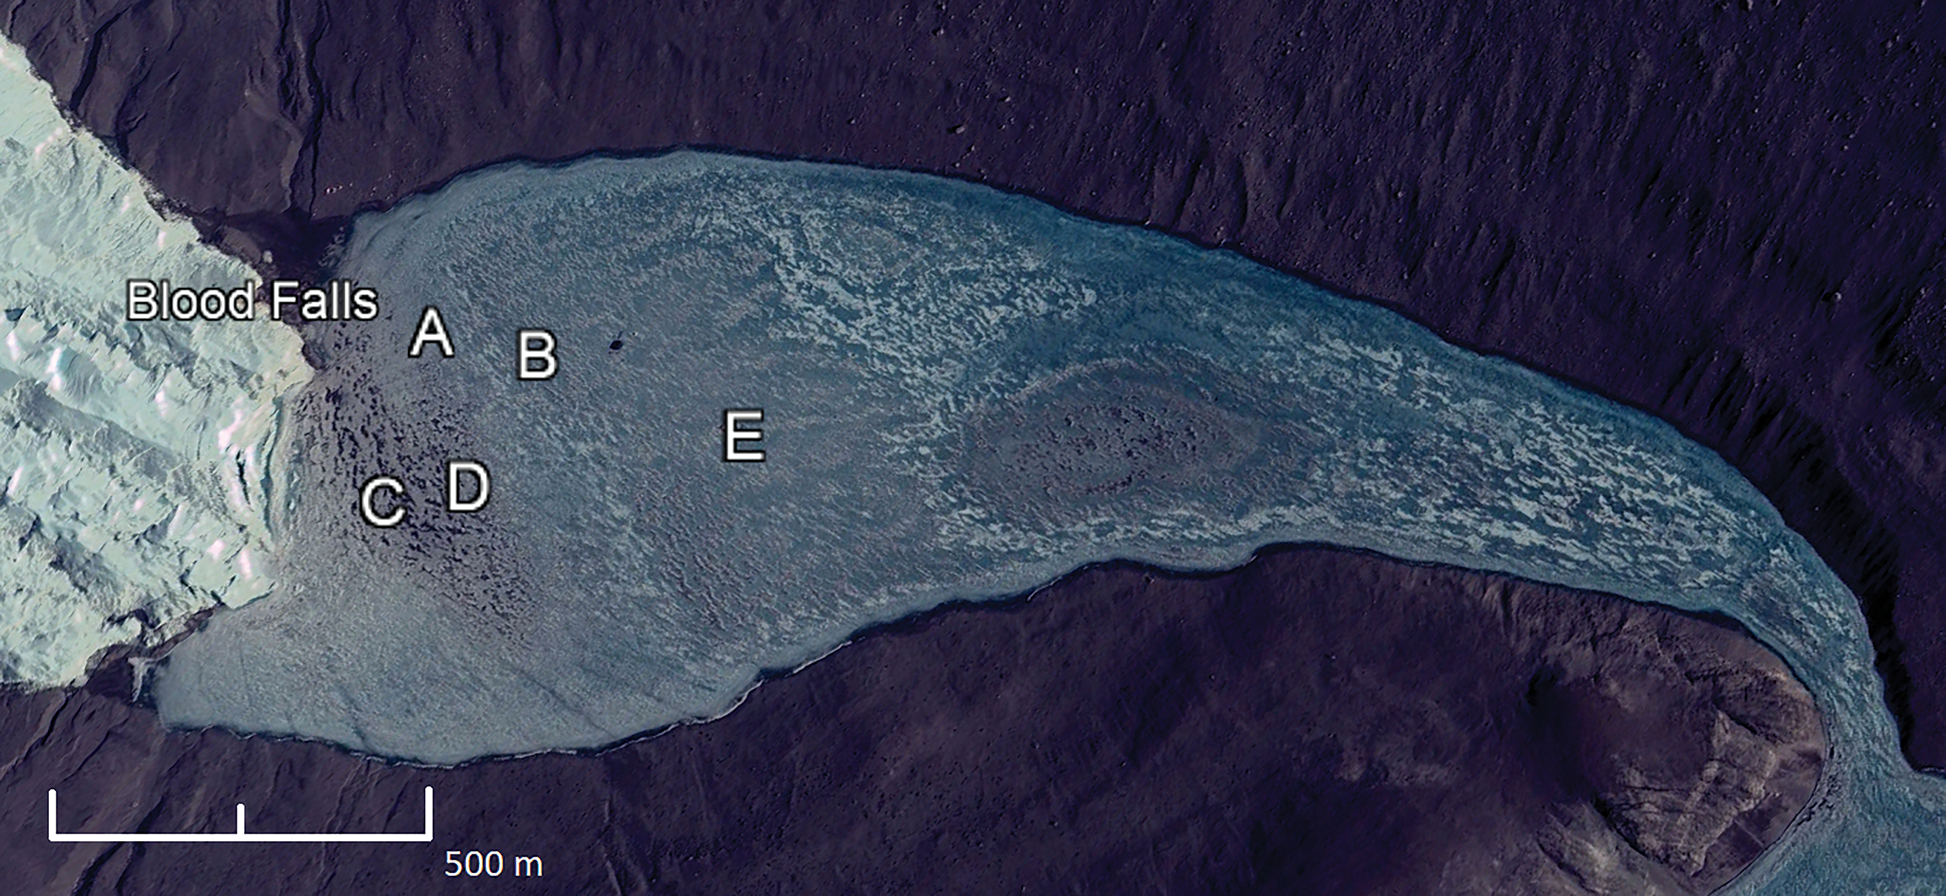
In order to capture year-round temperature and conductivity variability, we used a combination of self-logging RBR Concerto T10 thermistor strings and RBR Concerto CTDs. Two custom T10 thermistor strings were deployed beneath the permanent ice cover in WLB from December 2014 to November 2015 at locations A and B (Fig. 3). In November 2015, the two thermistor strings were relocated towards the centre of the glacier terminus to locations C and D (Fig. 3) in order to better capture potential subglacial inflows (Spigel et al. Reference Spigel, Priscu, Obryk, Stone and Doran2018). Thermistor depths and locations are listed in Table I. In November 2015, two CTDs were deployed at 18 and 23 m at location C.
Satellite image of West Lobe Bonney featuring the locations of the routine McMurdo Long Term Ecological Research group conductivity, temperature and depth/pressure casts (E), thermistor strings (A–D) and Blood Falls. Image from Google Earth on 5 December 2008 (©2017 Google, DigitalGlobe).
Thermistor sensor depths and locations in Fig. 3. The sensor depths that are struck through indicate a thermistor that failed and was deleted from the dataset.

CTD = conductivity, temperature and depth/pressure.
The thermistor strings contained 10 thermistors each, spaced at 1.44 m intervals. Three thermistors failed and were not included in the data presented in Table I. The thermistors have an accuracy of ± 0.002°C. The CTDs have an accuracy of ± 0.002°C for temperature and ± 0.003 mS cm-1 for conductivity. Across most sensors, a 1 min sampling interval was used. The thermistors at locations A and B were deployed at a 15 s sampling interval, but were subsampled to a common 1 min interval for this analysis.
Meteorological data
Wind speeds were recorded at the Taylor Glacier meteorological station, 1 of 12 year-round stations deployed by the MCM LTER. The Taylor Glacier station is installed on the glacier surface 4 km up-glacier from the terminus at an elevation of 334 m (Nylen et al. Reference Nylen, Fountain and Doran2004), which is ~270 m above the surface of the lake ice. The station measures wind speed at 3 m above the glacier surface with an RM Young propeller-type monitor with a stated wind speed accuracy of 2% up to 60 m s-1 (Doran et al. Reference Doran, McKay, Clow, Dana, Fountain, Nylen and Lyons2002). The sensor collects data every 4 s, which is averaged at 15 min intervals and recorded by a Campbell Scientific CR10 data logger. Maximum wind speeds are the highest recorded wind speed over the 15 min record interval.
ENDURANCE CTD profiles
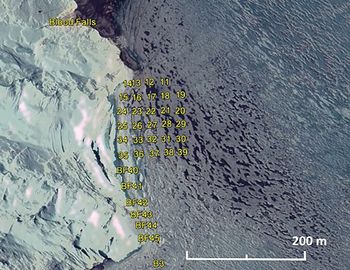
ENDURANCE (Environmentally Non-Disturbing Under-Ice Robotic Antarctic Explorer) was an autonomous underwater vehicle deployed under the ice in Lake Bonney in the 2008–09 and 2009–10 summer seasons (Stone et al. Reference Stone, Hogan, Flesher, Gulati, Richmond and Murarka2010). ENDURANCE performed CTD casts along a 100 m grid survey in WLB and a 25 m grid survey near the terminus of Taylor Glacier. The CTD profiles presented here are from the 25 m grid survey performed on 23–24 November 2009 (Fig. 4). Vertical CTD profiles were made using a SeaBird SBE 19plusV2 SEACAT instrument with an accuracy of ± 0.005°C and ± 0.0005 S m-1. The pressure (depth) sensor sampled at 4 Hz and was deployed at a drop speed of ~0.4 m s-1, resulting in a ~20 cm vertical distance between samples (Spigel et al. Reference Spigel, Priscu, Obryk, Stone and Doran2018).
Map of sampling locations of the ENDURANCE autonomous underwater vehicle on 23–24 November 2009. Image from Google Earth on 5 December 2008 (©2017 Google, DigitalGlobe).

LTER CTD profiles
CTD casts have also been made with a Seabird 25 CTD by the MCM LTER at the centre of WLB (location E in Fig. 3) every summer season since 1993. The instrument has an accuracy of ± 0.001°C and ± 0.0003 S m-1 and is deployed at a drop speed of ~1 m s-1 at a sampling rate of 8 Hz. Owing to vertical density differences down the water column, the CTD pressure sensor does not provide an accurate measurement of depth in the deep saline waters. Consequently, CTD pressure depth measurements from pressure are converted to actual depth measured using a calibrated deployment wire according to the WLB-specific equation:
 $$y = -0.0019x^2 + 1.0162x + 0.8106$$
where x = pressure measured depth (m) and y = wire corrected depth (m). Data are available at www.mcmlter.org.
Analysis
Practical salinity and density are calculated from temperature, conductivity and pressure according to the WLB-specific modified UNESCO Equation of State for seawater (EOS80; Fofonoff & Millard Reference Fofonoff and Millard1983) presented in Spigel & Priscu (Reference Spigel and Priscu1996). These authors modified the UNESCO equations because the conductivity in WLB exceeded those upon which the UNESCO equations were based and the salts within WLB differed from seawater. The modified equations are necessary when practical salinity exceeds 42 PSU. At practical salinities below 42 PSU, the UNESCO equations are adequate. The newer International Thermodynamic Equation of Seawater (TEOS-10; IOC et al. 2010) is not used in this study because the WLB-specific adjustments in Spigel & Priscu (Reference Spigel and Priscu1996) were formulated using the EOS80 formulas.
Thermistor depths are referenced to lake level at the time of their deployment (65.6 m above sea level in November 2014 and November 2015). Lake level during the ENDURANCE mission (November 2009) was 63.9 m above sea level, 1.7 m lower than lake level when the thermistors were deployed. Features identified near 21 m in the ENDURANCE data are therefore deeper below the chemocline (which stays at a constant elevation due to the sill between lobes) than features at 21 m in the thermistor data. MCM LTER CTD profiles are referenced to the closest lake level measurement taken during the same summer.
We used both CTD and thermistor chain data to examine under-ice hydrodynamic temporal and spatial variability. Variability in temperature at each observed depth was compared using a simple standard deviation of the entire year's temperature record. Temperature anomalies were identified where abnormally cold temperatures appeared at specific depths (18–23 m depth) in the water column. In general, water temperature below the chemocline of WLB decreases with depth, with salinity providing the dominant density driver to maintain stratification stability. Temperature anomalies occur in the 18–23 m depth range when colder water of the same density alters the typical temperature profile of the water column below the chemocline. Therefore, a temperature anomaly is defined here as a disruption of the temperature stratification in the lake in which colder water overlies warmer water below the chemocline.
We used water density derived from the CTD data in a frequency analysis to identify the frequencies that may correspond with internal waves and to examine the periods where those frequencies were present. We used a wavelet transform (Torrence & Compo Reference Torrence and Compo1998), which is designed to identify both frequency and duration, to identify both the dominant frequency and the various periods when each frequency is present. Wavelet analysis was performed on water density calculated from the CTD data using the Morlet wavelet according to Torrence & Compo (Reference Torrence and Compo1998) within the Matlab (v2017) scientific computing environment. Dominant frequencies were computed as statistically significant over white noise.
Results
Thermal variability of WLB from over-winter thermistor record
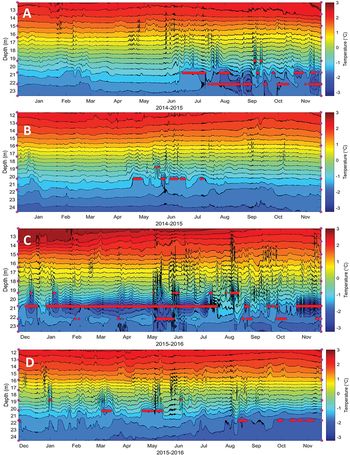
Temperature contour plots from all four thermistor locations are presented in Fig. 5. Anomalously cold temperatures associated with brine inflow affect the water column between 18 and 23 m. Temperature anomalies are more frequent and extreme in the thermistor strings closest to the centre of the glacier terminus (locations C and D). At location C (2015–16), minimum temperatures at the anomaly depths reached -3.1°C at 20.8 m, compared to an average temperature of -1.8°C. Temperature anomalies occur at 20.8 m at location C for 70% of the annual record, including a continuous 5 month period from December 2015 to May 2016 (Fig. 5). Temperature at 20.8 m at location C is also the most variable in the record, with a temperature range of -0.7°C to -3.1°C and a standard deviation of 0.5°C, compared to an average standard deviation of 0.2°C for the thermistors at other depths at location C.
Temperature contour plots of the thermistor strings at each of the four locations from 2014 to 2016. See Fig. 3 for their location on the map. Locations A and B (top) are the western and eastern locations (respectively) in 2014–15. Locations C and D (bottom) are the western and eastern locations in 2015–16. Sensor depths are indicated by pink dots on the y-axis. The isotherm interval is 0.25°C. Temperature anomalies are marked in red at the depth of the thermistor where they occur.

In the eastern thermistor strings (locations B and D in Fig. 3), temperatures between 18 and 23 m are warmer and less variable than in the western thermistor strings closer to the glacier (locations A and C). Similarly to locations A and C, locations B and D are not directly comparable because the data were not collected simultaneously. At location B (2014–15), the furthest location from the glacier terminus, temperature anomalies occur for 8% of the record at 20.3 m, reaching a minimum temperature of -1.8°C. Location D (2015–16) is colder and has more frequent temperature anomaly occurrences than location B, but is warmer overall than location C to the west. Temperature anomalies occur for 8% of the record at 20.3 m and 10% of the record at 21.7 m at location D, reaching a minimum temperature of -1.6°C at 20.3 m and -2.1°C at 21.7 m. Because the thermistor at 23.1 m failed at locations B and D, the anomalies at 21.7 m are based on the temperature at 24.6 m and are probably underestimated.
Frequency analysis of CTDs and correlations with surface wind speeds
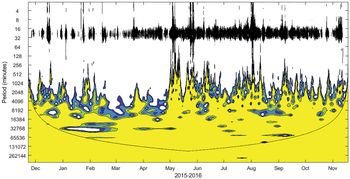
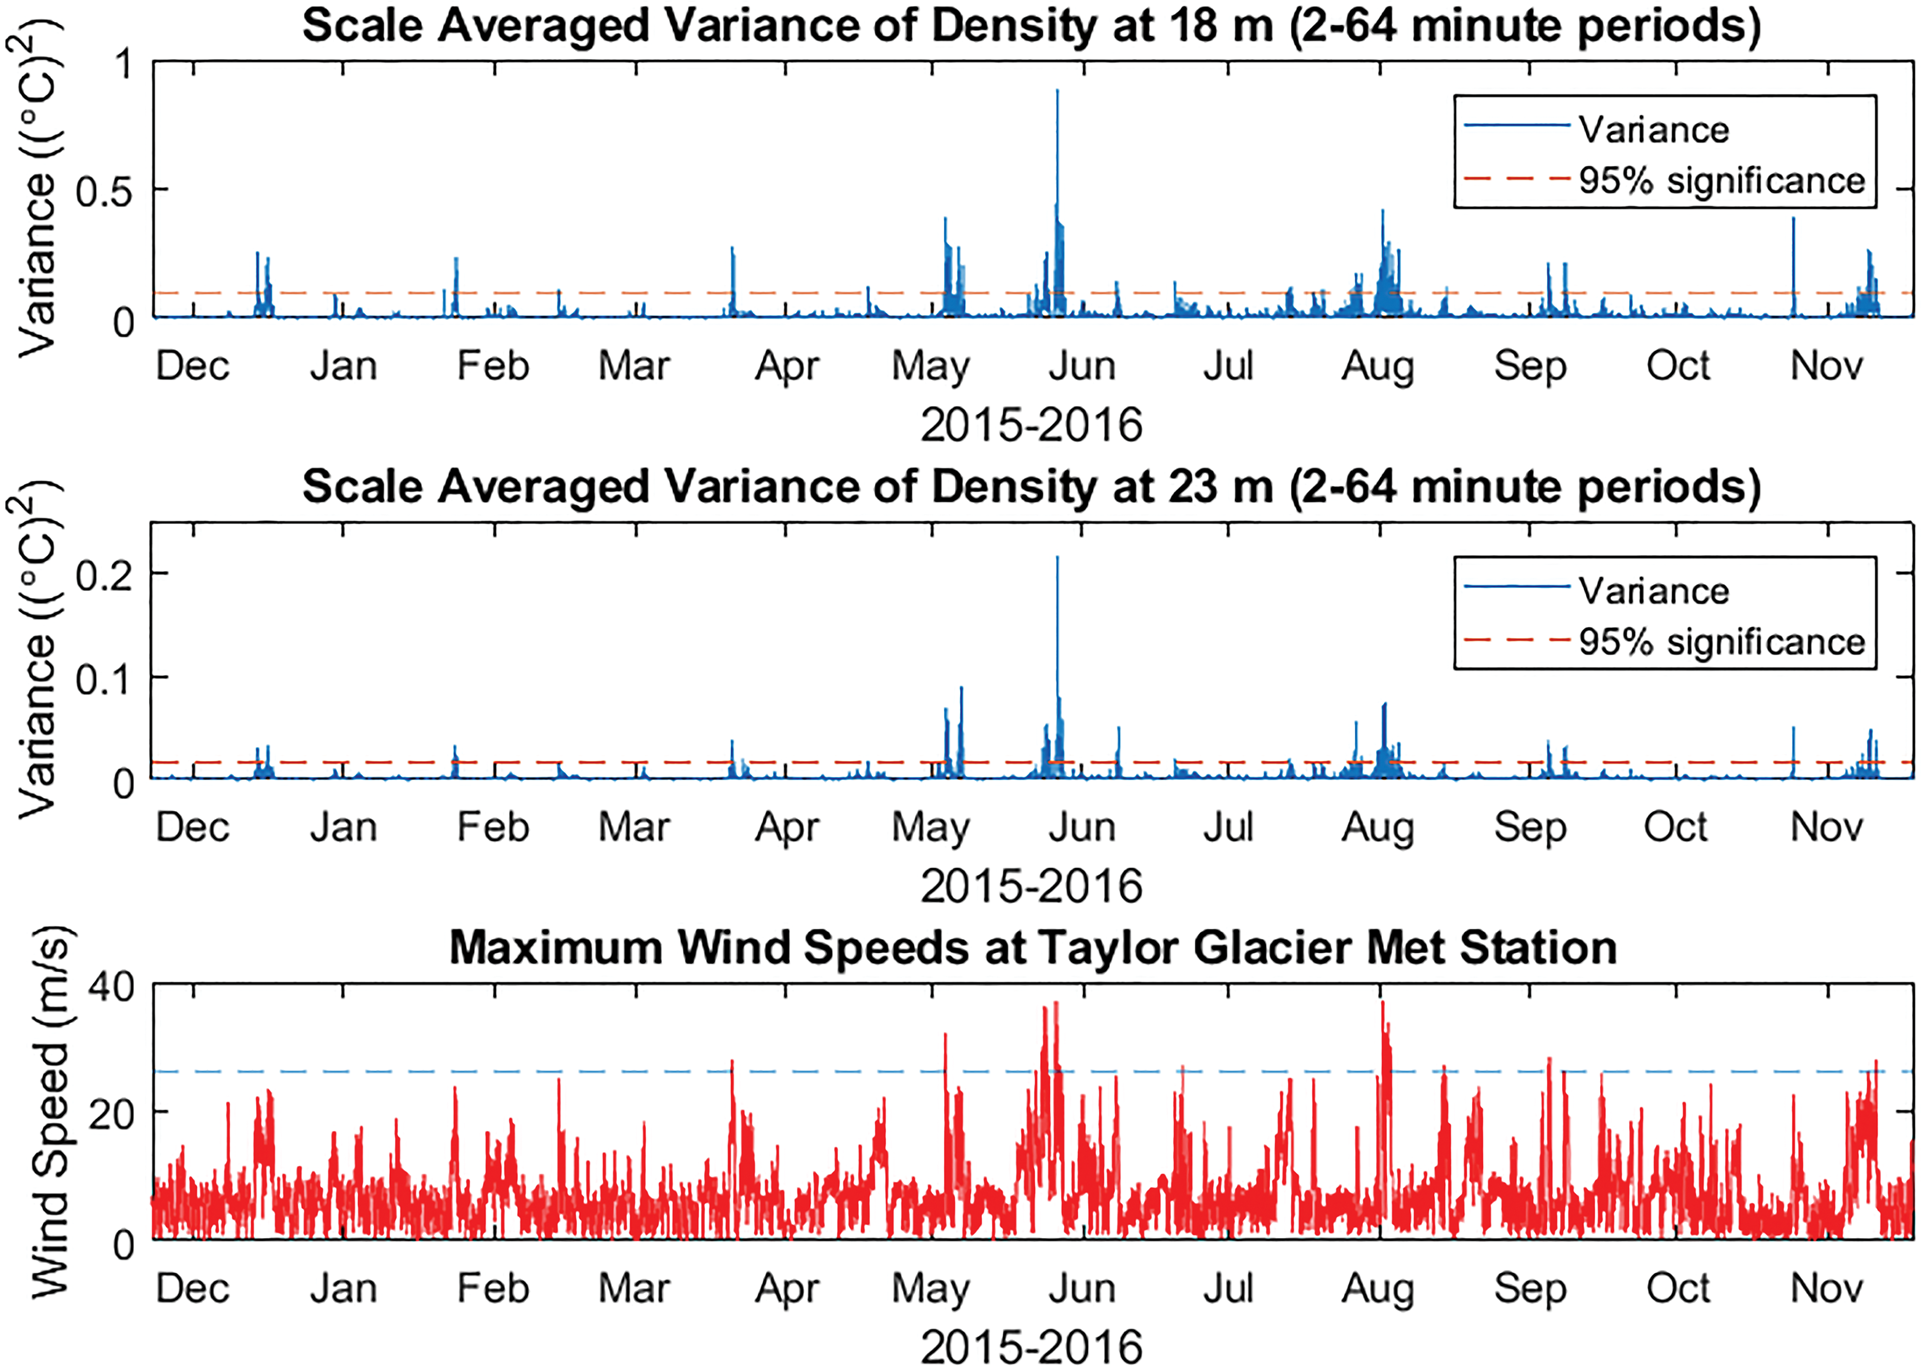
Wavelet analysis of water density at location C shows significant wavelet power at periods of < 1 h. The normalized wavelet power spectrum is shown in Fig. 6. Scale-averaged wavelet power (the average variance between 2 and 64 min periods) of water density at 18 and 23 m is shown in Fig. 7 and demonstrates a strong correspondence with maximum wind speeds at nearby Taylor Glacier Met Station. Variance has no direct linear relationship with maximum wind speeds, although all wind events with maximum wind speeds exceeding 26 m s-1 are correlated with significant wavelet power at 18 m. All other events with significant wavelet power at 18 m are correlated with wind events with maximum wind speeds of at least 18 m s-1. Maximum scale-averaged wavelet power occurred in late May 2016 during a katabatic event when maximum wind speeds exceeded 37 m s-1.
Normalized wavelet power spectrum using the Morlet wavelet of 1 min water density data from 18 m at location C from 2015 to 2016. Contours are at normalized variances of 1, 2, 5 and 10 (navy, blue, green and yellow, respectively). The black curve marks the cone of influence where edge effects become important. The black band across the top of the graph (at periods < 1 h) indicates times when there was significant wavelet power at this location, suggesting the presence of internal waves at 18 m in the water column.

Scale-averaged variance of density over periods of 2–64 min at 18 m (top) and 23 m (middle) at location C is correlated with the maximum wind speeds at the nearby Taylor Glacier Met Station (bottom). All wind events with wind speeds exceeding 26 m s-1 (blue line) are correlated with significant wavelet power of density at 18 m.

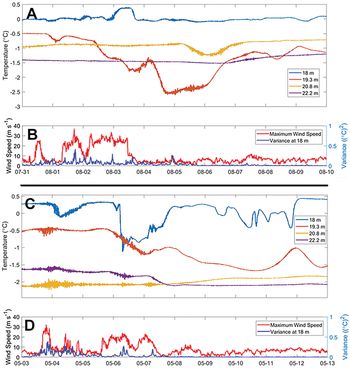
Wavelet power of density is also associated with steep drops in temperature, or ‘brine pulses’, that occur in the western thermistor string (location C) shortly after strong winds subside. All instances in which scale-averaged variance at 18 m from 2 to 64 min (Fig. 7) exceeds 0.2°C2 during the winter are correlated with a decrease in temperature of at least 0.5°C at one of the thermistors between 18 and 21 m within 48 h of the wind event. The temperature decreases range from 0.5°C to 2.0°C and occur over a range of 1–6 days. With the exception of the katabatic event in late May 2016, all of the temperature decreases occurred at only one thermistor at either 18.0, 19.3 or 20.8 m. In late May 2016, the temperature decreases occurred at both the 19.3 and 20.8 m thermistors. Brine pulses occur at these depths at other times and are not always associated with wind or wavelet power. Figure 8 shows two examples of brine pulses in 2016.
Brine pulses are shown as temperature decreases at location C in August 2016 (a. & b.) and May 2016 (c. & d.) that are correlated with high winds at Taylor Glacier Met Station and high wavelet power over periods of 2–64 min at 18 m at location C. In August 2016, temperature at 19.3 m decreased by 2°C between 1 and 4 August after wind speeds reached 37 m s-1 and variance reached 0.42°C2 on 1 August. In May 2016, temperature at 19.3 m declined by 1.2°C between 5 and 10 May after wind speeds reached 32 m s-1 and variance reached 0.38°C2 on 3 May.

Near-glacier ENDURANCE CTD profiles
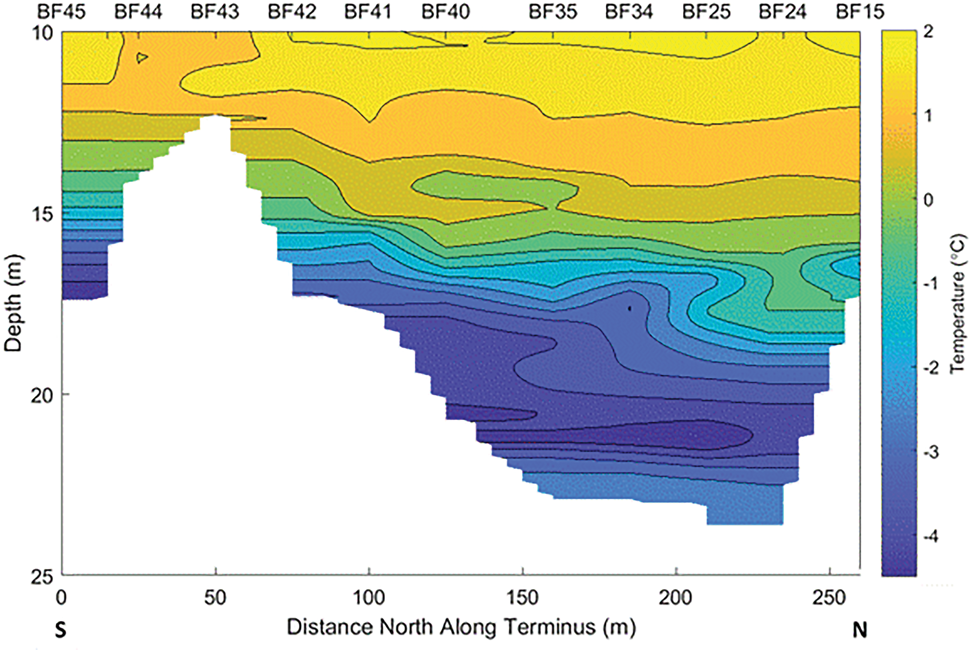
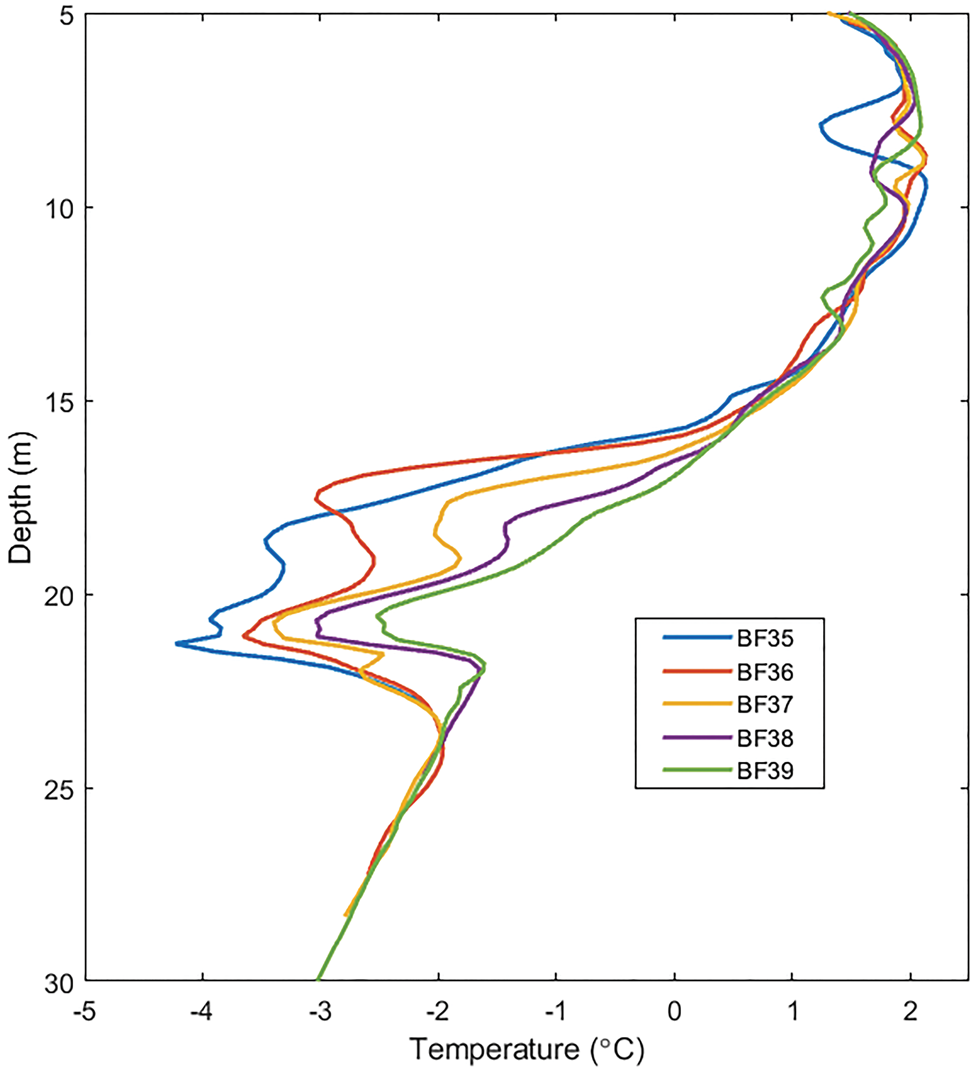
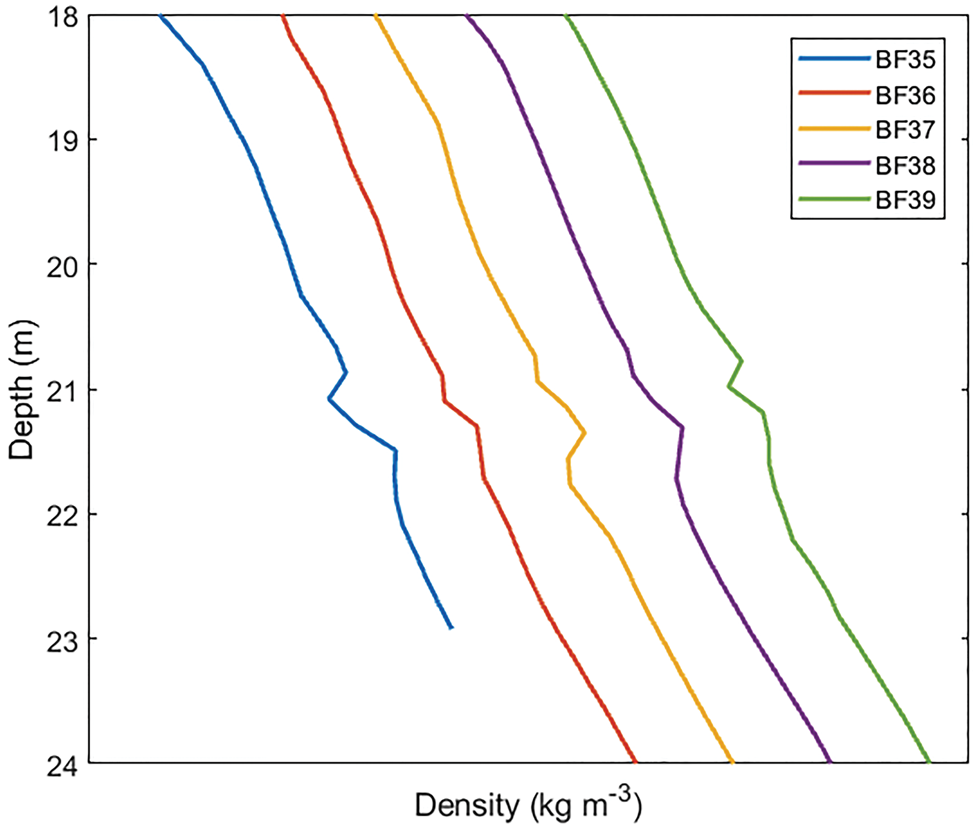
All ENDURANCE temperature profiles near the glacier showed strong temperature anomalies at ~21 m depth. Figure 9 demonstrates the variability of temperature along the front of the glacier terminus. The minimum temperature observed near the glacier was -4.5°C at the southernmost point in the transect (BF45 in Fig. 4). The temperature minimum occurred at the deepest part of the water column at BF45 at 17.5 m depth and is > 4°C colder than the temperature at that depth elsewhere in the lake. Colder than average temperatures at BF45 (relative to other temperature profiles near the glacier) extend from ~12 to 17 m depth, although the salinity profile is typical at those depths. The depth of the lake north along the glacier terminus remains shallow (< 20 m) until BF40 (100 m north along the terminus), where a minimum temperature of -4.3°C occurs at ~21 m and the density profile becomes unstable from 20 to 21 m depth. The water column at BF40 between 18 and 20 m is cold (average temperature of -3.75°C) relative to other locations in the lake, and salinity values are typical. The cold anomalies (reaching a minimum of -4.4°C) and inversions in the density profile at 21 m persist for another 100 m north along the transect until the bathymetry of the lake becomes shallow again. The east–west transects extending away from the glacier face show that the temperature anomaly persists for at least 100 m away from the terminus, although the anomaly weakens as the minimum temperature increases with distance from the glacier (Fig. 10). The unstable density profile at 21 m persists for at least 100 m away from the glacier face (Fig. 11).
Temperature contour plot of a transect across the front of the terminus of Taylor Glacier from 10 to 25 m depth performed on 23–24 November 2009 by the ENDURANCE autonomous underwater vehicle. Isotherm intervals are 0.25°C. Sampling locations are listed at the top of the image and correspond to sites in Fig. 4.

Temperature profiles from ENDURANCE conductivity, temperature and depth/pressure casts at four locations spaced 25 m apart, heading east away from the glacier face (BF35–BF39 in Fig. 4). The temperature anomaly at 21 m diminishes with distance from the glacier face (see Figs 12, 13 for examples of the diminished temperature anomaly in the centre of the lake).

Density profiles from 18 to 24 m at locations BF35–BF39 (see Fig. 4). The x-axis ticks and each profile are spaced 5 kg m-3 apart. Instability in the density profiles at 21 m persists to at least BF39, which is 100 m further from the glacier terminus than BF35. The instabilities occur where density is ~1080 kg m-3.

Long-term LTER CTD profiles
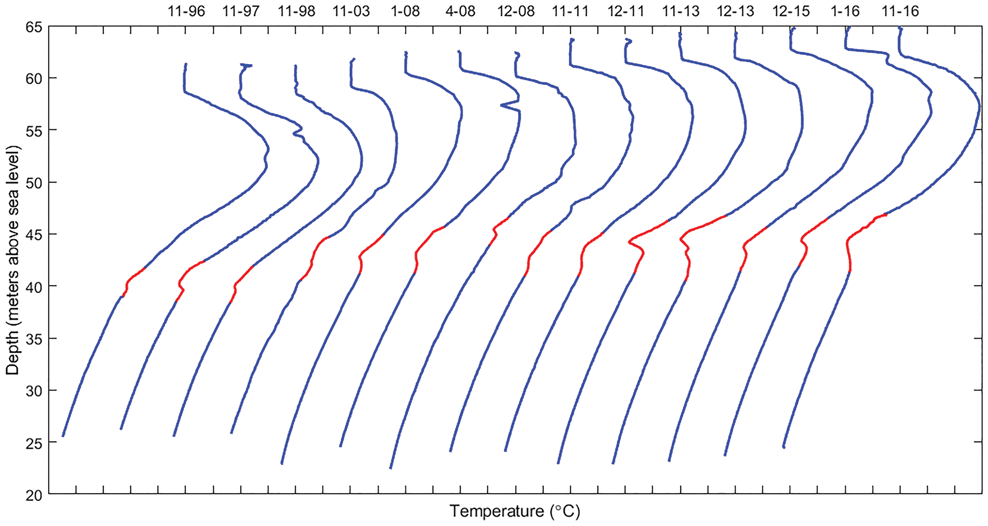
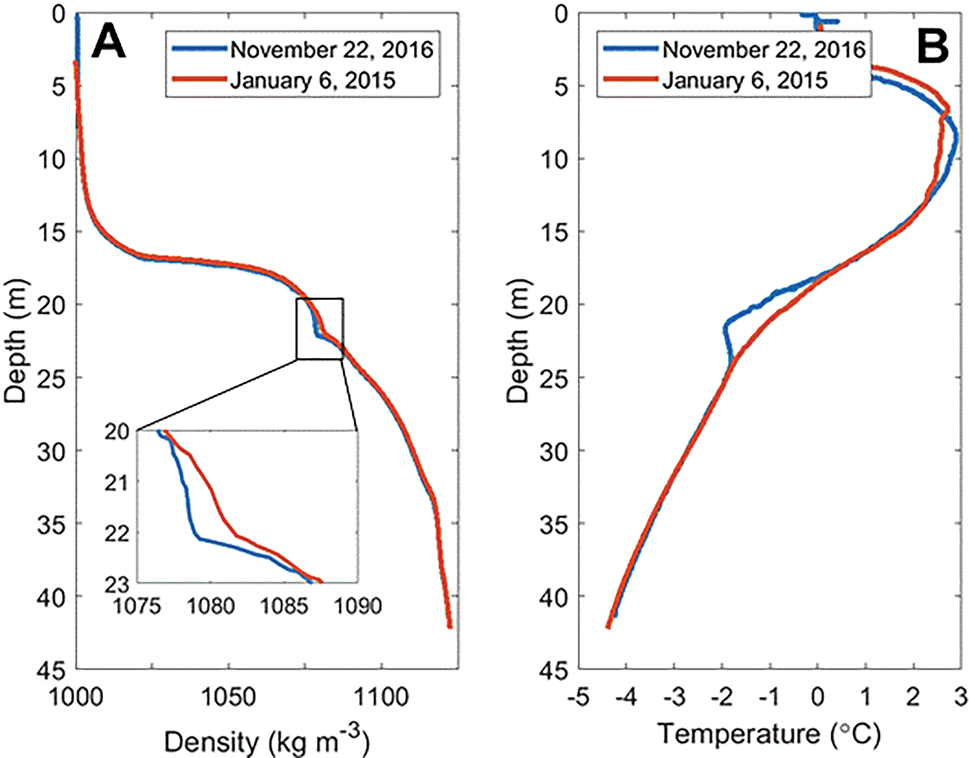
Cold temperature anomalies associated with brine inflow were present in 14 of the LTER CTD profiles between 1996 and 2016 (Fig. 12). The cold temperature anomalies did not correspond with density instabilities as seen in the near-glacier ENDURANCE profiles. These anomalies did not occur every year but were present during 9 of the 21 summer seasons on record. The density profile of the water column has a weaker density gradient at the depths where temperature anomalies are present. At one instance, the density gradient is weak enough to approach isopycnal conditions between 20 and 22 m depth (Fig. 13).
All temperature profiles from the McMurdo Long Term Ecological Research (MCM LTER) group record that show cold temperature anomalies, where temperature increases with depth below the chemocline. The anomalous depths are highlighted in red. Profile months and years are listed at the top. The x-axis ticks are spaced 1°C apart, and each profile is spaced 2°C apart. Data from the MCM LTER are available at www.mcmlter.org.

a. Density profiles at location E on 22 November 2016 and 6 January 2015. The inset shows the weaker density gradient that occurred concurrently with the temperature anomaly in November 2016. b. Temperature profiles at location E on 22 November 2016 and 6 January 2015.

Discussion
Our high-frequency, over-winter temperature dataset revealed direct evidence of subglacial brine inflows into WLB from Taylor Glacier. Temperature anomalies that occur year-round indicate that brine inputs to the water column are not limited to Blood Falls flow during the summer. Although relative input volumes from surface and subglacial sources are unknown, subglacial inputs could potentially contribute on an annual basis as much or more brine than surface input from Blood Falls. The addition of this nutrient-laden, microbially active brine may contribute to the biogeochemistry in the deep waters of WLB, and would contribute isotopically dead carbon without atmospheric equilibration (as seen in Blood Falls outflow), an important component in reconstructing the geochemical history of the basin (Doran et al. Reference Doran, Kenig, Knoeple, Mikucki and Lyons2014).
Cold temperature anomalies in WLB occur where the density of the water column ranges from 1060 to 1090 kg m-3 (~18–23 m depth in 2016). Temperature anomalies associated with brine inflows are most commonly observed at depths where the density of the water column is near 1080 kg m-3. The eventual density of brine inflows presumably depends on the degree of dilution with glacial melt and the amount of initial mixing as the brine enters the lake and migrates to the depth of neutral buoyancy. Cold temperature anomalies between 18 and 23 m depth can be attributed to brine inflows because of the similar density of the water column at those depths to the density of Blood Falls brine (1100 kg m-3) (Keys Reference Keys1979) and because glacial meltwater below the chemocline does not behave in a way that would create similarly cold temperatures at those depths. Latent heat transfer from the melting face of Taylor Glacier results in colder temperatures in the water column of WLB near the terminus compared to the rest of the lake (Spigel et al. Reference Spigel, Priscu, Obryk, Stone and Doran2018). Glacial melt below the chemocline propagates into the lake as a series of nearly horizontal intrusions that are visible in fine-scale measurements as oscillations in the temperature and salinity with an average thickness of ~23 cm (Spigel et al. Reference Spigel, Priscu, Obryk, Stone and Doran2018). The meltwater intrusions quickly become stable with distance from the glacier face (Spigel et al. Reference Spigel, Priscu, Obryk, Stone and Doran2018). Large-scale intrusions of anomalously cold water can therefore be attributed to brine inflow rather than glacial melt.
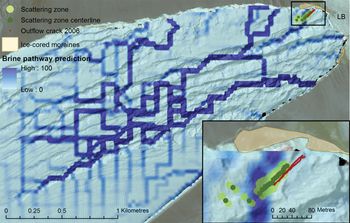
Direct subglacial brine input into WLB (as a separate mechanism from surface brine input at Blood Falls) has been proposed by other researchers (Spigel & Priscu Reference Spigel and Priscu1998, Doran et al. Reference Doran, Kenig, Knoeple, Mikucki and Lyons2014, Badgeley et al. Reference Badgeley, Pettit, Carr, Tulaczyk, Mikucki and Lyons2017, Spigel et al. Reference Spigel, Priscu, Obryk, Stone and Doran2018). Spigel et al. (Reference Spigel, Priscu, Obryk, Stone and Doran2018) identified the same temperature anomalies as evidence of brine inflow from the ENDURANCE data collected in the summer of 2009. This paper expands on their findings by introducing novel year-round temperature and CTD data that definitively show that some brine intrusions come from a subglacial source, as well as identifying internal waves for the first time in Lake Bonney. Evidence of brine intrusions in the water column during the summer cannot be differentiated between surface or subglacial sources. The open water moat around the perimeter of the lake permits surface brine flow at Blood Falls to flow directly into the water column during the summer. The freezing of the moat during the winter months prevents hydrological connectivity between surface brine discharge at Blood Falls and the water column of WLB. Cold temperature anomalies that occur in the winter must therefore come from an englacial or subglacial source below the ice cover of WLB. Badgeley et al. (Reference Badgeley, Pettit, Carr, Tulaczyk, Mikucki and Lyons2017) used hydraulic potential modelling to determine that subglacial brine in the northern half of the glacier terminus would be routed to a series of pressurized basal crevasses associated with Blood Falls, while subglacial brine in the southern half of the glacier terminus region would flow directly into Lake Bonney (Fig. 14). The recurrent temperature anomaly found near 21 m in the thermistor data is probably a result of these southern and middle brine pathways that advect subglacial brine directly into Lake Bonney.
Aerial photograph of the terminus of Taylor Glacier, with subglacial brine pathways as predicted by hydraulic potential calculations superimposed in dark blue. Brine in the northern half of the terminus will be routed towards Blood Falls, while brine from the southern and middle pathways will flow directly into West Lobe Bonney. Inset is a detail of the Blood Falls area. Reproduced from Badgeley et al. (Reference Badgeley, Pettit, Carr, Tulaczyk, Mikucki and Lyons2017).

The near-glacier ENDURANCE CTD profiles performed on 23–24 November 2009 (Figs 9–11) provide insight into the behaviour of brine inflows as they enter the lake. The interpretations presented here assume that brine inflows at this depth occur at weeks-long time scales and that significant changes to the temperature and salinity structure of the lake did not occur over the sampling period. Therefore, the data presented here are intended as a ‘snapshot’ of the water column during a brine inflow event. The profiles suggest that the dense brine sinks as a gravity current along the lake bed to the depth of neutral buoyancy. The coldest temperatures of the survey are found at the southernmost profile in the transect (BF 45 in Fig. 9), suggesting that the brine entry point is near the southern end of the glacier terminus, consistent with predictions from Badgeley et al. (Reference Badgeley, Pettit, Carr, Tulaczyk, Mikucki and Lyons2017). The typical density and salinity profiles at BF45, coupled with colder temperatures, suggest prior mixing with brine inflows that resulted in colder than average temperatures after the typical density stratification was re-established. As liquid brine within Taylor Glacier has been measured at -7°C (Badgeley et al. Reference Badgeley, Pettit, Carr, Tulaczyk, Mikucki and Lyons2017), temperatures within the water column approaching -5°C are reasonable for brine inflows that have entered the lake and mixed to some degree with the warmer ambient water. The initial mixing with glacial melt as brine enters the water column may result in a greater amount of turbulence and heat transfer than the subsequent entrainment of cold water from density-driven flows down the side of the lake bed before the brine intrudes into the water column at the depth of neutral buoyancy. The abnormally cold temperatures and typical salinity values between 18 and 20 m at BF40 may similarly reflect mixing with brine that previously flowed north down the lake bed from a southern entry point near BF45.
Large temperature anomalies (reaching a minimum of -4.4°C) and density instabilities are present at 21 m in all of the near-glacier ENDURANCE profiles and are representative of a recent brine inflow intruding into the water column at the depth of neutral buoyancy. The density instabilities suggest that the brine intrusion caused a mixing cell < 1 m thick to form at that depth (Fig. 11). Because the density instability at 21 m persists across all of the near-glacier profiles, overturning of the water column caused by brine intrusions continues for at least 100 m away from the glacier face. The decay of the temperature anomaly with distance from the glacier face (Fig. 10) further supports the concept of cold brine inflows quickly warming as they mix with the warmer adjacent lake water of equal density. Once a stable density configuration is established at the depth of the intrusion, the temperature anomaly will dissipate more slowly via diffusive heat transfer with the surrounding water.
Subglacial brine intrusions in WLB have a significant effect on the thermal stratification of the lake throughout the year. Temperature anomalies occur for 70% of the annual record at 20.8 m at location C (Fig. 5), which serves as a lower bound for the amount of time brine intrusions are present at that depth. Temperature anomalies at the other thermistor locations (A, B and D) are most common between 20.3 and 21.7 m, which is consistent with brine intrusions travelling laterally through the water column, most often near 21 m depth, and slowly cooling the water above and below the intrusion until thermal equilibrium is achieved.
Summer CTD casts performed annually since 1993 at location E show that cold brine inflows reach the centre of WLB frequently, but that the timing of those events is inconsistent and shows no discernible pattern between years (Fig. 12). However, the open moat during the summer makes it impossible to differentiate between subglacial brine intrusions and surface brine entry from Blood Falls in most of the profiles in the long-term record. Temperature anomalies in the summer at location E are probably from a combination of surface and subglacial brine sources. Regardless, the persistence of anomalously cold water beneath the chemocline over a 20 year record demonstrates that there are frequent inputs of sufficient volumes of brine to affect the water column at a location ~600 m away from the glacier face.
Larger brine intrusions affect the density stratification of the water column for several hundred metres away from the glacier face. The CTD profile at location E on 22 November 2016 exhibits a weak density gradient between 21 and 22 m and lower densities than typical from 20 to 23 m (Fig. 13). The weak density gradient at this depth may be a remnant of a mixing cell that formed as the brine intruded at the glacier face and resulted in a layer of isopycnal water containing the cold temperature signal. The brine intrusion dissipates as it migrates laterally into the lake and the density gradient would eventually return to its typical profile. The degree of deviation of the density profile from its typical gradient towards a weaker gradient may therefore give some indication of the volume of brine inflow. The slope of the density profile shifts slightly at 21 m even in years when no temperature anomaly is present, suggesting that brine inflows may have a cumulative effect on the density stratification of the water column over time. Layers of weakly stratified water associated with brine intrusions may be susceptible to mixing during periods of internal waves. Weak density stratification associated with brine inflows at location E in the centre of WLB suggests that the conditions may be met for a layer of isopycnal or weakly stratified water several metres thick at location C closer to the source of brine inflows.
The correspondence between wavelet power of water density and extreme wind speeds indicates that strong katabatic wind events initiate internal waves beneath the chemocline in the deep waters of WLB (Fig. 7). This finding contradicts the long-held assumption that the thick perennial ice cover prevents wind-induced mixing in Taylor Valley lakes (Wharton et al. Reference Wharton, McKay, Clow and Andersen1993, Spigel & Priscu Reference Spigel and Priscu1998). Although summer surface seiching has been observed in Lake Vanda, which lies in the Wright Valley (Heine Reference Heine1971), this is the first evidence of internal waves occurring at depth in the Taylor Valley lakes. Under-ice seiching has been observed in small freshwater lakes in Sweden and Russia caused either by wind forcing on the ice cover or variable air pressure fields (Bengtsson et al. Reference Bengtsson, Malm, Terzhevik, Petrov, Boyarinov, Glinsky and Palshin1996, Malm et al. Reference Malm, Bengtsson, Terzhevik, Boyarinov, Glinsky, Palshin and Petrov1998). The roughness of the ice cover over WLB's 1 km2 surface (Wharton et al. Reference Wharton, McKay, Clow and Andersen1993, Spigel & Priscu Reference Spigel and Priscu1998), in combination with extreme wind speeds exceeding 37 m s-1, could be a contributing factor in generating enough pressure on the surface of the ice cover during katabatic events to induce internal waves despite an ice thickness of 3–5 m.
The under-ice internal waves may be an additional mechanism that triggers brine release, as short-lived, large temperature anomalies (‘brine pulses’) usually occur shortly after peaks in wavelet power that are associated with katabatic events (Fig. 8). The exact mechanism linking internal waves and brine release remains unclear, but it is possible that pressure changes at the glacier face caused by internal waves could trigger brine release from the system of pressurized basal crevasses proposed in Badgeley et al. (Reference Badgeley, Pettit, Carr, Tulaczyk, Mikucki and Lyons2017). The brine pulses appear at variable depths and usually at a shallower depth than the most common brine inflow at ~21 m, which suggests brine is released above the chemocline (i.e. from the pressurized basal crevasses near Blood Falls) and mixes with freshwater before it sinks below the chemocline. Brine pulses occur in the summer, but they do not correspond with wavelet power in the summer months. The open moat during the summer could allow dissipation of the energy and pressure changes caused by internal waves. Additionally, it is possible that the water column is more susceptible to mixing during internal wave events at the depths where brine intrusions have weakened the density gradient. The internal waves may therefore facilitate both brine release at the glacier face and geochemical transport of subglacial brine into the water column, beneath the chemocline at the depth of the brine intrusions.
The relationship between wind events, brine release and internal waves is likely to be complex. Internal waves in the water column may be induced directly by strong winds at the surface as proposed. Alternatively, strong winds may initiate the release of brine that then forms a gravity current along the lakebed as it intrudes into the water column. Gravity currents have been shown to generate internal waves and instabilities in both experimental tank systems (Maxworthy et al. Reference Maxworthy, Leilich, Simpson and Meiburg2002) and in natural systems including Lake Kinneret (Nishri et al. Reference Nishri, Imberger, Eckert, Ostrovsky and Geifman2000). Future research should expand upon the relationship between brine release mechanisms within the glacier, surface conditions including wind, and internal waves in the water column of WLB.
Conclusions
Our study is the first to demonstrate that brine enters WLB through subglacial sources independent of Blood Falls. Subglacial brine discharge is demonstrated through thermal evidence of brine intrusions during the winter, when the frozen moat ice prevents hydrological connectivity between surface brine discharge at Blood Falls and the water column of WLB. This study is also the first continuous record of subglacial brine intrusions and their effect on the thermal and density stratification of WLB. The prevalence of temperature anomalies in the continuous and long-term records indicates that subglacial and surface brine release are ongoing processes that strongly affect the thermal structure of WLB below the chemocline. Additionally, the discovery of potential wind-induced internal waves in the winter challenges the assumption that the perennial ice cover provides an extremely stable environment that is not affected by surface processes. Internal waves, and potentially mixing at the depth of the brine intrusions, has implications for geochemical transport and for biological connectivity in WLB.
The volume of brine outflow is important in determining the geochemical history of the lake and for understanding the heat and salt budgets as well as the biogeochemistry of WLB and ELB. Evidence of subglacial brine discharge supports the finding of hydrological connectivity between the subglacial brine system, Blood Falls and WLB proposed in Mikucki et al. (Reference Mikucki, Auken, Tulaczyk, Virginia, Schamper and Sørensen2015) and provides greater insight into this novel subglacial groundwater system.
Acknowledgements
The authors would like to thank two anonymous reviewers for their time and helpful edits.
Author contributions
JPL analysed the data and wrote the manuscript with support from PTD, who conceived of the project and edited the manuscript. JCP provided long-term data and edited the manuscript. LAW helped with the wavelet analysis and edited the manuscript.
Financial support
This research was supported primarily through the National Science Foundation's McMurdo Long Term Ecological Research project (Grant 1637708). Data generated by the autonomous vehicle ENDURANCE was funded by the NASA Astrobiology Science and Technology for Exploring Planets (ASTEP) programme (#NNX07AM88G).