During the late nineteenth and early twentieth centuries, Canada was a small, resource-rich, rapidly industrializing nation that was deeply dependent on international markets.Footnote 1 Falling transport costs, increasing competition from industrial imports, and a growing U.S. trade partner with a devotion to protectionism, posed serious challenges to Canada’s industrial development and economic well-being.Footnote 2 John A. Macdonald’s Conservative Party campaigned in the 1878 national election on a platform that promised a new “National Policy” for Canada, which included support for European immigration into the western prairie provinces, subsidization of a trans-continental railway to be built entirely within Canadian territory, and the adoption of explicitly protectionist trade policy objectives. In his campaign speeches Macdonald argued that protectionist tariffs would shield domestic industries from international market pressures, while counteracting the effects of U.S. protectionism (McDiarmid Reference McDiarmid1946; Porritt Reference Porritt1908). The Conservatives won the election, and in their first budget, brought before Parliament in March 1879, a new tariff act was introduced which rewrote virtually every line in the Canadian tariff schedule. The National Policy raised overall average tariff rates by more than half between 1877 (the last full fiscal year before the policy) and 1880 (the first full fiscal year after the policy). Tariffs were increased again in 1887, and although average rates did fall during the 1890s and early 1900s, Canada entered WWI in 1914 with an average tariff that was still substantially above pre-National Policy levels. Protectionism remained an explicit objective for Canadian trade policy from 1879 until the signing of a free trade agreement with the United States in 1988 (Norrie, Owram, and Emery Reference Norrie, Douglas and Herbert Emery2008, pp. 213–14).
At an aggregate level, Canada’s trade policy response to the first era of globalization (1870–1913) has been well-documented. However, tariff rates averaged over all imports, broad sectors or entire industries, tell us little about the structure and selectivity of the response. More generally, the scarcity of annual, granular evidence on trade flows and duties paid for individual products, limits our ability to identify and analyze inter-and intra-industry variation in countries’ late nineteenth and early twentieth century policies. In this article we use newly digitized data on import values and duties paid for all articles recorded in the Canadian sessional papers’ trade and navigation tables for every year from 1870 to 1913. With this data we document changes in the structure of protection implemented by one of the most active small-open-economies trading on international industrial and raw material markets during the post-1870 era.
The data for the individual articles listed in the trade tables are aggregated up to commonly identified six-digit Harmonized Commodity Description and Coding System (HS6) products. These products are categorized as either manufactured products, which are grouped into 16 two-digit Standard Industrial Classification (SIC2) industries, or unmanufactured products, which include raw materials, unprocessed foodstuffs, and “exotics,” such as coffee, cocoa, spices, or diamonds.Footnote 3 Each import product is then linked to the domestic output and input goods enumerated in the digitized manuscripts of the 1871 Canadian Census of Industrial Establishments. Linking the trade data to Canadian production data allows us to identify establishment locations and industry characteristics for domestically produced import substitutes. With this information we derive product-specific measures of domestic political influence. The census data also allows us to distinguish between “finished” imports destined for final consumption, and “semi-finished” intermediate inputs imported by downstream domestic producers.
With all linked products consistently identified and categorized over the 1870–1913 period, we calculate average weighted tariff rates (AWT) and effective rates of protection (ERP) for each of the nearly 29,000 unique product-year observations included in the trade tables. The disaggregate nature of the data allows us to describe the evolution of a small-open-economy’s late nineteenth and early twentieth century response to globalization in a way that is much more complete and finely detailed than the broader perspectives that dominate most historical trade policy narratives. With particular focus on Canada’s initial adoption of protectionism in 1879, we identify substantial inter- and intra-industry variation in the application of protective tariffs.
Beyond the established fact that aggregate tariff levels rose following the introduction of the National Policy, we find that tariff increases also became highly selective, in the sense that they narrowly targeted particular product categories, industries, and goods. More specifically, the effective rate of protection on finished products, in excess of the protection provided to intermediate inputs, increased by considerably more than the overall average tariff rate. Manufactured products saw much larger increases in their rates of protection relative to unprocessed foodstuffs, raw materials, or exotics, and protection expanded along both the intensive and extensive margins, with coverage ratios and tariff rates on previously taxed products both rising sharply. The cross-product dispersion in tariff changes increased by nearly 17 percentage points in 1879, and inter-industry variation rose as some industries, such as Transport Equipment and Petroleum and Coal Products, experienced very pronounced increases in their tariffs, while others, including Leather and Tobacco, saw little or no change.Footnote 4
Motivated by “protection-for-sale” models of endogenous trade policy, we explore another aspect of the selectivity in the Canadian tariff schedule by estimating the impact that products’ import penetration ratios, trade elasticities, and the political influence of domestic producers, had on policy changes after 1870. With both flexible reduced-form, and theory-consistent empirical specifications, we show that the National Policy’s tariff revisions disproportionately raised rates on imports that had close domestic substitutes (higher trade elasticities) produced by large domestic industries (higher inverse import penetration ratios), but only if these domestic producers were politically influential. Our annual estimates of one of the protection-for-sale model’s key structural parameters reveal that the weight the Canadian government placed on political influence in their objective function, relative to social welfare considerations, peaks in 1880. Holding all else constant, our results suggest that a one standard deviation increase in the intensity of the average Canadian manufacturer’s political influence was associated with a 2.5 percentage point increase in their level of protection (out of an average 7.2 percentage point increase in manufacturers’ AWT in 1879). We can find no significant evidence that political influence differentially affected tariff revisions during the years before the National Policy or after 1894.
The Canadian response to U.S. protectionism and the globalization of international markets after 1870 was to adopt explicitly protectionist trade policy objectives. The key features of this policy shift include not only a substantial increase in the average level of protection, but also an increase in the selectivity embodied in the tariff schedule. The absence of uniformity in the Canadian policy response points to a complexity and sophistication in the adoption of protectionism that can only be documented with annual, finely disaggregated, product-specific trade data. The degree to which the adoption of protectionism varied across products suggests the need for a reinterpretation of the impact of the National Policy, and policy responses to globalization more generally, that focuses not on broad aggregates, but only on those products and producers who were narrowly targeted for protection.
HISTORICAL TRADE POLICY IN CANADA
Much has been written about Canada’s response to U.S. tariff increases and the powerful globalization forces at work after 1870. For many years, commentators viewed the adoption of protectionism under the National Policy as a potentially costly, but necessary policy choice. Tariff increases were thought to have provided domestic manufacturers with the opportunity to extract economic rents from consumers who faced higher prices, while simultaneously supporting import substitution, increases in the scale of domestic production, and investment incentives for producers who were struggling against rising imports and closing international (particularly U.S.) markets (McDiarmid Reference McDiarmid1946; Fowke Reference Fowke1952; Easterbrook and Aitken Reference Easterbrook and Aitken1956). Starting in the late 1960s, a revisionist literature appeared that downplayed the National Policy’s support for infant industries, focusing instead on the static welfare losses that are predicted in Ricardian trade environments (Dales Reference Dales1966; Easton, Gibson, and Reed Reference Easton, William and Clyde1988). According to this view, the National Policy tariffs reduced competitive pressures in the Canadian economy, which led to higher domestic prices and lower social welfare. Estimates of the size of the static, partial equilibrium deadweight loses (DWL) resulting from the move to protectionism in 1879 vary from approximately 4 percent of Canadian GDP, to 0.5 percent (Pomfret Reference Pomfret1993; Beaulieu and Cherniwchan Reference Beaulieu and Jevan2014; Alexander and Keay Reference Alexander and Ian2018).
Recently, a more theoretically-grounded literature on Canadian trade policy has developed a dynamic perspective, relying on insights from “new trade” models (Harris Reference Harris1984; Horstmann and Markusen Reference Horstmann and James1986; Melitz and Trefler Reference Melitz and Daniel2012) which allow for deviations from Ricardian trade theory’s perfect competition, market clearing, no externalities, and constant returns to scale assumptions (Inwood and Keay 2013; Harris, Keay, and Lewis Reference Harris, Ian and Frank2015). In these models, tariffs trigger dynamic productivity responses as internal scale economies are exploited and learning-by-doing accelerates. Tariff increases, therefore, are portrayed in a more favorable light because they are thought to improve productivity, and eventually, lower domestic prices.
All of this work on the move to protectionism in Canada is founded on empirical evidence that is, in some important respects, incomplete. The traditional, revisionist, and new trade literature is largely supported by anecdotal evidence, or broad industry and sector aggregates. Some of the most recent work uses more granular tariff measures from five- or ten-year intervals, slightly more disaggregated annual industry-level evidence, or detailed industry case studies (Inwood and Keay 2013; Harris, Keay, and Lewis Reference Harris, Ian and Frank2015). The combination of complete but highly aggregated evidence, with more granular but incomplete data, provides us with no detailed information about the structure, timing, or selectivity embodied in Canadian trade policy.
Eugene Beaulieu and Jevan Cherniwchan (Reference Beaulieu and Jevan2014) use product-specific information on Canadian import values and duties paid, collected for five-year intervals spanning the 1870–1910 period, to provide the first really comprehensive view of the structure of Canadian policy during this period. Because their disaggregated data reveal a much more complex policy transition than was apparent from any of the earlier evidence, our view of the National Policy and its impact on the Canadian economy has begun to shift. Beaulieu and Cherniwchan show that average Canadian tariff rates not only increased between 1875 and 1880, but there were also significant increases between 1880 and 1885, and between 1885 and 1890. They report that revenue generating tariffs on exotics were exceptionally high throughout this period. They also use disaggregate, modern import demand elasticity estimates to derive trade restrictiveness indexes (TRI), which reveal that Canadian trade policy targeted specific import products on the basis of their substitutability with domestic production, particularly during the late 1880s and early 1890s. Beaulieu and Cherniwchan (Reference Beaulieu and Jevan2014, p. 148) emphasize that their use of, “...customs data reported at the product level...allows us to account for detailed changes in the tariff schedule, (which reveal that) aggregated data understate the impact of changes in tariff structure.” In other words, product-specific trade data are required if we want to document the complexity and sophistication of the Canadian trade policy response to post-1870 globalization and U.S. protectionism.
The evidence presented in this article extends Beaulieu and Cherniwchan’s (Reference Beaulieu and Jevan2014) work in two important respects (Alexander and Keay Reference Keay2019). First, we fill in the gaps in their five-year intervals by providing annual product-specific information on Canadian import values and duties paid. The complete time series provides year-by-year information that allows us to pinpoint the effects of specific policy revisions, such as the introduction of the National Policy in March 1879. Second, we link the granular trade data to establishment-specific production, intermediate input, and location information drawn from the manuscripts of the 1871 Canadian Census of Industrial Establishments. The linked data not only allow us to calculate effective rates of protection and examine the extent to which tariff changes during this period differentially protected incumbent Canadian industries, products, and locations, but they also facilitate the estimation of flexible and theory-consistent empirical specifications, which shed light on the underlying political economy forces that shaped Canadian policy.Footnote 5
CHANGES IN THE STRUCTURE OF THE CANADIAN TARIFF SCHEDULE
For each fiscal year since the formation of the Canadian dominion in 1867, the minister responsible for international trade has produced detailed tables quantifying the movement of products in and out of the country. These trade and navigation tables for the Dominion of Canada are published annually in the parliamentary sessional papers, and during the late nineteenth and early twentieth centuries, they were remarkably extensive in the breadth and depth of their coverage. Finely detailed information by article, origin, destination, port of entry, and customs office is provided for warehousing, trans-shipment, shipping, exports, and imports. For each imported article, this information includes units of weight or volume, quantity, value of total imports, value of imports for home consumption, and all customs revenue collected. Over some periods these data are reported by source country, tariff class, or legislative act. We have digitized and assembled the fully disaggregated, annual import and export data from these tables for the years 1870–1913.
The level of detail in these tables can be daunting. For example, in the 1901 sessional papers, which cover the fiscal year ending 30 June 1900, the itemized import trade table fills 610 pages and lists 1,402 articles.Footnote 6 Often distinct products are included in the tables as multiple articles depending on size, type of packaging, or some other feature that does not alter the product’s fundamental character, such as “French wine imported by the bottle” and “French wine imported by the cask.” To further complicate matters, identical articles are regularly described in slightly different ways from one year to the next, such as “sawn marble block from the quarry” in 1883, and “sawn marble slabs” in 1884. As a result of this variation in article descriptions, we follow Beaulieu and Cherniwchan’s approach, matching every article listed in the tables to an HS6 product description. We then group the six-digit product codes into two-digit industries, based on descriptions provided in the Dominion Bureau of Statistics’ 1948 Standard Industrial Classification Manual. Manufactured products are grouped into one of 17 SIC2 industries, while unmanufactured products, including all raw materials, unprocessed foodstuffs, and exotics, are grouped into a single industry.Footnote 7
Average Weighted Tariffs
Dividing total customs revenue collected, by the value of imports for home consumption for each article in each year, provides us with 28,688 article-year tariff rates. Tariffs measured as average customs revenue per dollar of imports are equivalent to statutory tariffs if duties are applied on an ad valorem basis. However, if specific duties are applied as a fixed dollar amount per unit imported, average customs revenue can vary inversely with import prices. As a result, if specific tariffs were common and relative import price movements were significant, changes in our tariff rates could be capturing changes in both prices and policy decisions. The trade tables only provide article-specific information on statutory tariffs for the years 1883–1894, but during that period we find that specific tariffs were relatively rare. In 1883, for example, 855 articles are listed in the import tables, 234 entered free of duty, 93 (11 percent) were charged a specific tariff, 85 were charged both a specific and ad valorem tariff, and 443 (52 percent) paid only an ad valorem rate. We also feel confident that our AWT are capturing policy changes because Canadian prices were remarkably stable during our period of study. The average annual change in the GDP deflator (0.07 percent), consumer price index (0.05 percent), and an index of import unit values (0.07 percent) are all statistically indistinguishable from zero between 1870 and 1913 (Harris, Keay, and Lewis Reference Harris, Ian and Frank2015).
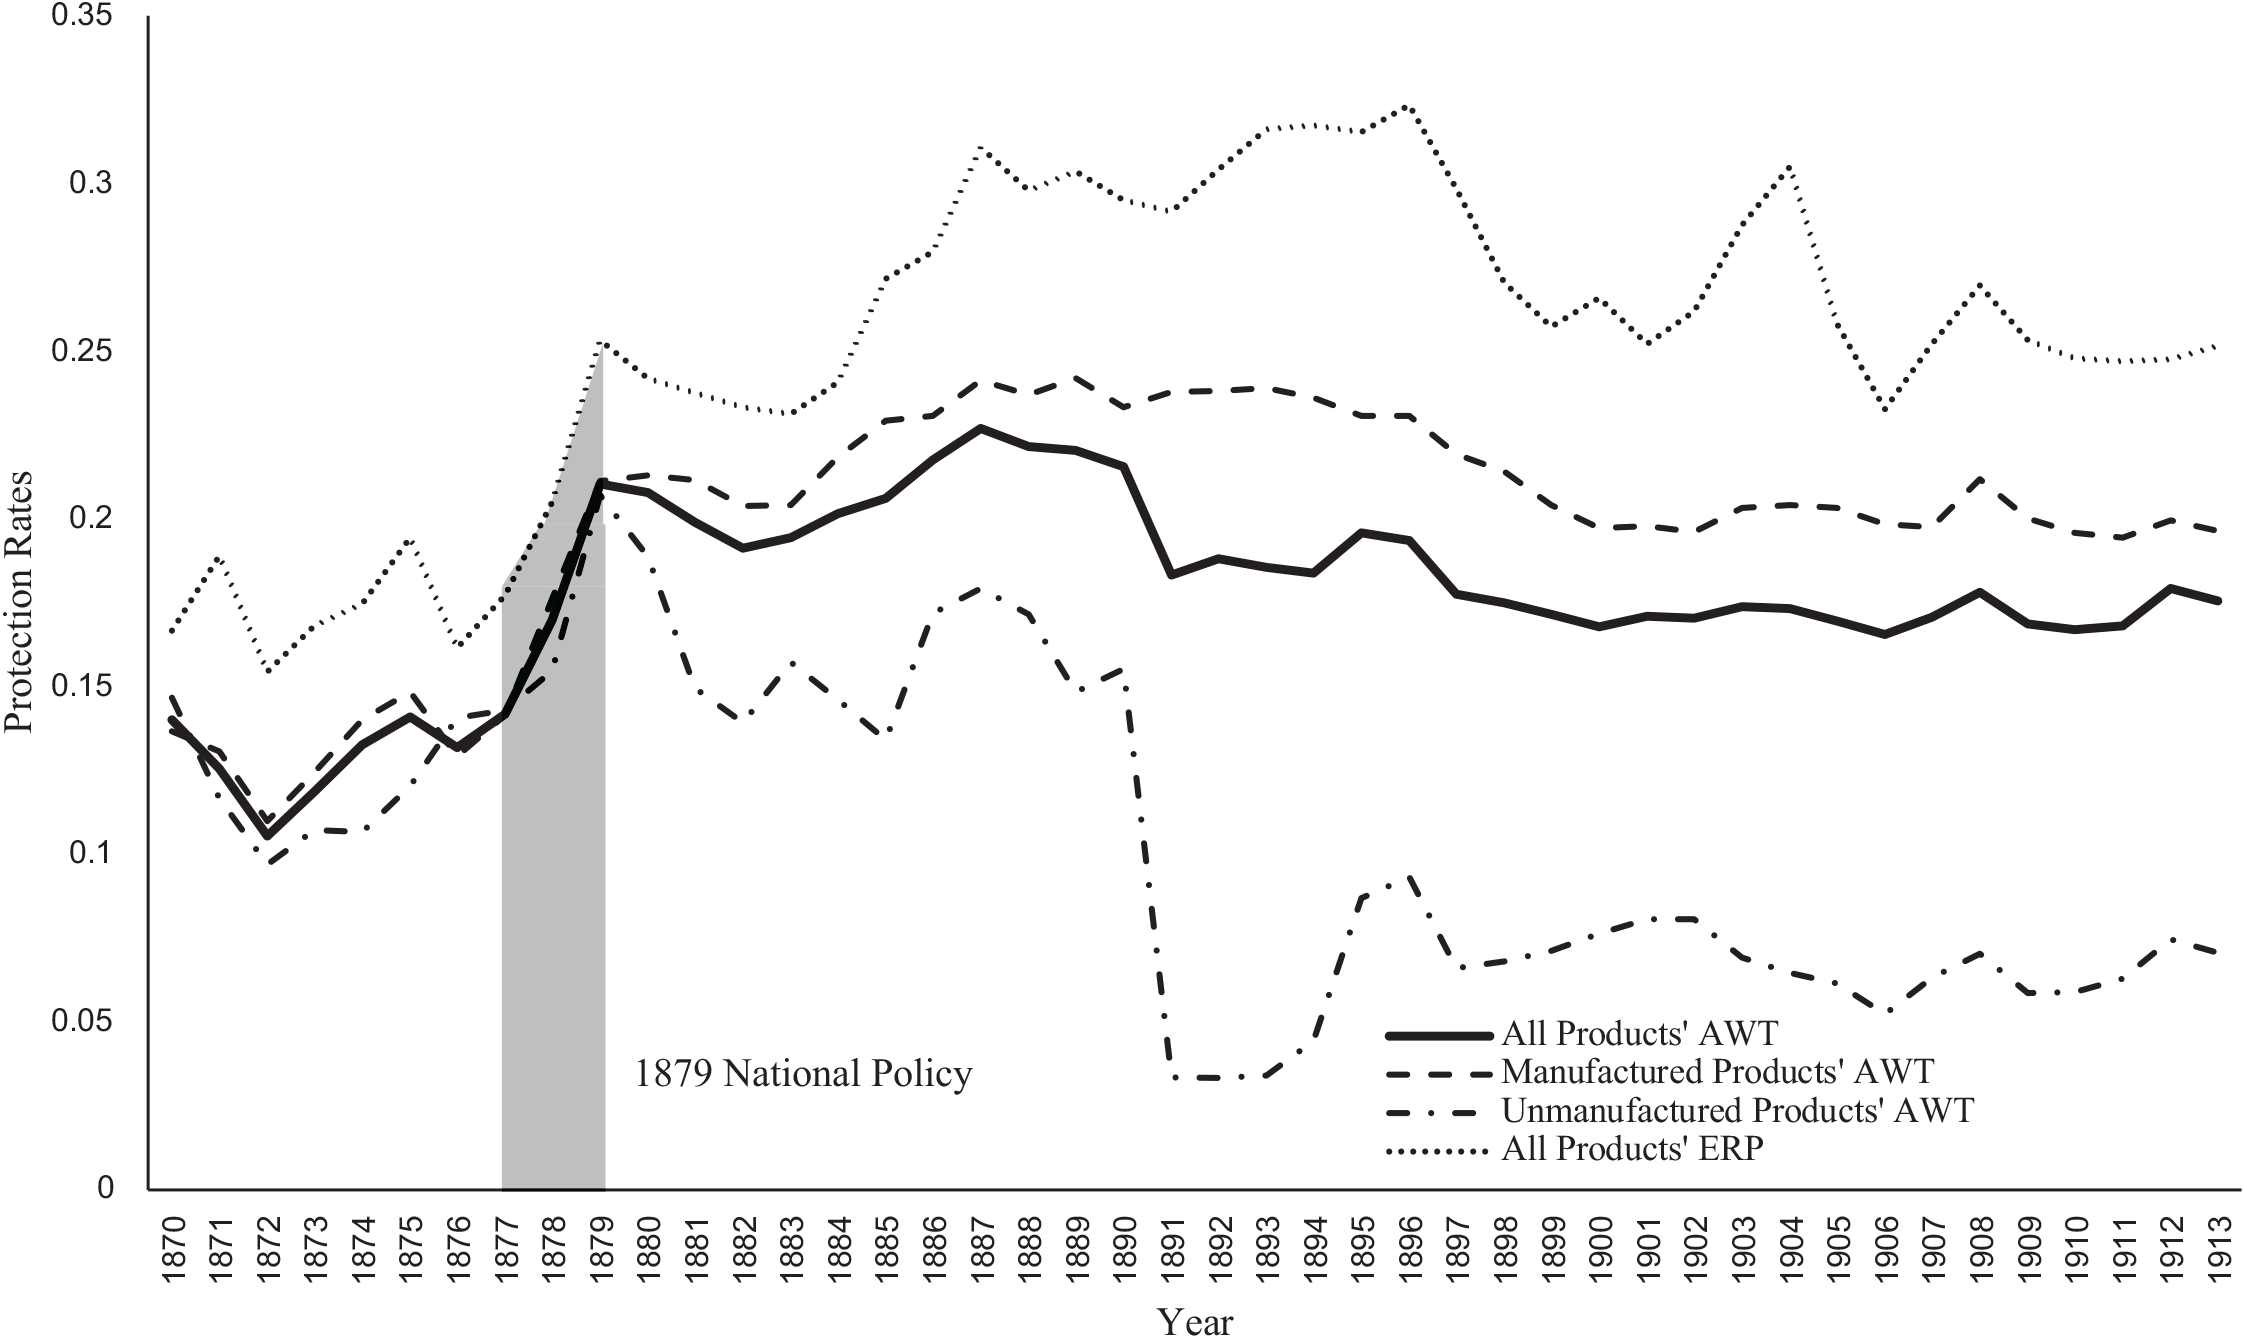
We aggregate article-specific tariffs up to common HS6 product and SIC2 industry rates using import value weights.Footnote 8 Figure 1 depicts average tariff rates for all import products, all manufactured imports, and all unmanufactured imports, for every year between 1870 and 1913 (as well as the effective rate of protection for all imports).
CANADIAN AVERAGE WEIGHTED TARIFF RATES AND EFFECTIVE RATES OF PROTECTION

Although there were continuous updates and tweaks to the Canadian tariff schedule in every year, there were only six major revisions of the full schedule during the first era of globalization (Beaulieu and Cherniwchan Reference Beaulieu and Jevan2014; Gillespie Reference Gillespie1991; McDiarmid Reference McDiarmid1946). All six of these changes can be seen in the AWT series included in Figure 1. The first of these revisions was the Mackenzie tariff of 1874. Prime Minister Alexander Mackenzie’s stated objective for this policy was increased revenue generation, and although we find small increases in tariff rates across a wide range of products, there is little evidence of differential tariff adjustments across products or industries. The tariff act introduced by Charles Tupper in 1887 brought in larger and more differentiated tariff increases, which can be seen in Figure 1 as an increase in the differential between manufactured and unmanufactured products’ AWT. We also note that there was a very steep drop in unmanufactured imports’ tariff rates in 1890. This change was not associated with a broad revision of the tariff schedule, but rather the (re-)introduction of an imperial preference for a single product—raw sugar imported from British colonies. There was a modest, but still fairly narrowly targeted downward adjustment in average tariff rates following the schedule revision in 1894 (Keay Reference Alexander and Ian2018), and as a result of a more wide-spread move towards preferential access for British products, the Fielding tariff in 1897 and the tariff act of 1907 again lowered overall average rates. On the eve of WWI, the Canadian AWT for all import products was nearly 4 percentage points higher than it had been in 1870, with unmanufactured products’ AWT falling over the period from 15 percent in 1870 to 7 percent in 1913, and manufactured products’ AWT rising from 14 percent to 20 percent.
The contrast between the tariff changes introduced under the National Policy and the revisions that came before and after 1879 is stark.Footnote 9 John A. Macdonald’s Conservative Government established a budget subcommittee shortly after winning the 1878 federal election to hear petitions from stake-holders seeking protection from foreign competition. Government supporters proclaimed the change in the tariff schedule that resulted from this process to be a bold move away from the country’s traditional revenue objectives, towards explicitly protectionist goals. Most of the literature on Canadian historical trade policy considers the 7 percentage point increase in the overall average tariff rate that spans the 1878 and 1879 fiscal years to be the defining feature of this move to protectionism. However, as Beaulieu and Cherniwchan (Reference Beaulieu and Jevan2014, p. 158) point out, the increase in the overall average tariff rate does not necessarily reflect the extent to which the policy marked a break from revenue generation, in favor of trade protection. Moving from aggregate averages to granular, annual evidence allows us to document changes in the structure of the Canadian tariff schedule across industries, products, and product-types. We find that the overall average change in the AWT in 1879 was, in fact, far from uniform, and it is the lack of uniformity that reveals a much more complete picture of Canadian policy during this era.
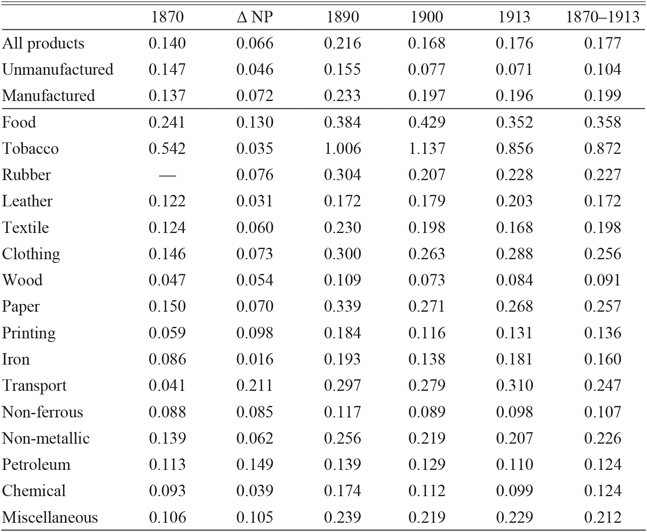
The industry, sector, and overall AWTs reported in Table 1 (and depicted in Figure 1) provide a first glimpse of the selectivity embodied in Canada’s adoption of protectionism. It is clear that the move to higher tariffs after 1879 was not uniform across industries or product-types. Tariffs on unmanufactured goods, many of which were intermediate inputs used by downstream producers, increased by just 4.6 percentage points under the National Policy.Footnote 10 Average rates on manufactured products, on the other hand, rose sharply during the 1878 and 1879 fiscal years, such that the differential between manufactured and unmanufactured products’ AWT increased by 2.6 percentage points in 1879. Within the manufacturing sector, tariff changes varied widely across industries, particularly in 1879. Iron and steel, tobacco products, leather products, and chemicals, for example, saw relatively small increases in their tariff rates under the National Policy, while the average tariff imposed on products produced by printing and publishing, petroleum and coal products, and transport equipment more than doubled.Footnote 11
AVERAGE WEIGHTED TARIFFS

Note: National Policy spans 1878 and 1879 fiscal years; Δ NP = 1880–1877. Unmanufactured products include raw materials, unprocessed foodstuffs, and exotics. 1870–1913 = unweighted annual average. Electrical Apparatus dropped due to a lack of observations. Average weighted tariff = customs revenue / value imports for home consumption.
Source: Dominion of Canada, Sessional Papers, Trade and Navigation Tables.
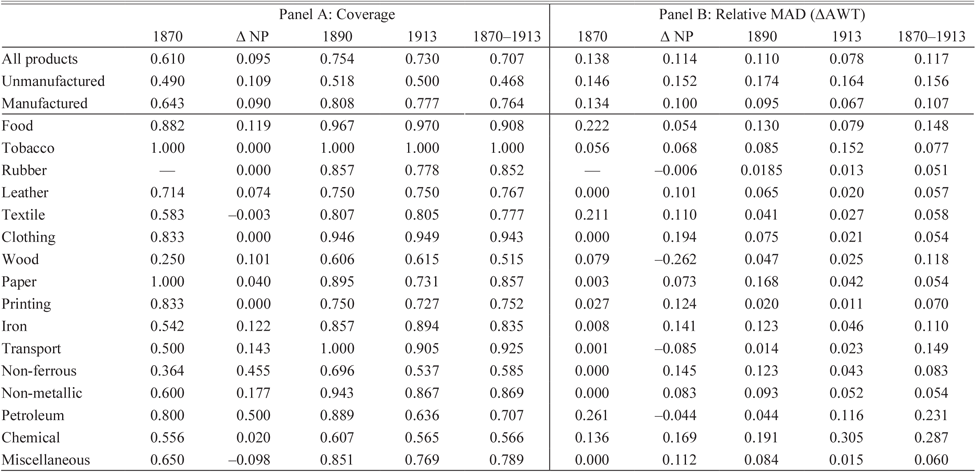
In addition to inter-industry variation, our product-specific trade data allow us to document intra-industry patterns. In Table 2 we report tariff coverage ratios (Panel A) and the relative mean absolute deviation (MAD) in tariff changes (Panel B) for all import products, unmanufactured products, and manufactured products grouped by SIC2 industry. These figures reveal changes in the structure of the tariff schedule along two additional dimensions. Measured as the share of products that were required to pay a duty upon entry, tariff coverage captures the schedule’s extensive margin. The mean relative absolute deviation in tariff changes is a measure of the dispersion in tariff adjustments across products. We calculate the relative MAD as the average difference between product-specific tariff changes and the overall average change, scaled by the average tariff level.
TARIFF COVERAGE AND DISPERSION ACROSS PRODUCTS

Notes: See notes from Table 1. Coverage = # products with AWT > 0 ÷ total # products.  ${Relative MAD} = \frac{{\sum _i \left| {\Delta AWT_i - \overline{\Delta AWT}} \right|}}{{N \times \overline {\Delta AWT} }}$, where
 $\overline {\Delta AWT} $ is the average change in AWT over all products i, and
 $\overline {AWT} $ is the average AWT level over all products i.
Source: Authors’ calculations.
Over all products, protection along the extensive margin increased from 66 percent to more than 75.4 percent under the National Policy. However, we can again see that this expansion in the share of products required to pay a duty upon entry was not uniform. Some manufacturing industries, including miscellaneous products, clothing, and textiles, saw no change or even small reductions in coverage in 1879, while other industries, such as iron and steel, transport equipment, and non-ferrous metals, saw substantial growth in the share of their import products subject to a duty.Footnote 12 We can compare the impact that the increase in coverage had on manufactured products’ overall average tariff rates in 1879, to the impact of changes in the AWT on products that were already being protected prior to 1879 (the intensive margin). Because previously protected manufactured products’ AWT rose by 6.3 percentage points in 1879, we find that the National Policy substantially restructured the Canadian tariff schedule along both margins. A simple back-of-the-envelope calculation reveals that approximately one-third of the total increase in manufactured products’ tariffs can be attributed to the application of new tariffs, while the remaining two-thirds was the result of the increase in rates on products that were already paying some duty before the National Policy was introduced.Footnote 13
The relative MAD of the change in tariff rates measures the dispersion in product-specific policy adjustments, relative to average tariff levels.Footnote 14 An increase in the dispersion in tariff changes reflects a move towards greater selectivity in the way the Canadian government was structuring the schedule, while a uniform, across-the-board tariff increase would be associated with a relative MAD of zero. For all manufactured imports, the dispersion in policy adjustments under the National Policy was sharply higher than either the pre- or post-policy periods. The relative MAD rises from an average of 0.130 between 1870 and 1877 (not shown in Table 2: Panel B), to 0.265 in 1879, before dropping back to an average of just 0.079 from 1880 to 1889. The clothing, chemical, and non-ferrous metal industries all saw particularly large increases in dispersion, while the relative MAD in petroleum and coal products, wood, and transport equipment’s AWT adjustments actually fell slightly in 1879. Across all manufactured products, the relative MAD increased by just over 10 percentage points under the National Policy, which is more than double the increase in dispersion measured for any of the other five major revisions of the Canadian tariff schedule during our period of study. The coverage ratios and dispersion figures reported in Table 2 reveal that the National Policy was not simply a uniform increase in pre-existing tariff rates. New products were being protected, existing tariff rates were being adjusted, and these changes were widely dispersed across products, both within and between industries.
Effective Rates of Protection
Another feature of the National Policy becomes apparent when we look more carefully at differential tariff changes across import goods destined for final consumption, relative to goods used as intermediate inputs by downstream producers. Annual product-specific effective rates of protection reveal the extent to which the National Policy’s selective tariff increases were not just generally targeting all manufactured products, or all products within specific manufacturing industries, but these changes were carefully distinguishing between “semi-finished” intermediate inputs and “finished” output products (Easterbrook and Aitken Reference Easterbrook and Aitken1956, p. 392; Marr and Paterson Reference Marr and Donald1980, p. 380).
In his classic 1966 article, Warner Corden describes how the protection provided by a change in the structure of a country’s tariff schedule varies depending on how the tariff changes affect imported substitutes for domestic final consumption goods relative to imported intermediate inputs. Corden’s (Reference Corden1966, p. 222) original ERP specification requires information on producers’ intermediate input cost shares and product-specific tariff rates for both output products and intermediate inputs.
 $$ERP_j = \frac{{\tau _j^{out} - S_j^{in} \tau _j^{in} }}{{1 - S_j^{in} }}$$
Time subscripts are suppressed, j represents SIC2 industries, τ out is equal to the AWT for products destined for final consumption, identified at the HS6 level of aggregation, τ in is equal to the AWT for intermediate inputs, identified at the HS4 level of aggregation, and sin is the intermediate input cost share.Footnote 15 The main empirical complication we face in the calculation of Corden’s ERP measure, is the need to determine which products included in the import trade tables were used as intermediate inputs by Canadian industrial establishments, and which products were finished goods destined for final consumption.
We do not have annual product-specific information on the intermediate inputs used by Canadian manufacturers during our period of study. However, we do have complete count micro-data from the manuscripts of the 1871 Canadian Census of Industrial Establishments. Enumerators for this census were asked to note the primary intermediate inputs used by every industrial establishment operating in Canada, as well as the units of weight or volume, quantities, and the value of these inputs. More than 43,000 establishments were enumerated and 2,178 unique intermediate inputs were recorded in 5,397 unique combinations. Because of the limited detail provided by enumerators, we are only able to match the reported inputs at the four-digit product-level.Footnote 16 For each manufacturing industry, we use the HS4 input products that were enumerated in at least 20 percent of its establishments in the 1871 census to identify industry-specific intermediate inputs, which allows us to calculate  $\\tau _j^{in}$ for each year from 1870 to 1913.Footnote 17
The main concern with this approach is the possibility that changes in location, technology, industrial structure, import intensity, or even consumer demand could result in changes in the inputs used by each industry during the years after 1871. This problem is unlikely to be severe in our context because the inputs are identified at the slightly more aggregate four-digit level, and as a result, we feel confident that the inputs we identify for each industry were consistently employed over our period of study.Footnote 18
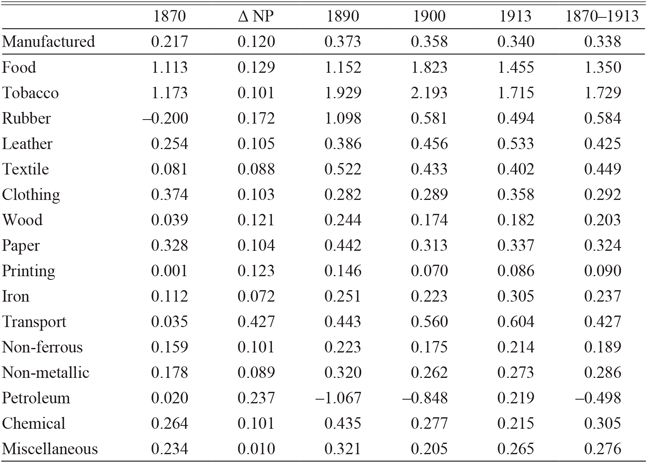
The ERP reported in Table 3 (and Figure 1) reveal yet another aspect of the selectivity of the Canadian tariff schedule following the introduction of the National Policy. Tariffs imposed on imported intermediate inputs used by Canadian manufacturers increased from 6.3 percent to 10.7 percent in 1879, but this increase is much smaller than the increase in manufactured finished goods’ tariff rates, which rose from 14 percent to nearly 22 percent. The effective rate of protection for Canadian manufacturers increased by 12 percentage points in 1879, from 24.5 percent to 36.5 percent, and the aggregate ERP stayed consistently high through the rest of our period of study, averaging more than 35 percent during the 1880s, 1890s, and early 1900s.

In Figure 1 we can see that net tariff protection increased even more sharply than gross protection, not just in 1879, but over the full post-1870 period. The granular linked data allow us to be even more specific about inter-industry differences in the targeting of finished products. In particular, not all industries had highly correlated AWT and ERP patterns. Miscellaneous products, for example, enjoyed an AWT increase on their output products of more than 10 percentage points in 1879, but this was matched almost exactly by an increase in the tariffs on their intermediate inputs, such that their effective rate of protection rose by less than 1 percentage point. Rubber and leather products, on the other hand, saw their ERP rise substantially more than the AWT on their finished goods alone, with the differential between effective and gross protection increasing by more than 7 percentage points for both industries in 1879. More generally, transport equipment, food and beverages, and petroleum and coal products all enjoyed the most substantial increases in effective protection, while miscellaneous products, iron and steel, and non-metallic mineral products experienced much smaller increases.
The ERP illustrate that for most, but not all industries’, imported finished products that were destined for final consumption were strongly differentially protected relative to semi-finished intermediate inputs. This evidence again illustrates the extent to which protection under the National Policy was not uniformly applied, even within the most highly protected industries or sectors. The absence of uniformity along so many dimensions naturally leads us to ask why some industries and products were selected for high levels of protection, while others were not? What role did political influence, domestic competition, or the presence of domestic substitutes play? Was trade protection “for sale” in Canada in the late nineteenth and early twentieth centuries, and what might this tell us about the objectives of Canadian policy makers?
THE EFFECT OF POLITICAL INFLUENCE ON THE TARIFF SCHEDULE
The traditional narratives surrounding the National Policy are unequivocal about the impact that manufacturing interests’ political influence had in shifting government objectives towards protectionism. Samuel D. Clark (Reference Clark1939, pp. 6–7), for example, writes, “...at a meeting in Toronto, the members of each manufacturing industry retired to a separate room and drafted a tariff covering their own articles. A similar scheme was adopted at a meeting of manufacturers in Montreal. The two groups then met in Ottawa and agreed upon a tariff which was submitted...to Sir Leonard Tilley (Macdonald’s Minister of Finance) with the advice that it be adopted as it stood....” Orville McDiarmid (Reference McDiarmid1946, pp. 160–61) claims that, “...in the closing months of the (1878 federal election) campaign, in response to Macdonald’s invitation, manufacturers from all parts of the country participated in drafting the first National Policy tariff schedule....” Edward Porritt (Reference Porritt1908, p. 317) describes the government response to the pressure applied by manufacturers, quoting a speech given by John A. Macdonald to a group of industrialists in Hamilton, Ontario, in which he declared, “...let each manufacturer tell us what he wants and we will give him what he needs.” Implicit in the historiography is the view that self-interested producers would not have been eager to help the federal government revise the tariff schedule if they expected that the resulting policy change would be primarily directed toward revenue generation. Evidence that political influence played a role in the restructuring of the tariff schedule in 1879 can help to explain the inter- and intra-industry patterns we observe, and it provides insight into the political economy pressures the government faced when formulating its response to globalization and U.S. protectionism.
Empirical Specifications
To explore the extent to which political influence had an impact on Canadian trade policy, we employ both a theory-consistent specification, and a more descriptive, but flexible reduced-form specification. The theory-consistent specification is based on Gene Grossman and Elhanan Helpman’s (Reference Grossman1994) “protection-for-sale” model, which depicts an environment in which government decision-makers trade-off competing policy goals related to social welfare on one hand, against industries’ political influence on the other, when setting tariff rates. More specifically, in a neoclassical economic environment, higher tariffs are associated with higher prices, lower quantities exchanged, and static, partial-equilibrium dead-weight loss. DWL is borne by domestic consumers, who are also potential voters, and it rises with higher trade elasticities and greater import penetration. However, in addition to their concerns about DWL, governments also respond to pressure applied by domestic producers who enjoy increases in prices and domestic market power in the presence of higher tariffs.
The central insight in the Grossman–Helpman model is that domestic producers’ market power considerations are more likely to dominate consumers’ DWL considerations in the government’s objective function if import-competing products are produced by politically influential domestic industries. As this suggests, trade elasticities and domestic production levels can have differential effects on tariff changes, conditional on domestic producers’ ability to exert political pressure. The most influential producers will seek higher tariffs when protection is more valuable to them, and the value of protection rises with the relative size of domestic producers (inverse import penetration ratios) and the degree of substitutability between domestic production and imports (trade elasticities).Footnote 19
Pinelopi Goldberg and Giovanni Maggi (Reference Goldberg1999, p. 1139) use the insights from the protection-for-sale framework to derive an empirically tractable, theory-consistent estimating equation that allows for an assessment of the role played by political influence in the targeting of protectionist tariffs.Footnote 20 In their primary specification, which they use to explain cross-section differences in American non-tariff barriers in 1983, their left-hand-side dependent variable is the elasticity-weighted level of protection in a particular year, and they allow the impact of (inverse) import penetration to differ on the basis of domestic producers’ political influence.
 $${{{\tau _i} \times {\varepsilon _i}} \over {{\rm{l + }}{\tau _i}}} = {\gamma _0} + \gamma {_1}\tilde m_i^{ - 1} + {\gamma _2}(Influenc{e_j} \times \tilde m_i^{ - 1}) + {\nu _i}$$
Time subscripts are suppressed in Equation (2), i represents products that are produced (or potentially produced) by domestic industry j, ε is the trade elasticity (measured in absolute value), which captures the degree of substitutability between domestic and foreign products, and m̃–1 is the inverse import penetration ratio, which is simply the gross value of domestic production divided by the value of imports. Influence is the key variable in this expression. If industry j is deemed to be politically influential, then this categorical variable takes the value 1.Footnote 21 If industry j does not have the capacity to meaningfully affect tariff policy, then this variable is set equal to 0. Although much information about the strength of industries’ political engagement is lost, this dummy variable approach to measuring influence does allow for a clean categorization of products and industries as either “influential” or “uninfluential,” and variation in the threshold allows for informative sensitivity testing.
Goldberg and Maggi (Reference Goldberg1999, pp. 1146–47), and Kishore Gawande and Usree Bandyopadhyay (Reference Gawande and Usree2000, p. 146) show that within the context of their econometric specifications, the theoretical predictions from Grossman and Helpman’s model imply that γ 1 should be negative, and γ 2 and (γ 1 + γ 2) should both be positive.Footnote 22 This implies that, for politically influential import-competing producers, higher levels of domestic production relative to the value of imports (higher inverse import penetration) should be associated with higher elasticity-weighted levels of protection. The key structural parameter from the protection-for-sale model is the weight government assigns to political influence, as opposed to social welfare, in its objective function. This parameter, ω = γ 2/(1 + γ 1 + γ 2) ∈ (0, 1), can be recovered from Equation (2). If the government attaches no importance whatsoever to domestic producers’ political influence when setting tariff rates, then ω = 0, and consequently, the weight associated with social welfare in its objective function will be (1 − ω) = 1.Footnote 23
Because Goldberg and Maggi’s estimating equation is both simple and tractable, and because it has a well-defined structural interpretation, we use a slightly adapted version of Equation (2) (with SIC2 industry fixed effects added) as our primary, theory-consistent specification.Footnote 24 However, before presenting results from our estimation of Equation (2), we provide some motivation and context for these estimates by employing a more descriptive, reduced form specification. This considerably more flexible estimating equation links the inter- and intra-industry patterns we see in product-specific tariffs, to a measure of the intensity of Canadian producers’ political influence during our period of study. In this reduced form specification we use changes in individual products’ AWTs as the dependent variable, rather than the level of elasticity-weighted protection in any specific year, and we interact both of the key protection-for-sale determinants, inverse import penetration and inverse trade elasticities, with our indicators of political influence. Unlike the theory-consistent specification, we also include the intensity of political influence as a separate, additive explanatory variable.
 $$\eqalign{ {\tau _i} = {\alpha _0} + {\alpha _1} & \varepsilon _i^{ - 1} + {\alpha _2}(Influenc{e_i} \times \varepsilon _i^{ - 1}) + {\alpha _3} & \tilde m_i^{ - 1} + {\alpha _4}(Influenc{e_i} \times \tilde m_i^{ - 1}) \\ + {\alpha _5}Influenc{e_i} + {\theta _{jk}} + {\nu _i}}$$
Time subscripts are suppressed, Δτ = τ t − τ t−m, and θ jk are SIC2 industry (and in some specifications province k) fixed effects. We estimate Equations (2) and (3) by ordinary least squares (OLS) with robust standard errors clustered by SIC2 industry (and in some specifications province).Footnote 25 The observations over which both Equations (2) and (3) are estimated include the 204 import products listed in the 1871 trade tables (identified at the HS4 level of aggregation). We use only those products listed in the 1871 tables because our import penetration ratios and political influence variables are derived from the complete count micro-data recorded in the manuscripts of the 1871 Canadian industrial census. The variables derived from the 1871 census reflect “initial conditions” which pre-date the move to protection under the National Policy by eight years, thereby easing potential simultaneity concerns.Footnote 26
Following Patrick Alexander and Ian Keay (Reference Alexander and Ian2018) and Beaulieu and Cherniwchan (Reference Beaulieu and Jevan2014), we use Hiau Looi Kee, Alessandro Nicita, and Marcelo Olarreaga’s (Reference Kee, Alessandro and Marcelo2008) disaggregate, but modern import demand elasticities to measure product-specific trade elasticity (ε i). Because we do not have annual information on domestic production at the HS6 product-level, we measure product-specific import penetration (m̃ i) by dividing annual import values for the products listed in the 1871 Trade and Navigation Tables, by gross output values enumerated in the digitized manuscripts of the 1871 Canadian Census of Industrial Establishments. We also do not have annual, product-level data for the indicators of political influence, organization, or political contributions that are typically used in studies of the determinants of more recent trade policies.Footnote 27 This leads us to again turn to the digitized manuscripts of the 1871 census to measure domestic producers’ capacity for political influence during the post-1870 period. Specifically, we measure the intensity of Canadian producers’ capacity to affect the restructuring of the tariff schedule in 1879 (Influence), as a simple unweighted average of five industry characteristics, three location characteristics, and one political representation indicator, all calculated at the product-level relative to the “most influential” product.Footnote 28 This approach allows us to cast our net as broadly as possible in an effort to capture determinants of political influence that may be important across a wide range of industries, locations and products, and it imposes no discretionary assessment of the relative importance of any one determinant over the others.
The industry characteristics in our measure of the intensity of Canadian producers’ political influence include industry size, concentration, and profitability. In particular, Influence includes the number of domestic establishments enumerated in the industrial census that produced each product listed in the 1871 trade tables, the total value added generated by these establishments, the share of output produced by the largest 1 percent of these establishments, and the income available to the establishments’ owners (value added less wages and salaries as a share of total revenue). We also include an additional industry variable that captures the potentially offsetting political influence of downstream intermediate input users. Namely, the number of workers employed in the domestic production of each import-competing product, relative to the number of workers employed in downstream industries that use these products as an intermediate input.
Our location characteristics capture voter density in the districts that are home to import-competing production. Specifically, our political influence variable includes the total population of the census districts in which at least 20 percent of domestic production for each product was generated. The importance of the products’ local production in these districts is measured as district-specific production as a share of total domestic production, and voter proximity is measured with an indicator for urban production, which takes the value 1 when population density is greater than 10 per acre in those districts housing at least 20 percent of domestic production.
Political representation is captured in Influence with a dummy variable that is set equal to 1 for import-competing products produced by establishments concentrated in Toronto or Montreal that had a representative on the executive committee of either the Ontario Manufacturers’ Association (OMA), or the Manufacturers’ Association of Montreal (MAM).Footnote 29
When our measure of the intensity of domestic import-competing producers’ political influence is compared across products and industries, we find, perhaps not terribly surprisingly, that the most influential producers in Canada during the first era of globalization appear to have been those with a large, highly concentrated, urban presence. Establishments producing cigars and cigarettes, locomotive shops, and blast furnaces, for example, were predominantly large, capital intensive factories located in and around Toronto and Montreal, and their values for Influence are particularly high.Footnote 30 Interestingly, some of the producers with the lowest (non-zero) values for Influence, such as printing shops, tailors and seamstresses, and potters and brick-makers, are also typically associated with urban production in Canada during this period. However, these relatively uninfluential industries were still overwhelmingly small, seasonal, handicraft shops in 1871 (Inwood and Keay Reference Inwood and Ian2012). Summary statistics for all of the variables used in Equations (2) and (3) are provided by SIC2 industry in the Online Appendix, Table A2.
Estimation Results
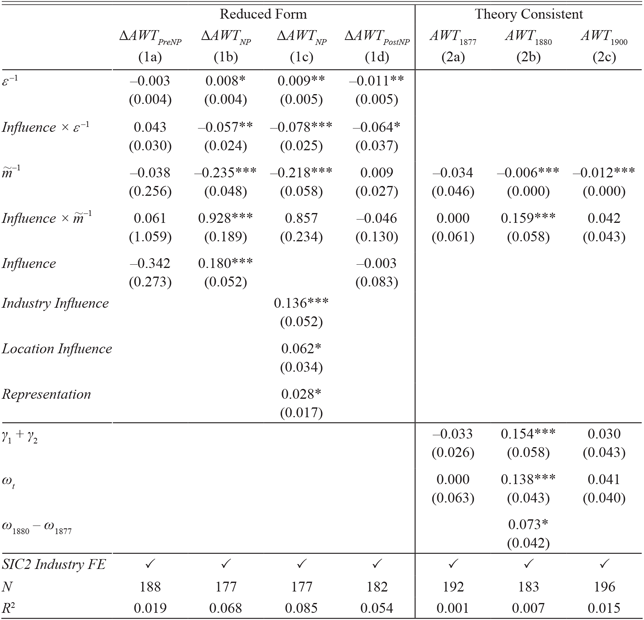
In the first four Columns (1a–1d) in Table 4 we report the parameter estimates (and robust standard errors, clustered by SIC2 industry) from our descriptive, reduced form Equation (3). In Column (1a) we see that during the eight years (1870–1877) prior to the adoption of protectionist policy objectives under the National Policy, there is no evidence of any significant correlation linking the change in Canadian product-specific tariffs to product-specific import demand elasticities, import penetration ratios, or political influence. In Column (1d) we see that during the period after the introduction of the National Policy (1880–1913), products with relatively high import demand elasticities did have larger changes in their AWT, and political influence seems to augment this effect. However, in terms of its relationship with import penetration, or evidence of a direct impact on tariff changes, political influence is just as inconsequential after 1880 as it was before 1878.
THE IMPACT OF POLITICAL INFLUENCE ON TARIFF STRUCTURE

* = Significant at the 90 percent confidence level.
** = Significant at the 95 percent confidence level.
*** = Significant at the 99 percent confidence level.
Notes: See text for definitions and specifications. Dependent Variables: Column (1a) = (τ 1877 – τ 1870); Columns (1b) and (1c) = (τ 1880 – τ 1877); Column (1d) = = (τ 1913 – τ 1880); Columns (2a), (2b), and (2c) = (τ t × ε)/(1 + τ t). ε = Kee, Nicita, and Olarreaga (Reference Kee, Alessandro and Marcelo2008) modern, but disaggregate trade elasticities; m̃ import penetration ratio; Influence ∈ (0,1) determinants measured relative to product with maximum potential influence (see text and Online Appendix for details). Robust standard errors clustered by industry reported in parentheses (unless otherwise noted). Industry fixed effects defined at SIC2 level (Food and Beverages omitted). Columns (2a)–(2c) report H 0: γ 1 + γ 2 = 0, where γ 1 and γ 2 are parameters associated with m̃ –1 and (Influence × m̃–1), respectively, and H 0: ω = 0. Column (2b) reports H 0: ω 1880 – ω 1877 = 0.
Source: Authors’ calculations.
In contrast, the correlations linking import-competing producers’ political influence to tariff changes introduced under the National Policy are much larger and strongly statistically significant. The parameter estimates on Influence interacted with import penetration and trade elasticity in Column (1b) indicate that the National Policy’s tariff changes were targeting imports with relatively close domestic substitutes (higher import demand elasticities) and high levels of import-competing domestic production (higher inverse import penetration ratios), but only if those products were strongly politically influential. For products with weaker political influence, this targeting was muted or, at very low levels of influence, reversed. Even after controlling for the differential impact of trade elasticity and import penetration on politically influential products, the direct effect of a one standard deviation increase in Influence is an additional 2.5 percentage point increase in a product’s tariff rate between 1877 and 1880, out of an average 7.2 percentage point increase over all products.Footnote 31 In Column (1c) we show that the impact of political influence on the restructuring of the Canadian tariff schedule in 1879 is not dependent on any single sub-set of the indicators that we include in our measure of influence. When we disaggregate Influence into separate indicators for industry characteristics, location characteristics, and political representation, all three measures are positive and statistically distinguishable from zero in Equation (3).Footnote 32
These reduced form estimates reveal that political influence was related to the structure of Canada’s tariff schedule, but they have no theoretical, or structural interpretation. In Table 4 we report the estimated parameters (and robust standard errors, clustered by SIC2 industry) from our theory-consistent protection-for-sale Equation (2), with elasticity-weighted tariff levels in 1877, 1880, and 1900 as the left-hand-side variables in Columns (2a), (2b), and (2c), respectively. Political influence in Equation (2) is measured as a simple categorical variable that takes the value one for those products with the intensity of their political influence, as measured by our industry, location, and representation indicators, in the top quartile of all products. This specification also allows us to recover the key structural parameter from Grossman and Helpman’s protection-for-sale model (ω).
In Column (2a) we see that in the last full fiscal year before the introduction of the National Policy (1877), higher product-specific inverse import penetration ratios are weakly associated with lower elasticity-weighted tariff levels, and there is no significant differential effect for politically influential import-competing producers. The estimates suggest that in 1877 the weight the Canadian government placed on political influence in their tariff setting agenda was statistically indistinguishable from zero, which implies that social welfare was the only factor considered by the government.Footnote 33 In 1900 (Column 2c), 20 years after John A. Macdonald first made protection the primary goal of Canadian trade policy, but only four years after Wilfrid Laurier’s Liberal Government reintroduced preferential access for British imports, thereby taking a significant step back from the National Policy’s high, narrowly targeted protectionist tariffs, we find that higher inverse import penetration ratios are more strongly associated with lower elasticity-weighted tariffs, but political influence in 1900 again has no differential effect on this relationship. Although the weight government places on political influence in 1900 is higher than it had been immediately prior to the introduction of the National Policy, it is still relatively low (0.041) and statistically insignificant.
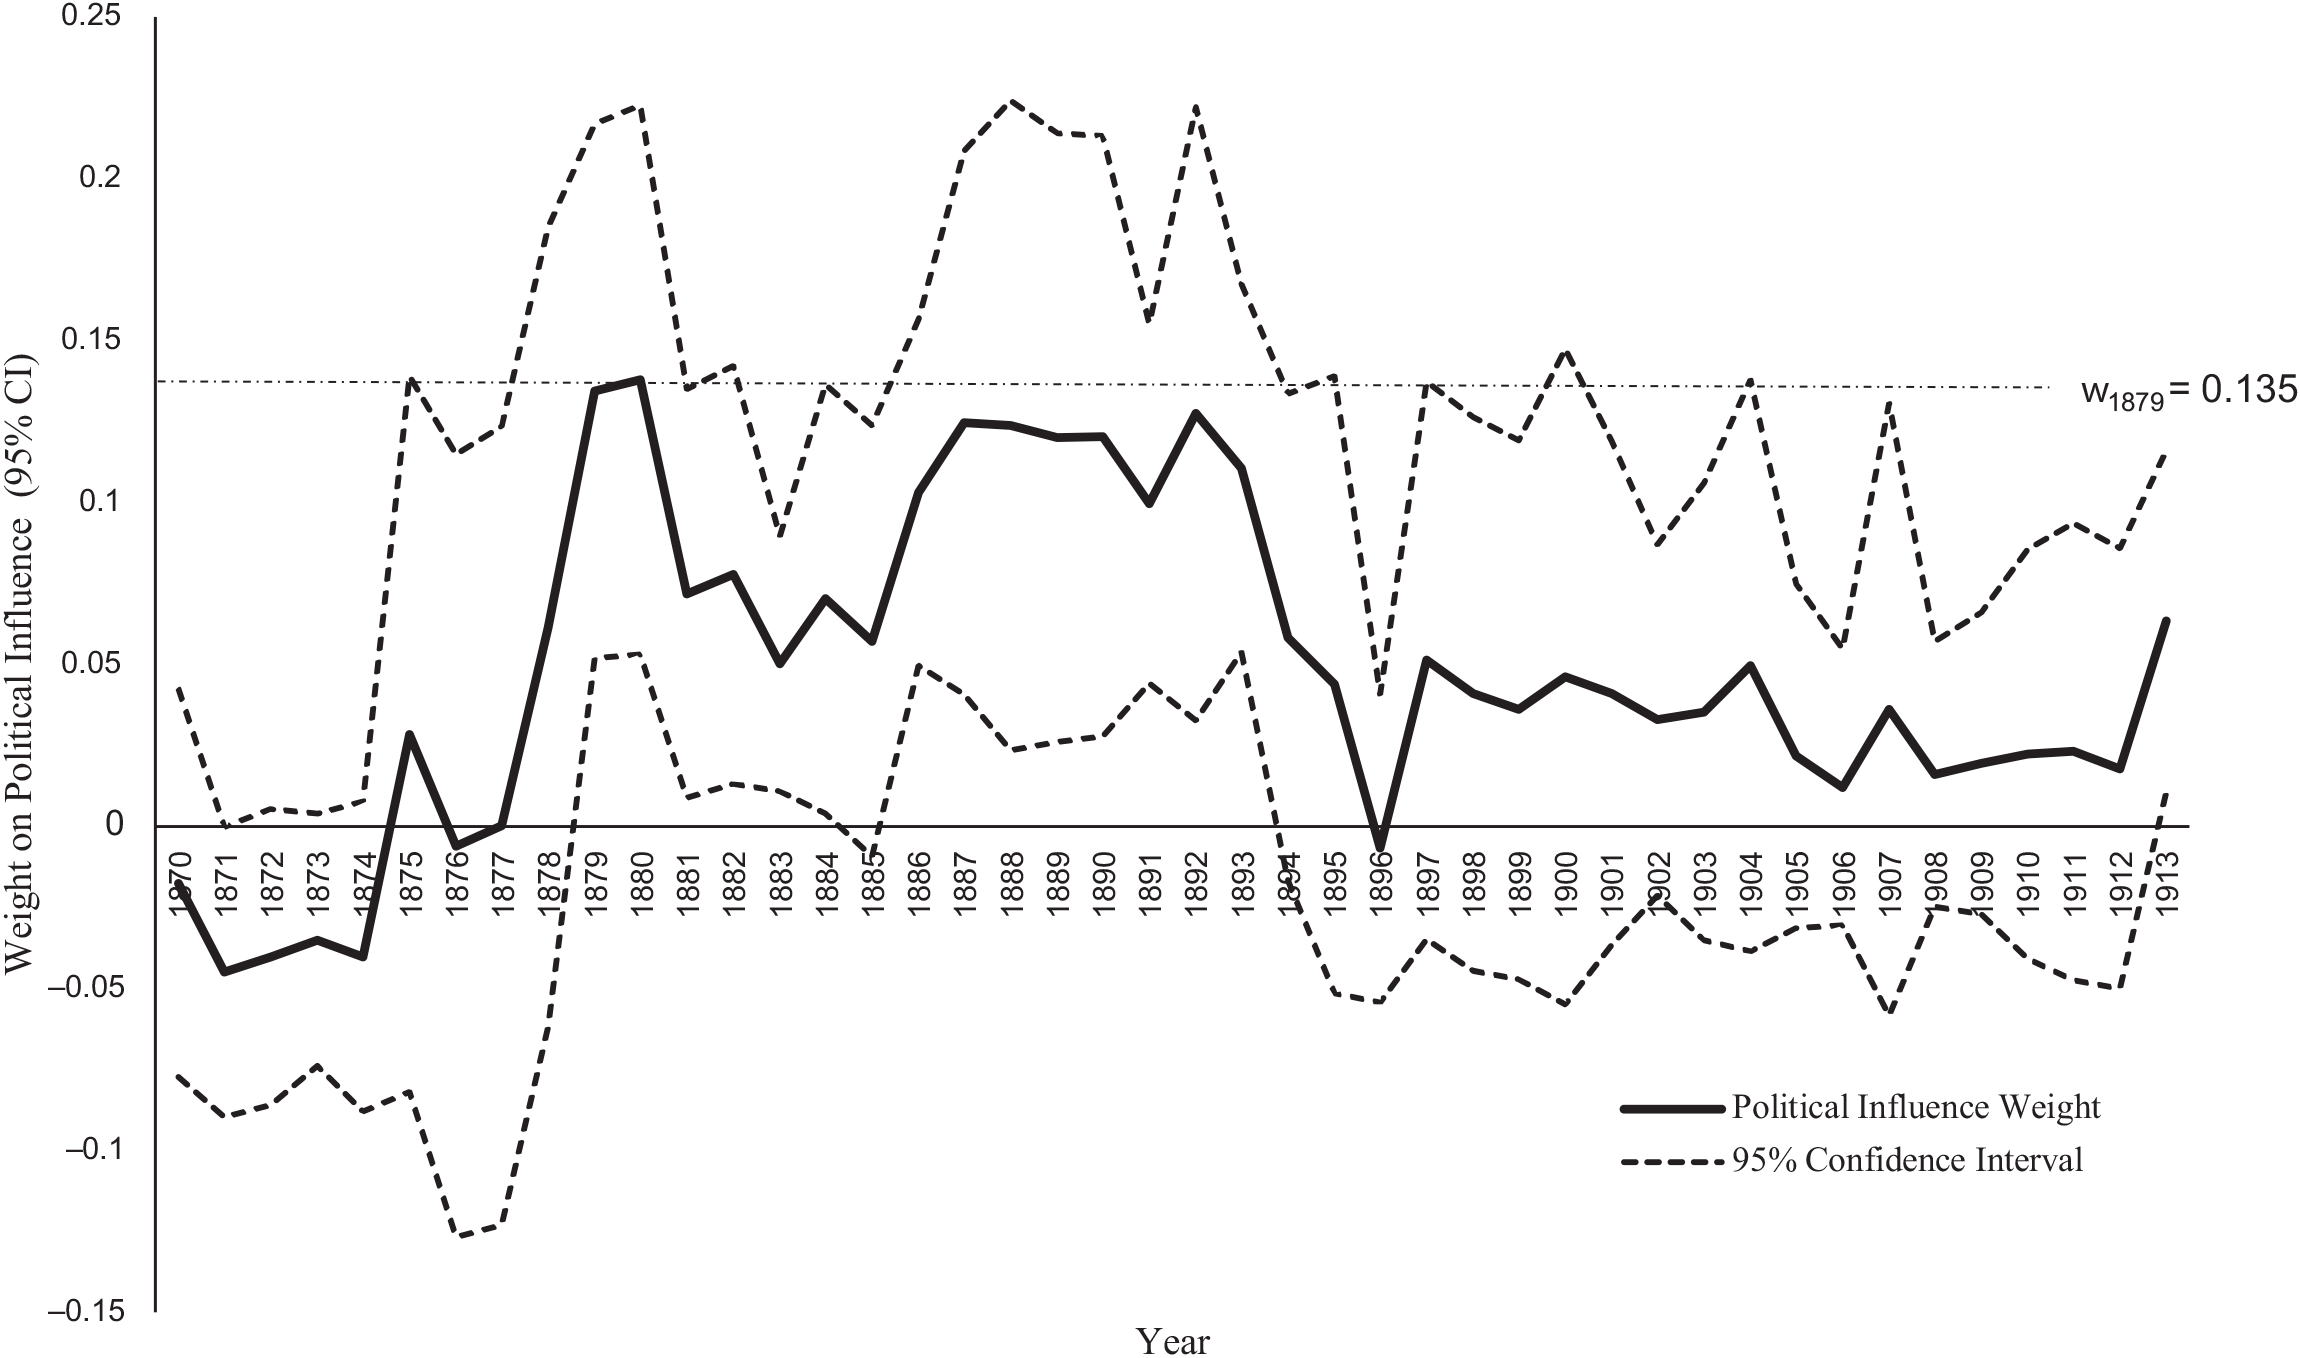
In contrast to these results from the pre-and post-National Policy periods, and consistent with our reduced form estimates, political influence appears to have been a much more important determinant of Canadian elasticity-weighted protection in 1880, the first full fiscal year following the adoption of explicitly protectionist trade policy objectives. Identification in Column (2b) relies on the plausibility of our assumption that product-specific inverse import penetration and political influence, which are both measured with data from 1871, were unlikely to have been strongly affected by tariff levels set under the National Policy eight years later. From Column (2b) we see that products with higher inverse import penetration ratios are still associated with lower levels of protection, but this result is now strongly overturned for politically influential products. In Canada in 1880, just as the Grossman–Helpman model predicts, politically influential products with strong domestic competition (high inverse import penetration) were differentially targeted for higher elasticity-weighted tariffs: γ 1 < 0, γ2 > 0, and (γ 1 + γ 2) > 0. The weight government placed on political influence in its objective function in 1880 is now strongly statistically distinguishable from zero and significantly higher than it was in 1877 or 1900: ω 1880 = 0.138. Through the lens of Grossman and Helpman’s theoretical model, these results suggest that protection was “for sale” in Canada in 1879.
To illustrate the abruptness and uniqueness of the Canadian government’s policy shift, in Figure 2 we depict annual estimates of the weight government places on political influence in their objective function: ω t ∀ t ∈ (1870, 1913). The parameters γ 1t and γ 2t are derived from annual OLS estimates of our protection-for-sale Equation (2) with industry fixed effects. Figure 2 also includes 95 percent confidence intervals, estimated with robust standard errors clustered by SIC2 industry. We can see that the relative importance of political influence only becomes statistically distinguishable from zero in the first fiscal year affected by the National Policy (1878). The political influence parameter peaks at 0.14 in 1880, and remains strongly statistically significant until the mid-1890s. After 1895 ω falls back towards zero, remaining there until the end of our period of study in 1913. We note that these time series patterns in ω closely match the timing of significant shifts in Canadian trade policy. For example, although average tariff levels increased under the Mackenzie tariff in 1874, revenue remained the primary policy objective until the protectionist National Policy was introduced in 1879 (Porritt Reference Porritt1908, p. 282), just as ω begins to rise. The political influence weight does not fall back towards zero until John Thompson’s Tariff Act of 1894 and Laurier’s “New National Policy” in 1897 began a retreat from peak protection and the targeting of specific products, in favor of preferential tariffs targeting of specific trade partners (Pomfret Reference Pomfret1993, p. 97; Porritt Reference Porritt1908, p. 389).
POLITICAL INFLUENCE WEIGHT IN GOVERNMENT OBJECTIVE FUNCTION

The short-lived impact of political influence on Canadian tariffs, from the late 1870s until the mid-1890s, illustrates the sophisticated and fluid nature of Canada’s policy response to the threats posed by U.S. protectionism and rapidly integrating global markets. Under the National Policy, the adoption of protectionist policy goals was associated with tariff increases that were disproportionately applied to manufactured finished goods. However, even within this product-category we find that protection was stronger for those products that had the closest domestic substitutes, substantial domestic competition, and politically connected domestic producers. Less than 20 years after the introduction of the National Policy, Canadian objectives appear to have shifted again, and although tariff changes continued to be narrowly targeted, they were no longer significantly favoring products produced by the most politically influential domestic producers.
Robustness and Sensitivity Testing
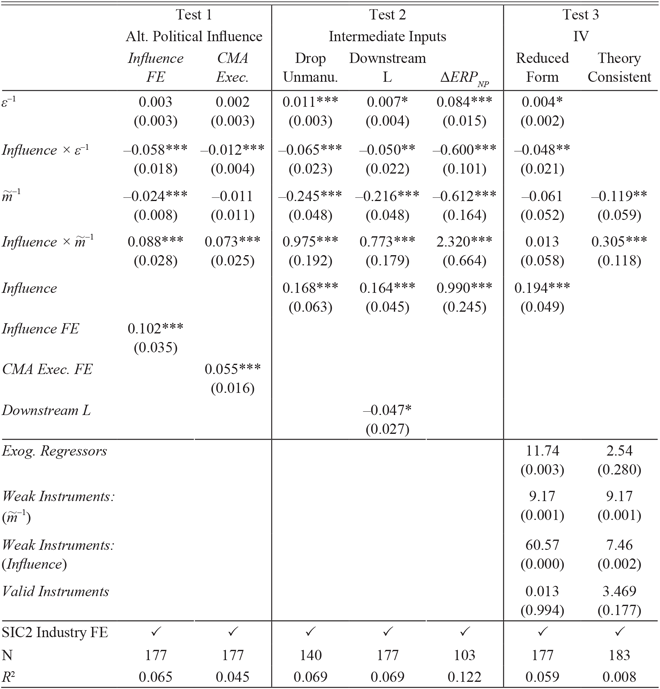
In Table 5 the results from a series of robustness and sensitivity tests are reported. These tests focus on three key features of our primary reduced form and theory-consistent specifications that are open to alternate approaches, interpretations, and reasonable extensions. In particular, our first set of tests investigate the adoption of other measures of political influence. The second set of tests extend our analysis of the interaction between the producers of finished import-competing products destined for final consumption, and downstream users of imported intermediate inputs. Our final two tests probe our identification assumption.Footnote 34
POLITICAL INFLUENCE ROBUSTNESS TESTS

Notes: See notes from Table 4, and text for definitions and specifications. Test (1): alternate measures of political influence include a categorical variable (Influence FE) that takes the value 1 for products with political influence in the top quartile of all products; and a categorical variable (CMA Exec.) that takes the value 1 for products with domestic production concentrated in Toronto or Montreal, and an industry representative on the OMA or MAM executive committees. Test 2: controls for the political influence of downstream producers that use import products as intermediate inputs by dropping all unmanufactured raw materials and unprocessed foodstuffs; including total employment in downstream industries as an additional right-hand-side variable; and using ERP in place of AWT as the dependent variable. Test 3 reports second-stage IV-estimates for the reduced form and theory consistent specifications that treat Influence and m̃–1 as potentially endogenous regressors. 1871 labor, capital, and raw material factor shares are used as excluded instruments, and Hausman joint exogeneity tests are reported, as well as weak instrument partial F-statistics from the first-stage, and Sargan over-identification tests for instrument validity. P-values are reported in parentheses for all IV-diagnostic tests.
Source: Authors’ calculations.
In our primary specifications, we measure the intensity of political influence at the product level as an unweighted average of five industry characteristics, three location characteristics, and one indicator for political representation. Although this approach is consistent with much of the theoretical and empirical literature on endogenous trade policy, it has no explicitly articulated theoretical foundation. To illustrate that our results are not dependent on our use of this flexible, but broad approach to the measurement of political influence, in Test 1 we explore the impact of using two, more narrowly defined and more transparent measures of influence. First, we replace our measure of the intensity of political influence in our reduced from specification with the categorical variable used in our theory-consistent specification. More specifically, we set the threshold for identifying influential products so that the Influence dummy variable equals one for those products in the top quartile of our intensity measure. Varying this threshold from 50 percent to 90 percent does not affect our assessment of the impact of political influence on Canadian tariff changes under the National Policy. To capture the opposite extreme in terms of the breadth of possible determinants of political influence, we replace Influence in our reduced form specification with our political representation indicator, which takes the value one for those products produced in Toronto or Montreal by an industry that had a representative on the executive committee of either the OMA or the MAM. In both of these tests the compression of our measure of influence down to a (0, 1) dummy variable reduces variation across products and makes the identification of conditional correlations in our reduced form specification a little more difficult. However, for both of these alternate measures of influence, the signs and significance of the estimated relationships linking tariff changes to elasticity, import penetration, and political influence, remain consistent with our primary specifications. Our results, therefore, do not appear to be dependent on our use of a broad, unweighted average of the intensity of producers’ political influence.
Given the importance that much of the National Policy literature (Pomfret Reference Pomfret1993, p. 97; Easterbrook and Aitken Reference Easterbrook and Aitken1956, pp. 393–94) places on distinguishing between the protection provided to finished goods relative to semi-finished intermediate inputs, it may be that the offsetting political influence of upstream and downstream producers was qualitatively and quantitatively different from the other indicators we include in Influence. We perform three robustness tests (Test 2) to extend our investigation of the role played by downstream producers in the revision of the Canadian tariff schedule in 1879. The 38 unmanufactured foodstuffs and raw materials imported into Canada in 1871 were used as intermediate inputs by downstream manufacturers. As a result, political pressure from manufacturing interests was almost certainly directed towards encouraging tariff reductions on these products. When we drop these unmanufactured products from our estimation of Equation (3) we see a slight increase in our standard errors, but no effect on the sign or significance of the impact of political influence on Canadian tariff changes. When we remove our indicator of upstream relative to downstream employment from Influence, and include total employment in downstream industries as an additional right-hand-side variable in our reduced form specification, we find that larger downstream industries are associated with smaller tariff increases in 1879, but this effect is small and imprecisely estimated relative to the impact of the upstream producers’ political influence. As a final test of the relative influence of upstream and downstream producers, we explicitly distinguish between the protection provided to finished goods relative to the protection offered to intermediate inputs by replacing the change in gross tariff rates (AWT) between 1877 and 1880, with the change in ERP as our dependent variable in Equation (3). From Table 5: Test 2, we can see that ERP rose even more sharply than gross tariff rates in response to an increase in political influence, and the differential effect of trade elasticity and import penetration on ERP for the most influential products is even larger and more sharply defined than for gross AWT.Footnote 35 In other words, the political influence of downstream users was significantly related to the tariff changes introduced in 1879, but this effect is not large enough to offset the impact of the upstream producers’ influence, and our primary measure of Influence seems to adequately capture the conflicting forces at work.
As a check on our identifying assumption that chronologically separating our dependent and independent variables eases simultaneity concerns, in Test 3 we report estimation results for Equations (2) and (3) derived with a very different identification strategy. Following Goldberg and Maggi (Reference Goldberg1999, pp. 1144–45) and Gawande and Bandyopadhyay (Reference Gawande and Usree2000, pp. 142–43), we employ a control function IV approach to instrument for import penetration and political influence. More specifically, rather than relying on product-specific output values from 1871 to calculate import penetration ratios, we extrapolate annual output figures using SIC2 industry-specific gross output indexes, calculated from Malcolm Urquhart (Reference Urquhart1993, Table 4.1). We then divide the extrapolated annual output values by contemporaneous import values to measure annual import penetration. In the first stage of our IV estimation we instrument for these annual import penetration ratios ( $\tilde m_t^{ - 1}$) and Influence using product-specific factor shares calculated from the manuscripts of the 1871 industrial census.Footnote 36 As we expect, because we are using extrapolated annual import penetration ratios in Test 3, the IV point estimates differ from the OLS estimates reported in Table 4: Columns (1b) and (2b), but our qualitative conclusions are unaffected. Specifically, even when we instrument for import penetration and political influence, the most influential products with relatively high levels of domestic production and high trade elasticities, appear to have enjoyed significantly higher tariffs in 1880, and the importance government places on political influence in its objective function increases significantly between 1877 and 1880 (from 0.013 to 0.257).Footnote 37 The results from our primary specifications and our robustness and sensitivity tests, tell a consistent story—under the National Policy, tariff increases were larger for imports with relatively close domestic substitutes, high levels of domestic production, and politically influential import-competing domestic producers.
CONCLUSION
As a resource-rich, rapidly industrializing, small open economy, Canada was exposed to the pressures of international market integration and the protectionist tendencies of the United States, during the first era of globalization. The Canadian federal government under John A. Macdonald responded to these pressures by introducing the National Policy in 1879. One of the defining features of this policy was a revision of virtually every line of the Canadian tariff schedule, with the explicit goal of protecting domestic manufacturing industries from foreign competition. In this article we use newly digitized annual product-specific information on import values and duties paid, linked to manuscript census data on Canadian industrial establishments in 1871, to identify chronological and cross-section patterns in the distribution of Canadian AWTs and ERP.
We find that the shift in Canadian trade policy towards protectionism was more complex and sophisticated than is apparent from evidence on aggregate tariff levels. In 1879, Canadian average tariff rates increased sharply, and the selectivity and structure of the tariff schedule was transformed. Under the National Policy tariff adjustments differentially targeted products across and within industries, narrowly focusing on manufactured finished goods. Using theory-consistent estimating equations based on the protection-for-sale model, and flexible reduced-form specifications, we document the extent to which product-specific differences in protection were related to differences in imports’ penetration ratios, trade elasticities, and the political influence of import-competing domestic producers. Political influence played a key role in the selection of import products subject to relatively high tariffs.
Canada’s adoption of protectionism was not uniformly applied across products, and the recognition of this fact opens the door to a re-examination of long-standing debates that have motivated much of the historiography on trade policy and international economic development during the late nineteenth and early twentieth century era. Our detailed characterization of the changes in the structure of Canada’s post-1870 trade policy leads to a greater appreciation of the relationship between policy outcomes and the process by which tariffs were set. This appreciation can inform investigations into the consequences of the policies that were adopted as a response to the powerful market integration forces that were at work during this period.
In our Canadian historical context, we learn about some structural features of the National Policy that have not been apparent from other studies based on more aggregate evidence. From a broader perspective, we also learn that any study of the effects of trade policy must look within industries and product categories to identify the source of these effects. The nature of the import products, and the characteristics of the domestic industries competing against them were strongly related to the distribution of protection under Canada’s National Policy. Big, highly concentrated, urban producers with close import substitutes, were disproportionately influential in the adoption of protectionist tariffs in Canada in 1879. As a result, it is among these producers that we should look to identify the strongest effects, both positive and negative, of the adoption of higher, more selective tariff rates.
Supplementary materials
To view supplementary material for this article, please visit https://doi.org/10.1017/S0022050719000317