


In this report, we discuss the journal’s operations from August 25, 2016 to August 24, 2017—our first year as the Review’s editors. The new team at the University of Mannheim, the London School of Economics and Political Science, and the University of Cologne started in late August. While previous APSR editorial teams started in July, this report provides an overview of our first 12 months and balances reporting details about the editorial process, such as decisions, turnaround times, and describing general developments to the comparable period. The numbers presented in figures and tables follow the reporting details of previous reports, while we discuss specific statistics regarding our team in the text. Near the end we include a small section on submissions since August 24 to round out 2017.
First, we would like to take the opportunity to express our great thanks to President David Lake, President-Elect Kathleen Thelen, Past-President Jennifer Hochschild, the APSA staff, the Council, and the Publications Committee, as well as to Cambridge University Press for their support and guidance over the past year, especially during the transition process. With the support of APSA’s executive director Steven Rathgeb Smith, APSA’s former director of publications Barbara Walthall, and Cambridge University Press’s Mark Zadrozny we were able to master all the challenges of the transition and they continued to provide countless assistance throughout our first year. We would also like to thank the previous team from the University of Northern Texas (UNT), and in particular the former lead editor John Ishiyama for their support. We would also like to thank the members of our editorial board, who provided countless reviews and served as guest editors during our first year. Finally, we thank all of the authors who submitted their manuscripts and the reviewers who evaluated them.
Taking over the editorship brought on quite a few changes for the American Political Science Review other than moving across the pond and getting a new workfiow structure. Our first innovation was moving towards pre-print online publication with FirstView, which has been in full swing as of our second issue, May 2017–Volume 111 Issue 2. As all scholars are well aware, the peer review process is long and tedious. Having to wait in a queue to be published in print can add additional burden for certain scholars, such as those entering the job market, applying for a promotion, or those who have time relevant or sensitive findings. As a way to combat this, publishers have begun offering online publication as a way for researchers to be peer reviewed and published faster. With the introduction of APSR’s FirstView, we have managed to publish a majority of articles online before their print publication. Specifically, nearly all of our November and February issues were published to FirstView before print and we anticipate this trend continuing.
We also introduced our new publication format, the letter. Compared to standard manuscripts with a maximum length of 12,000 words, which are supposed to use original work to advance understanding of important political issues, and which are of general interest to the field of political science, letters are 4,000 word articles that address important research questions or areas, show novel perspectives on existing research, and encourage continued debate in the discipline. Through this new medium, insights and research that do not fit the longer manuscript format are given the opportunity to shine–whether it is as new theoretical perspectives, methodological approaches, alternative empirical findings, debates on existing work, and everything in between. We hope that this format increases the interdisciplinary contributions that address important questions in political science and broaden our readership. In the next section, we review letter submissions in more detail.
EDITORIAL PROCESS AND SUBMISSION OVERVIEW
The transition from UNT to our team was smooth, given that the circumstances around it were challenging. The UNT team took care of all new submissions until August 24, 2016 and continued processing all manuscripts that had come in under their term (including all “revise and resubmits” and accepted articles) until December 31, 2016. They also took over the completion of Volume 110 with the final two issues of August and November (3 and 4, respectively). The UNT team had enough manuscripts “on stock” for our team to fill Volume 111 Issues 1 and 2. This relieved pressure and allowed us ample time to produce Issues 3 and 4. For this, we are extremely grateful to the UNT team.
In the following section, we present an overview on the editorial process and submissions over the last ten months. Similar to previous reports, we discuss the turnaround time, number of submissions, mix of submissions by subfields, approach, internationality and gender of our contributors with respect to the previous year. We retrieved the data from our editorial management system.
Number of Submissions
Between August 25, 2016 and August 24, 2017 , we received a total of 1,204 submissions, translating to an average of about three submissions per day. During that same time period the previous year, the number was about 24% lower or 971 submissions. As also indicated in figure 1, it is the highest number of submissions received by the APSR. Note, however, that figure 1 presents submissions for terms running from July 1 to June 30 to ensure comparability over time, whereas later tables and figures are adjusted to change in term duration due to the transition process.Footnote 1 In addition to the new submissions, we received 114 revisions and took over 156 manuscripts from the UNT team. Figure 1 shows both the number of new submissions and the total number of received submissions when revisions are included. As the graph indicates, the general trend of increasing submission numbers was already observable in previous years and continues to reach new records each year.
Submissions per Year (by First Receipt Date)
Each term runs from July 1 to June 30.

As part of our editorship, we introduced a new submission format, letters, and while it is still in its infancy, we already received 123 letter submissions in our first year, constituting about 10% of the overall submissions. This number has shown a steady increase since letters were introduced (figure 2). In terms of a subfield breakdown, while our letter submissions do not perfectly mirror normal submissions, they refiect a similar trend. Namely, Comparative Politics makes up 29% of letter submissions (31% of manuscripts), International Relations 10% (14%), Formal 4% (6%), and Other 7% (8%). The main differences are seen in American Politics, which makes up a noticeably larger proportion of letter submissions, at 30%, than manuscript submissions, at 18%, Methods at 8% compared to 3% of manuscripts, and Normative Political Theory which is ten percentage points lower than manuscript submissions. We were excited to have published our first letter in Volume 111(4) and currently have four additional letters in our accepted pipeline. We look forward to publishing more letters in the coming year.
Letter Submissions per Month since September 2016 (by First Receipt Date)

Workfiow and Turnaround Times
One of our primary goals as an editorial team has been to create an efficient workfiow which would reduce the time for a first decision to be rendered, even with the number of submissions increasing. In order to do so, we altered our workfiow from that of the previous UNT team, which means our turnaround statistics are no longer as easily and directly comparable. Previously, APSR submissions were distributed among associate editors with specialized expertise. Since August 2016, we replaced this model with a bilateral decision-making model, where the lead editor decides in a first round of inspection on initial desk rejection before the manuscript is passed on to the field-specific associate editors. To maintain comparability over time, we, therefore, calculated the times for “editor assignment” as the editor who made the first decision rather than the lead editor who receives the manuscripts first, as is in our current workfiow.
It took us on average four days until a manuscript was first tech-checked after we first received it. The overall duration from first receipt until a manuscript was forwarded to our lead editor, Thomas Koenig, was seven days. In total, we have to send back about 28% of manuscripts for “technical” reasons.
Usually within one day, the manuscript was then either summary rejected by our lead editor or passed on to one of the associate editors. From the assignment of an associate editor until the first reviewer was assigned, it took, on average, another 11 days. Alternatively, the associate editors took, on average, six days to summary reject manuscripts.
Table 1 provides details on the development of the turnaround times. It shows the duration between the main stages of the editorial process, from submission to editor assignment, first reviewer invitation, from editor to first decision and submission to first decision (distinguished between whether it was a desk rejection or not), starting with the initial submission date. In contrast to the “First Receipt Date,” which is the first time we receive a manuscript, initial submission refers to the date our journal first received a manuscript without it having been sent back to the authors due to formatting issues.
Journal Turnaround Times (in days)

* Terms run from July 1 to June 30 of the following year except for the term 15-16 which runs from July 1, 2015 to August 24, 2016 as well as 16-17 which runs from August 25, 2016 to August 24, 2017.
Two things are worth pointing out:
1. The change of the workflow from the previous team becomes apparent when comparing the turnaround times from the initial submission to editor assignment and from editor assignment to first reviewer invitation. While it took the previous team longer until the responsible editor was assigned, they were faster in inviting reviewers after assignment. All things considered, however, the numbers are similar–17 days for the last year of the UNT team versus 15 days for the first year of our team until reviewer invitation.
2. Despite the increasing number of manuscripts our editorial team has to manage, we were able to decrease the time until a first decision from 72 days to 60.Footnote 2 This decrease is mostly driven by our higher desk rejection rate, as the time until a manuscript is desk rejected was five days faster in 2016/2017 than in 2015/2016.
Invited Reviewers
During these first 12 months, we invited 4,082 reviewers. While 881 of the invited reviewers declined, 2,723 reviewers accepted their invitation to review. 76% of those who responded to our review invitations agreed to review, which is slightly higher than the 71% from the same time period in the previous year. The remaining reviewers were either terminated after agreeing or a response to our invitation is pending. Based on the reviews completed during the period from August 25, 2016 to August 24, 2017, it took the reviewers on average 34 days after invitation to complete their reviews, which is the same average completion time the UNT team experienced in their last year as editors.
Furthermore, despite the substantive increase in submissions, we have managed to decrease the overall number of reviewers we have invited (see table 2). This results from our policy to increase the number of desk rejections. We hope that this effectively saves our reviewer pool and, while not necessarily a direct intention, also decreases turnaround times for authors. At the same time, the share of invited reviewers who agree to review has risen. We also consulted our editorial board members with respect to 102 distinct manuscripts, sending out a total of 102 invitations and receiving 72 reviews.
Number of Invited Reviewers and Completed Reviews (By Invitation and Completion Date, respectively)

* Terms run from July 1 to June 30 of the following year except for the term 15-16 which runs from July 1, 2015 to August 24, 2016 as well as 16-17 which runs from August 25, 2016 to August 24, 2017.
Mix of Submissions
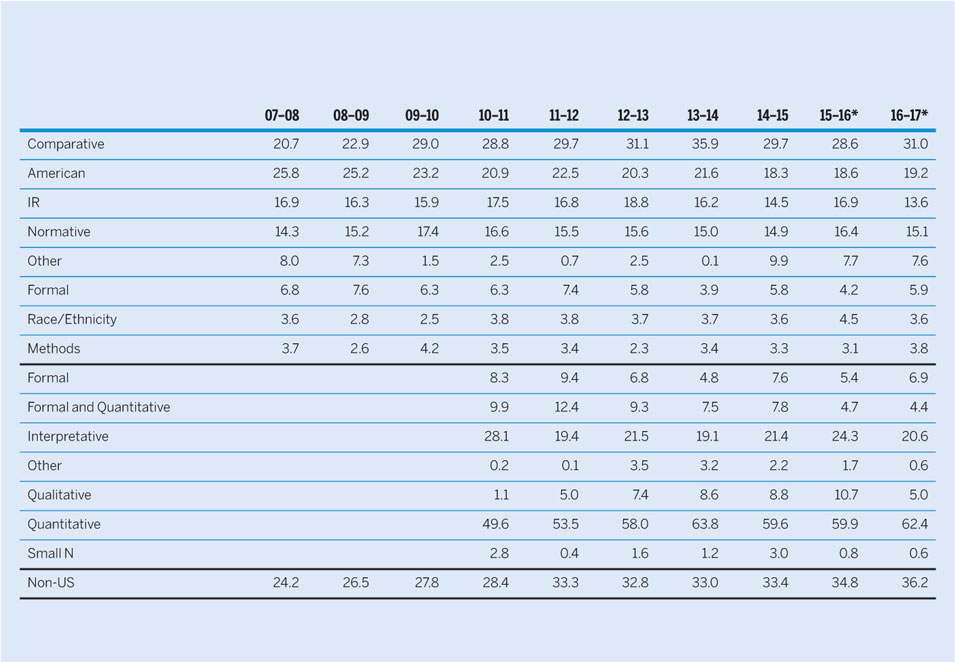
Like in previous years, the share of submissions is highest from Comparative Politics, followed by American Politics, Normative Political Theory, and International Relations. The first section of table 3 shows the pattern of submissions by subfield over time.
Mix of Submissions by Subfield, Approach, Location of First Author, and Gender (in percent of total)
* Terms run from July 1 to June 30 of the following year except for the term 15-16 which runs from July 1, 2015 to August 24, 2016 as well as 16-17 which runs from August 25, 2016 to August 24, 2017.
Within our first 12 months, Comparative Politics submissions slightly increased to 31%, while submissions in American Politics and Normative Political Theory remained stable with about 19% and 15%, respectively. The share of submissions of International Relations slightly fell to about 13%. All other submissions remained close to previous levels.
The second section of table 3 shows the breakdown of the submitted manuscripts’ methodological approaches. Editorial teams are responsible for coding the approach during the technical check process.Footnote 3 The table shows that the share of quantitative approaches continues to constitute the largest proportion of submissions at about 62%, while the share of submissions classified as interpretative/conceptual is the second largest with about 21%. The share of formal papers has remained constant around 7%, which is similar to formal/quantitative (4%) and qualitative/empirical (5%). Note that codings of submissions are non-exclusive (multiple mentions are possible).
Similar to previous reports, we have also gathered data on the internationality of authors. To indicate the diversity and global reach of the APSR, we use the share of submissions from institutions of the corresponding author outside the US (see last row of table 3). During our term, the steady trend of increased non-US submissions rose to 36%, which is the highest since the data has been available.Footnote 4 After the US, the countries with the most submissions are the United Kingdom (8.2%) and Germany (4%).
OUTCOMES
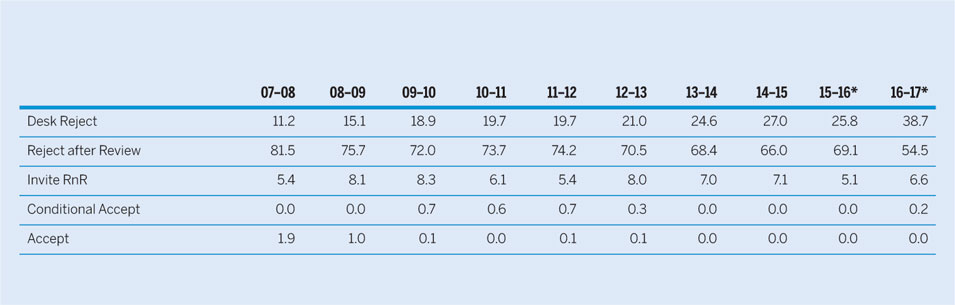
Table 4 displays the outcomes of the first round over the past five years. The number of desk rejections has, as aforementioned, risen in comparison to the rejections after review as it was a specific goal of ours to reduce the overall turnaround times for authors and avoid “reviewer fatigue.” The share of desk rejections increased to about 39% during 2016/2017, while it was at about 20% in the years before. In contrast, the share of rejects after review decreased from about 69% in 2015/2016 to 55% in 2016/2017. In total, we end up with comparable numbers of rejections over time, that is more than about 90% since 2007. The share of “Revise & Resubmits” remains almost constant with about 7%.
Outcome of First Round (in percent of total)
* Terms run from July 1 to June 30 of the following year except for the term 15-16 which runs from July 1, 2015 to August 24, 2016 as well as 16-17 which runs from August 25, 2016 to August 24, 2017.
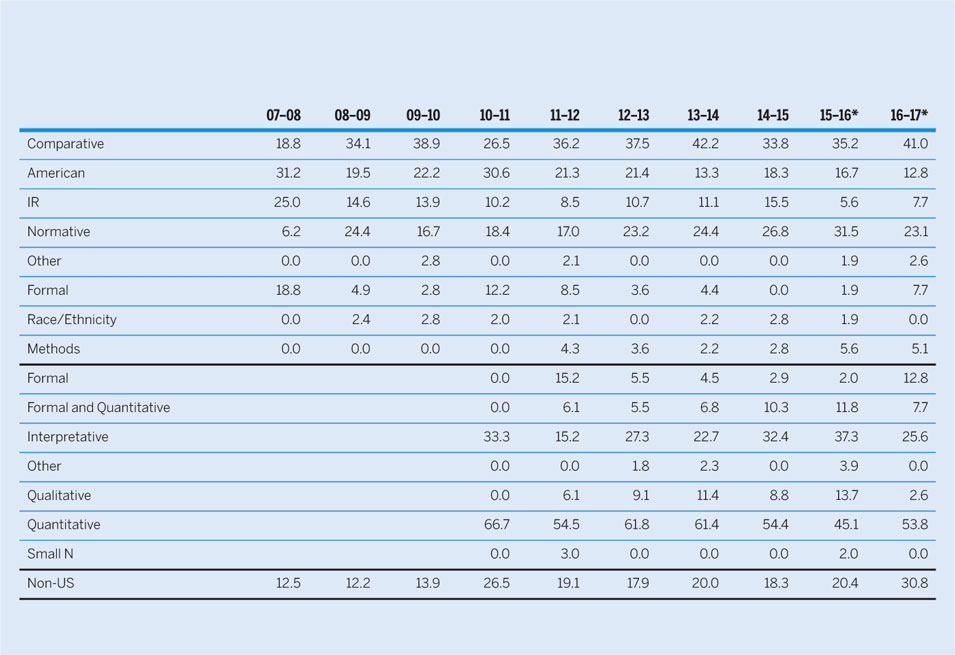
Between August 25, 2016 and August 24, 2017 our editorial team accepted 33 manuscripts which were either transferred from the previous team or submitted under our term. Of these 33 articles which we accepted, the highest share with 13 publications were from Comparative Politics, followed by eight from Normative Political Theory and five from American Politics. We published three Formal Theory articles, one paper from International Relations, and one Other. In addition, seven manuscripts were accepted in September 2017, followed by an additional 15 in November and December 2017. Of these, 16 have been published and the rest are in various stages of production.
The share of comparative articles is the highest among accepted papers (with about 35% over time) and slightly higher than the share of comparative submissions (about 30% over time), while American Politics and International Relations have lower acceptance than submission rates. Most strikingly, however, is that Normative Political Theory submission have by far the highest acceptance rate with a submission share of about 15% and an acceptance share of over 30% in recent years. Furthermore, interpretative submissions have a similar acceptance share to quantitative submissions (34% against 43%), while the submission relationship is about one to three. Even though the submission share of papers from non-US authors is rising to about 36%, their acceptance share is lower (about 30%). For comparison with previous years, table 5 illustrates the distribution of accepted papers by subfield.
Mix of Accepted Papers by Subfield, Approach, Location of First Author, and Gender (in percent of total)
* Terms run from July 1 to June 30 of the following year except for the term 15-16 which runs from July 1, 2015 to August 24, 2016 as well as 16-17 which runs from August 25, 2016 to August 24, 2017.
Gender in the APSR
To classify the gender of the authors and reviewers, we used the “genderizeR” package by Wais (2016)Footnote 5 to determine the gender of all first names and middle names that are saved in the “People” and the “Author” database in Editorial Manager. The main advantage of this package compared to other available packages in R is that it relies on the highly international ”genderize.io” database which covered 216,286 distinct names from 79 countries and 89 languages at the time of analysis.Footnote 6 Then we merged the gender classification of names to authors’ and reviewers’ first and middle names, respectively. If we were not able to identify the gender using the R-package or if the gender of the first name and middle name contradicted each other, we hand-coded these cases by searching the authors and reviewers online.Footnote 7
Figure 3 shows the general trend over time. The share of male contributions has slightly decreased over time, while mixed gender team submissions has been slowly increasing. The share of female authors’ submissions remains low. Note that we are currently writing a separate report and collaborating with other journal editors to go into detail about gender in the editorial process.
Submissions by Gender for Manuscripts Submitted Between June 2007 and June 2017
Each term runs from July 1 to June 30.

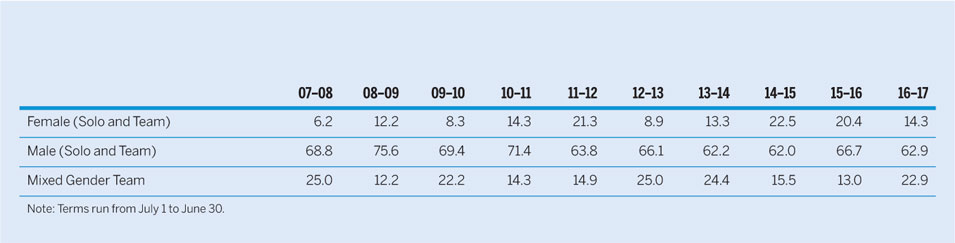
Out of the 55 submissions which the new editorial team of the APSR accepted between September 2016 and December 2017, 17 publications were single authored by males and 19 publications were coauthored by full male teams. Eleven publications were work by mixed gender teams. Eight submissions were single-authored by female scholars and no publication was coauthored work by full female teams. For comparison with previous years, see table 6.
Gender Mix of Accepted Papers (in percent of total)
Note: Terms run from July 1 to June 30.
SUBMISSIONS BETWEEN AUGUST 25, 2017 AND DECEMBER 1, 2017
Between August 25 and December 31, the APSR received 356 manuscripts, 300 of which were articles (84%) and 56 were letters (16%). 28% of these submissions were Comparative, 20% American Politics, 17% Normative Political Theory, 13% International Relations, 6%Formal Theory, 5% Race/Ethnicity and 8% Other. 40% of submissions received were from corresponding authors whose institutions lie outside the US.
Our editors invited 1,205 reviewers, 68% of whom accepted the invitation. In addition, we received 672 completed reviews.
In the first round of decisions, the APSR editors desk rejected 35% of submissions, 54% were rejected after review and 11% were invited for a “Revise and Resubmit.” One manuscript received a “Conditional Accept.” Twenty manuscripts were accepted for publication. 30% of these accepted manuscripts came from the subfield of Comparative Politics, 35% from Normative Political Theory, and 15% from American Politics. In addition, we accepted one manuscript each from Formal Theory, Methods, Race/Ethnicity, and Other. More than half of the acceptances took a quantitative approach at 12 manuscripts, seven manuscripts were interpretative/ conceptual, and one manuscript each had a formal or qualitative approach.
VISIBILITY & TRANSPARENCY
The American Political Science Review remains a leading journal in political science, despite a decline in the two year impact factor. In figure 4, the five year impact factor suggests that APSR publications remain continuously attractive for other scholars’ work. However, it is also visible that the decrease of the two year impact factor started some years before. One reason for this decline could be attributed to the availability of published articles. When articles are only available with the printed issue and the issue is published late, the likelihood for getting quoted decreases. We believe that FirstView may overcome the effects that waiting for print has on articles’ impact in the research community, thereby increasing their impact factor. However, given the time lag between publication and the calculation of the two year impact factor, we expect to only notice an effect of FirstView as our term comes to an end.
Impact Factor since 2010
Each term runs from July 1 to June 30.

Furthermore, the availability of the data and materials used in these articles may increase the visibility and attractiveness of APSR publications. In 2015, the UNT team updated the APSR submission guidelines to incorporate DA-RT principles. Ever since, authors of 99 articles have uploaded data and materials to Dataverse, and five have since added additional data to their Dataverses to supplement their original work.Footnote 8 With Dataverse’s inception in 2007, some APSR authors uploaded ex post their data and code, such that the data and materials of 26 articles published before 2007 are available online, the oldest article from 1987. However as several contributors have their own Dataverses, we also maintain a list of APSR articles with their Digital Object Identifier (DOI).
CONCLUSION AND OUTLOOK
With the support from many individuals and groups we overcame the transition process and for the first time, APSR is being edited outside the United States. And while the number of submissions continues to reach a new record each year, we managed to decrease the turnaround time slightly. As such, we have achieved one goal, which we promised when we took over. We also implemented other goals with the introduction of FirstView, the letter format, rolled out our Overleaf template, which will facilitate the uploading of (collaborative) LATEX-created PDFs to Editorial Manager that match our submission guidelines, and gave the journal’s cover a facelift.
In addition to our effort over the past year to reduce the turnaround time of an increasing number of manuscripts, we are also working on implementing another promise of our editorship–the provision of more transparency into the editorial process. In addition to this report, we are collaborating with other journal editors on a project about gender bias in the editorial process. For this project, we are gathering and exploring data, which we will publish soon. Compared to existing reports we will use gender of all authors and explore their role in the editorial process.
However, we also face challenges. Instead of emphasizing the increasing five year impact factor or ignoring the impact factors at all, we are concerned about the continuous decline of the two year impact factor. As a response, we also plan on investigating the reasons for this decline and believe that this will help us to better understand scholarly quotations.
In sum, we are on track to realize the goals that we laid out in our initial editors’ manifesto in 2015. We admit that it is a challenging task to run one of our leading scholarly journals. We send out all reports to provide maximum transparency, and we have received both criticism and applause from our contributors ever since. When justified, we allow an appeal on our decisions. In addition to managing the editorial process, this task encompasses a close partnerships with the American Political Science Association and Cambridge University Press. We hope that we will effectively serve our discipline and remain grateful for the support of all partners and colleagues.



