Introduction
Layered double hydroxides (LDH) are a group of anionic clay materials which have, in recent years, attracted increasing attention for biomedical applications such as disease imaging and delivery of genes, drugs, and vaccines for anti-cancer and anti-bacterial treatments (Choy et al., Reference Choy, Jung, Oh, Park, Jeong, Kang and Han2004; Xu et al. Reference Xu, Jin, Liu, Hao and Lu2008a, Reference Xu, Niebert, Porazik, Walker, Cooper, Middelberg, Gray, Bartlett and Lu2008b Choi & Choy, Reference Choi and Choy2011). The LDH materials have several unique features, including large anionic exchange capacities, biocompatibility, facilitation of the cellular uptake of payloads, protection of payloads, and control-release of biomolecules and drugs in a pH-dependent manner (Li, L et al., Reference Li, Gu, Liu and Xu2015; Li X. et al., Reference Li, Ke, Huang, Ye and Huang2015). The inherent surface positive charge and anion exchange property enable LDH nanoparticles to carry and deliver anionic biomolecules and pharmaceutical drugs such as oligonucleotides (Li et al., Reference Li, Gu, Chen, Chen and Xu2014), DNAs (Desigaux et al., Reference Desigaux, Richard, Pitard, Belkacem, Cellier, Leroux, Taviot-Guého, Léone and Cario2006), siRNAs (Chen, C. et al., Reference Chen, Cooper, Zhou, Bartlett and Xu2013; Chen, M. et al. Reference Chen, Yee, Gong, Zhang and Xu2013; Wong et al., Reference Wu and Hu2012), methotrexate (Choi et al., Reference Choi, Piao, Alothman, Vinu, Yun and Choy2016), 5-fluorouracil (Li et al., Reference Li, Gu, Chen, Chen and Xu2014), and anti-inflammatory drugs (diclofenac, gemfibrozil, ibuprofen, and naproxen) (Khan et al. Reference Khan, Lei, Norquist and Hare2001).
As a natural mineral and readily synthesized material, LDH has a hydrotalcite-like structure, consisting of positively charged brucite-like cationic layers, negatively charged interlayer anions, and hydrogen-bonded water molecules, with a general composition formula of [M 2+1 − x M x 3+(OH)2] x+(A n−) x/n ·mH2O, where M 2+, M 3+, and A n− represent divalent and trivalent metal cations and anions, respectively (Wang & O'Hare, Reference Wang and O'Hare2012; Xu et al., Reference Xu, Jin, Liu, Hao and Lu2008a, Reference Xu, Niebert, Porazik, Walker, Cooper, Middelberg, Gray, Bartlett and Lu2008b). Apart from the unique structure and properties which make for efficient delivery vehicles, many fluorescent dyes and inorganic nanoparticles have been tethered to LDH for optical imaging, X-ray computed tomography (CT), and magnetic resonance imaging (MRI) (Xu et al., Reference Xu, Jin, Liu, Hao and Lu2008a, Reference Xu, Niebert, Porazik, Walker, Cooper, Middelberg, Gray, Bartlett and Lu2008b; Chen, M. et al., Reference Chen, Cooper, Zhou, Bartlett and Xu2013; Chen, C. Reference Chen, Yee, Gong, Zhang and Xu2013; Li et al., Reference Li, Zhang, Yu, Guo, Chaudhary and Wang2013; Wang et al., Reference Wang, Xing, Zhang, Ren, Pan, Zhang, Bu, Zheng, Zhou, Peng, Hua and Shi2013; Lee Reference Lee, Jung, Kim and Ahn2014).
A reliable method was developed to produce homogeneously dispersed MgAl-LDH nanoparticles, in aqueous suspension, which have a well-controlled size (50–300 nm) (Xu et al., Reference Xu, Stevenson, Lu and Lu2006a, Reference Xu, Stevenson, Lu, Lu, Bartlett and Gray2006b). As MgAl-LDH nanoparticles are very positively charged (zeta potential of 30–50 mV) Reference Zuo, Chen, Li, Xu, Cooper, Gu and Xu2006), negatively charged proteins (e.g. bovine serum albumin [BSA]) are adsorbed readily on the surface to prevent possible aggregation in physiological buffers or in an in vivo environment (Gu et al. Reference Gu, Zuo, Li, Wu and Xu2015), unlike so-called (3-aminopropyl)triethoxysilane (APTES) coating strategies (Park et al. Reference Park, Kwon, Woo and Kim2005; Li, S. et al., Reference Li, Gu, Liu and Xu2015; Li, X. et al., Reference Li, Ke, Huang, Ye and Huang2015). The approach to colloidal stabilization of LDH nanoparticles in media underpins the LDH-based application in vivo.
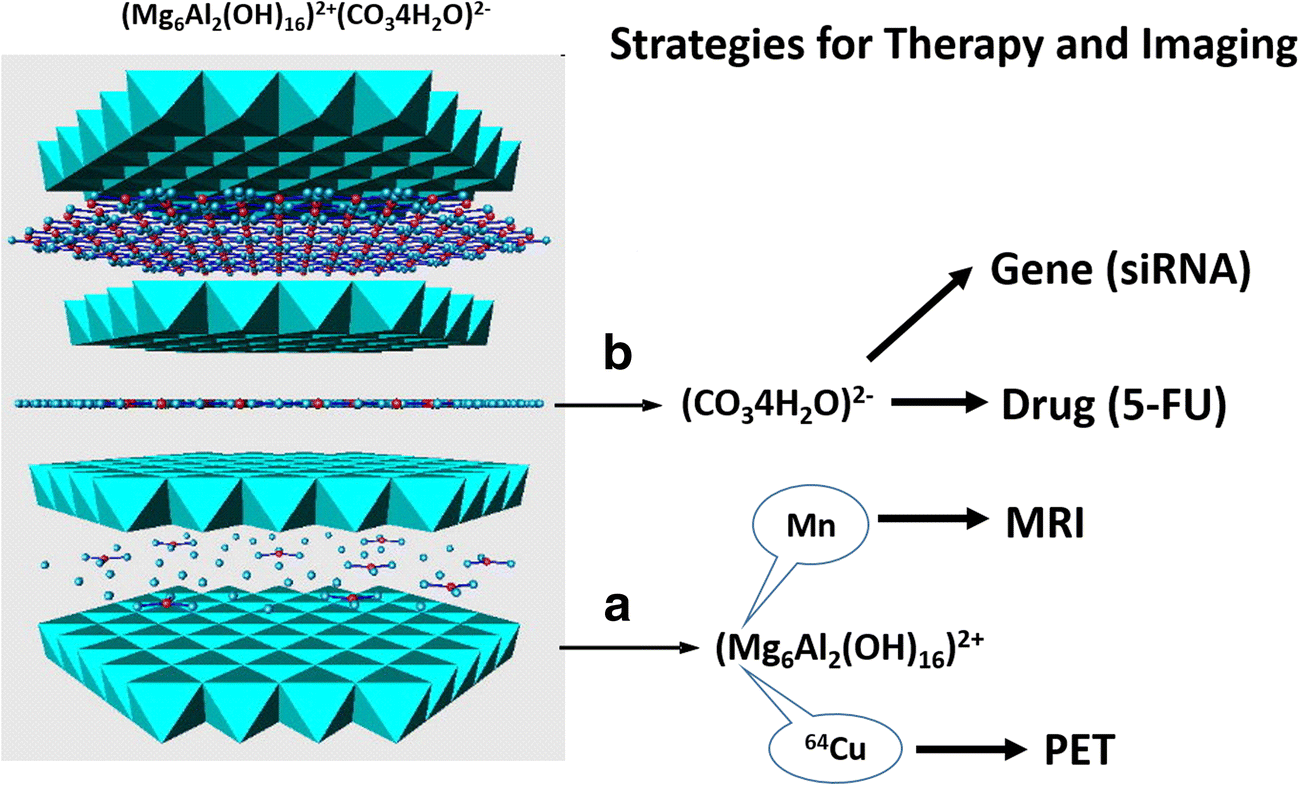
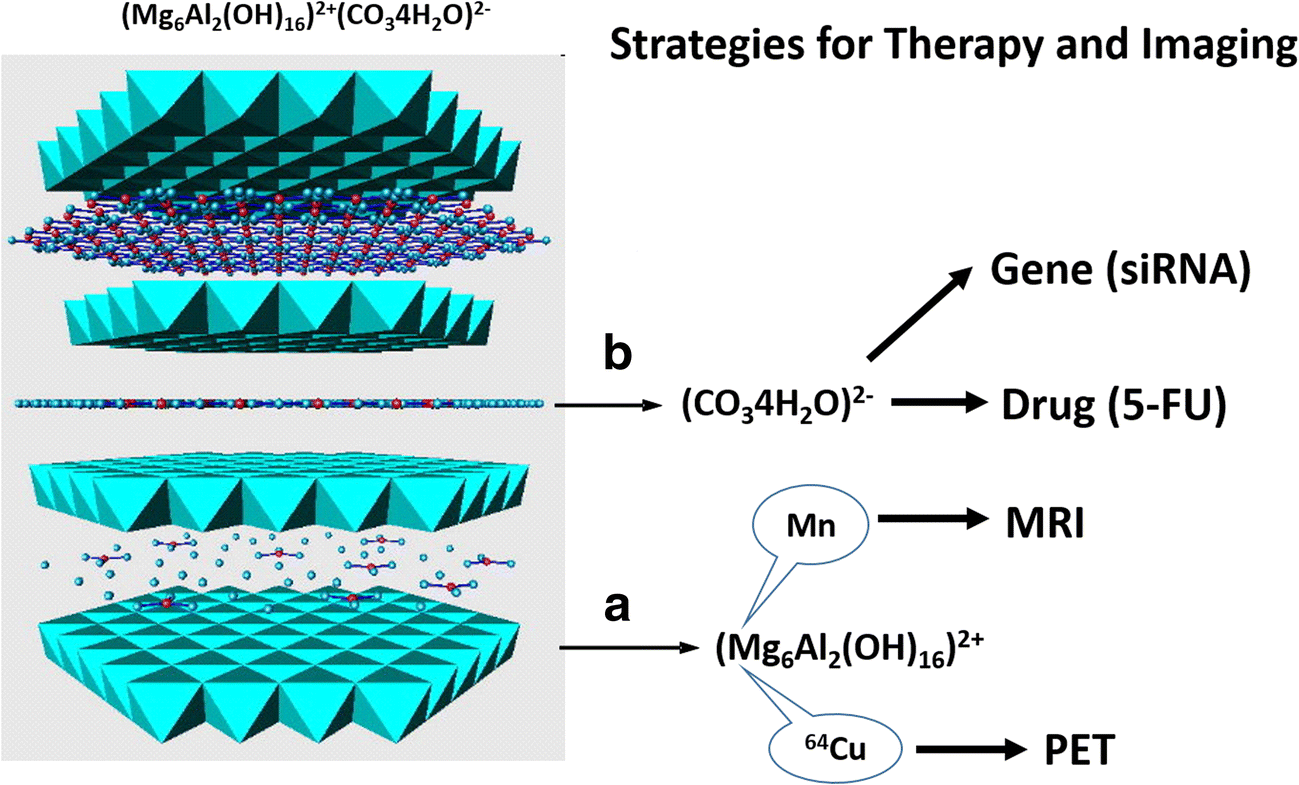
Recent engineering of LDH nanoparticles has increased the number of potential biomedical applications as reported here and elsewhere. Engineering of LDH nanoparticles involves two parts, as outlined in Fig. 1: the first is to substitute isomorphically the metal cation (Mg2+) in the layers by another functional metal cation, such as Mn, for magnetic resonance imaging (MRI) (Li et al. Reference Li, Gu, Kurniawan, Chen and Xu2017; Zuo et al., Reference Zuo, Chen, Li, Xu, Cooper, Gu and Xu2017) and 64Cu for positron emission tomography (PET) imaging (Shi et al., Reference Shi, Fliss, Gu, Zhu, Hong, Valdovinos, Hernandez, Goel, Luo, Chen, Barnhart, Nickles, Xu and Cai2015) (e.g. when studying tumors in mice). The second strategy is to co-load two or more therapeutic agents in the interlayer space and on the surface (e.g. 5-FU and siRNA) for co-delivery, which may produce a synergistic effect in the tumor treatment via two distinct apoptosis pathways (Chen et al. Reference Chen, Shao, Li, Xu and Gu2014; Li et al., Reference Li, Gu, Chen, Chen and Xu2014). Recent work has allowed LDH to be used for multimode imaging and synergetic therapy (Mei et al., Reference Mei, Ma, Bai, Zhang, Zhang, Liang, Wei, Evans and Duan2018a, Reference Mei, Wang, Yan, Hu, Liang, Yan, Wei, Evans and Duan2018b).
Strategies for tumor therapy and imaging based on MgAl-LDH physicochemical features: a Replacement of Mg with functional cations such as 64Cu and Mn for tumor PET and MR imaging, respectively; b Intercalation or adsorption of therapeutic agents such as 5-fluorouracil (5-FU) and siRNA for combined tumor chemotherapy
LDH-BASED IMAGING FOR TUMOR TISSUE
Replacement of Mg with Mn for MRI
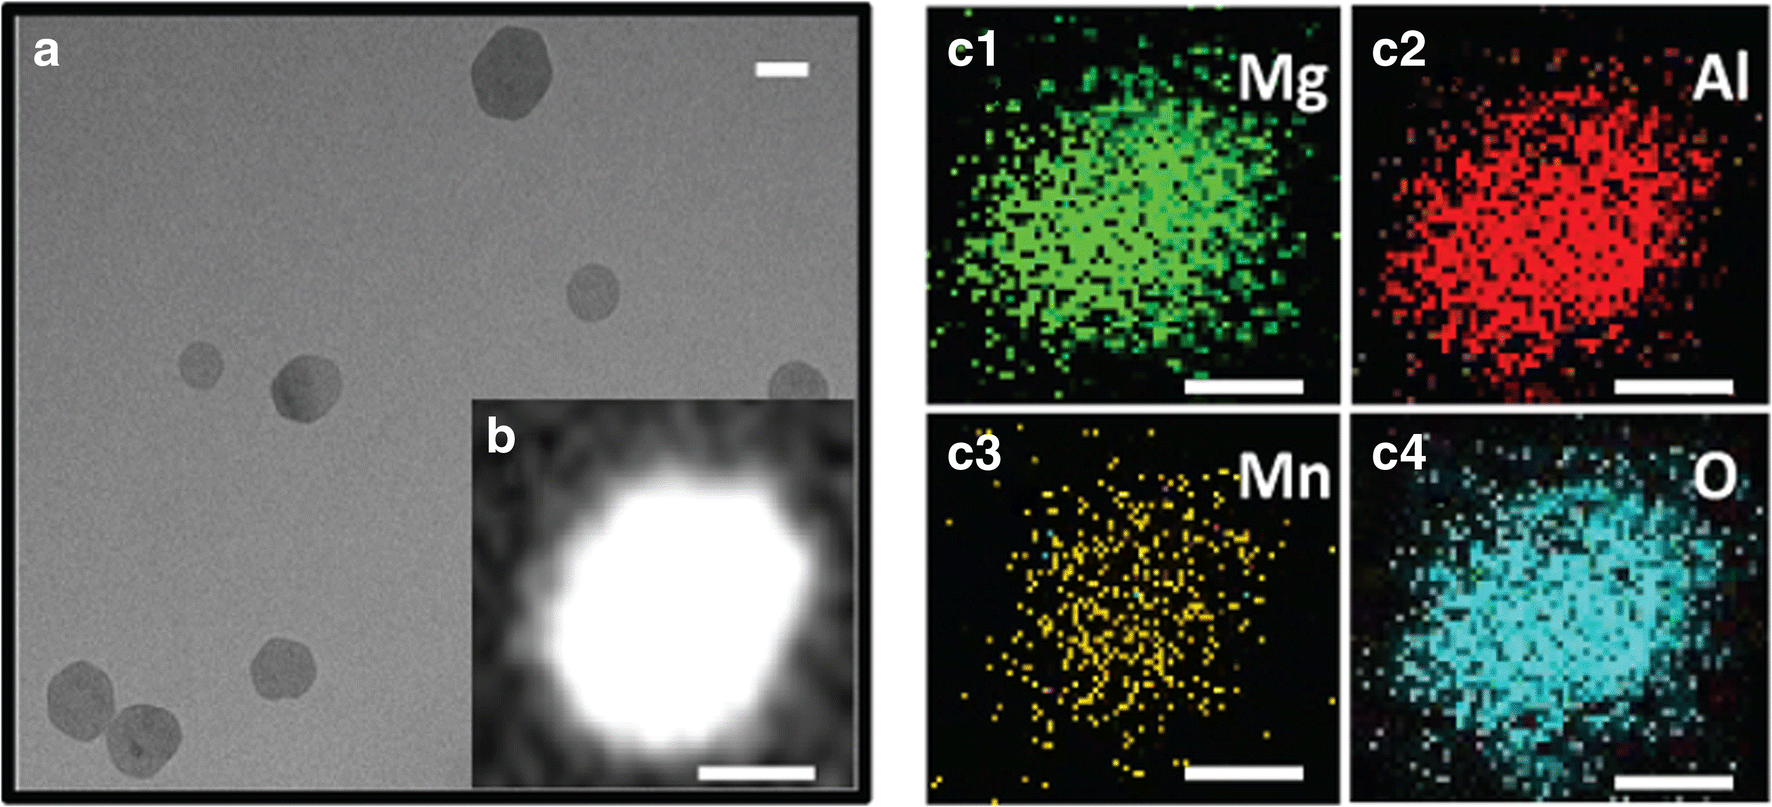
Mn-containing MgAl-LDH (Mn-LDH) nanoparticles with ultrasensitive pH response and high relaxivity (the degree to which the agent can enhance the longitudinal or transverse water relaxation rate constant) have been developed and applied recently for MRI in this group. The synthesis of Mn-LDH nanoparticles was conducted first by co-precipitation (Xu et al., Reference Xu, Stevenson, Lu and Lu2006a) to obtain a Mg3Al-LDH suspension and then by isomorphic substitution (Lee et al., Reference Lee, Jung, Kim and Ahn2014) of 0.8 of Mg2+ with Mn2+ ions (Mg2.2Mn0.8Al-LDH). As shown in Fig. 2a, as-prepared Mn-LDH nanoparticles had a plate-like morphology with lateral dimensions in the range 20–80 nm. Scanning transmission electron microscopy (STEM) (Fig. 2b) and elemental mapping images (Fig. 2c1–4) display a uniform and homogeneous distribution of Mg, Al, Mn, and O within the particle, confirming the uniform substitution of Mn for Mg ions through the “dissolution-deposition-diffusion” process (Xu & Lu, Reference Xu, Niebert, Porazik, Walker, Cooper, Middelberg, Gray, Bartlett and Lu2005). X-ray photoelectron spectroscopy (XPS) revealed that >85% of Mn ions were divalent. Mn-LDH nanoparticles were, thus, obtained with Mn ions evenly dispersed on the hexagonal-like host layers, and the valence state of the Mn ions was mostly unchanged.
a TEM image; b STEM image, and the corresponding element mapping of (c1) Mg, (c2) Al, (c3) Mn, and (c4) O of Mn-LDH nanoparticles. Scale bar: 20 nm. (Images reproduced with permission from Li et al. Reference Li, Gu, Kurniawan, Chen and Xu2017)

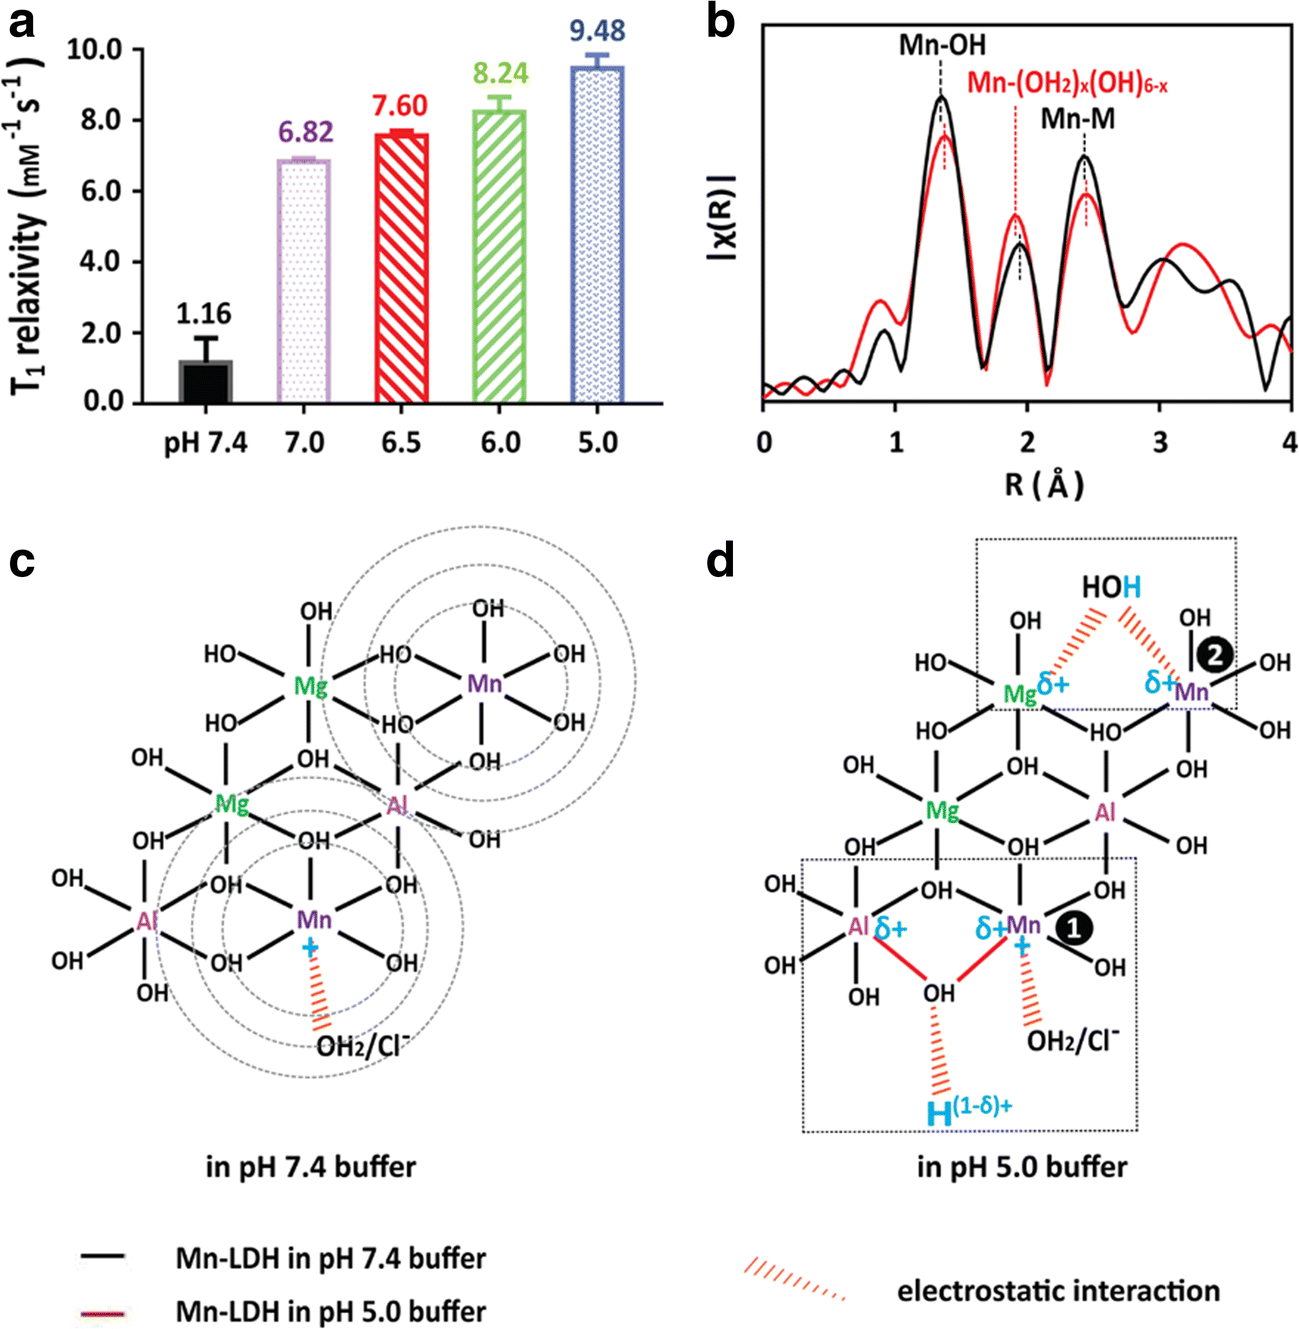
The in vitro T1-weighted relaxivity of Mn-LDH in buffer solutions (pH = 7.4, 7.0, 6.5, 6.0, and 5.0) was determined (Fig. 3a) to simulate the MRI capability of Mn-LDH NPs in normal body fluid (pH ≈ 7.4), in an acidic tumor microenvironment (pH ≈ 6.5–7.0), in the early endosome (pH ≈ 6.0), and in the late endosome/lysosome in cells (pH ≈ 5.0). Interestingly, the T1-weighted relaxivity (r1) increased significantly by reducing the pH value of the aqueous solution from 7.4, via 7.0, 6.5, and 6.0, to 5.0, being 1.16, 6.82, 7.60, 8.24, and 9.48 mM−1 s−1, respectively. This sharp change means that the relaxivity of Mn-LDH nanoparticles is very sensitive to the buffer pH around neutral condition. For example, the longitudinal relaxivity was increased by >6 times when the pH was changed from just 7.4 to 7.0 or 6.5. This ultrasensitivity to the environmental pH may be very useful in imaging tumor tissues where the weak acidity can be used as the efficient ‘activatable’ factor. By comparison, the relaxivity of Mn-LDH nanoparticles in pH 7.0–5.0 buffers is 2–3 times greater than Gd-DTPA (~3.4 mM−1 s−1) (Donahue et al., Reference Donahue, Burstein, Manning and Gray1994).
(a) Relaxivity (unit: mM−1 s−1) of Mn-LDH nanoparticles after co-incubation in buffer solutions with various pH at 37°C for 4 h. Error bar = standard deviation, n = 3; (b) EXAFS spectra of Mn-LDH soaked in pH 7.4 and 5.0 buffers, respectively. Schematic structure changes of Mn-LDH nanoparticles in a pH = 7.4 buffer (c), and in a pH 5.0 buffer (d). (Images reproduced with permission from Li et al. Reference Li, Ke, Huang, Ye and Huang2017)
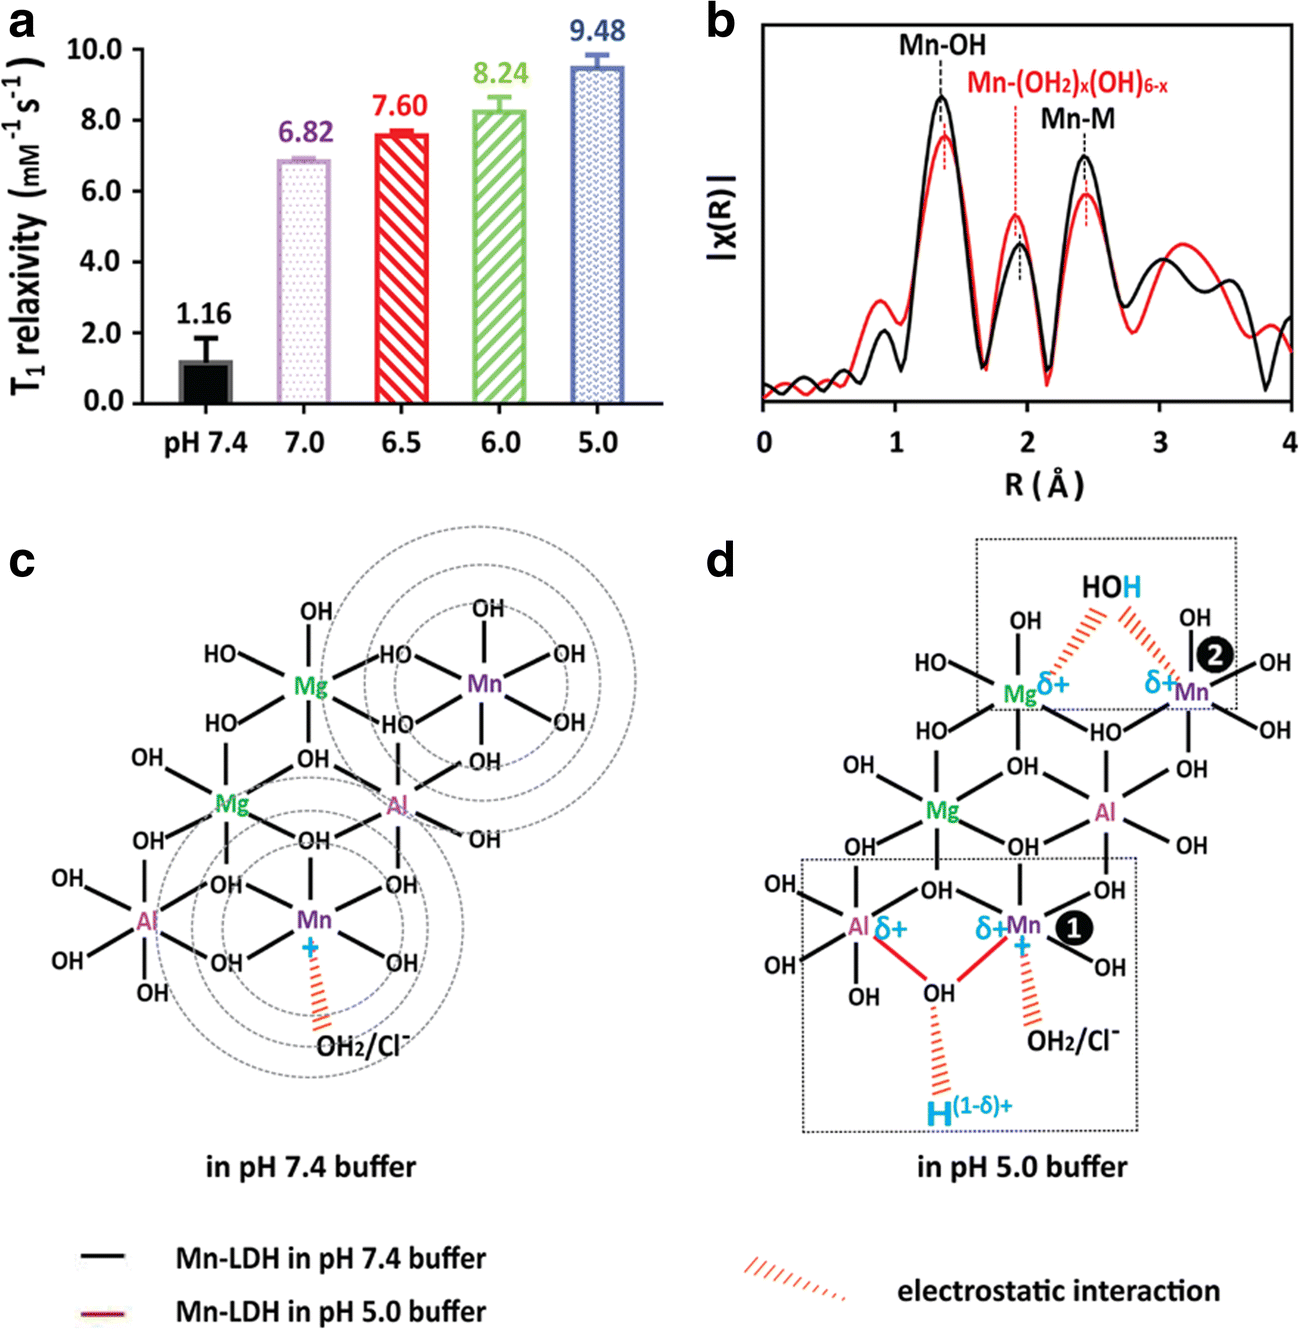
The large r1 value of Mn-LDH nanoparticles in pH 5.0–7.0 buffers can be attributed to the peculiar microstructure of Mn(II) on the LDH surface, as revealed by extended X-ray absorption fine structure (EXAFS). In general, protons in water molecules located in the first coordination sphere of paramagnetic Mn ions contribute mostly to the T1 relaxivity (Heffern et al., Reference Heffern, Matosziuk and Meade2014). As shown in Fig. 3b, the Mn···OH2 bond is reduced in a pH 5.0 buffer in comparison with that in a pH 7.4 buffer. This bond shrinking increases significantly the T1-MRI performance of Mn-LDH nanoparticles because T1 relaxivity is inversely proportional to R 6 (R is the Mn–proton distance) (Caravan et al., Reference Caravan, Farrar, Frullano and Uppal2009). The variation in Mn···(OH2) x coordination (the second peak in Fig. 3b) of Mn-LDH in the pH 5.0 buffer leads to the excellent T1-weighted MRI performance of these Mn-LDH nanoparticles in the acidic environment, which has been further demonstrated by in vivo MR imaging. Similarly, the Mn-coordinated water number is also increased in Mn-LDH in pH 5.0 buffer due to more protonation in comparison with that in the pH 7.4 buffer, which enhances linearly the r1 relaxivity in acidic solution.
The T1-MRI performance of Mn-LDH nanoparticles is further used for an in vivo tumor model. Mn-LDH nanoparticles were pre-coated with BSA to prevent aggregation in the physiological environment, as reported by Gu et al. (Reference Gu, Zuo, Li, Wu and Xu2015). The resultant BSA/Mn-LDH nanoparticles had an average diameter of ~68 nm and a zeta potential of +37.9 mV. The BSA coating did not affect the pH ultrasensitivity of Mn-LDH nanoparticles for MR imaging in the pH range 7.4–6.0.
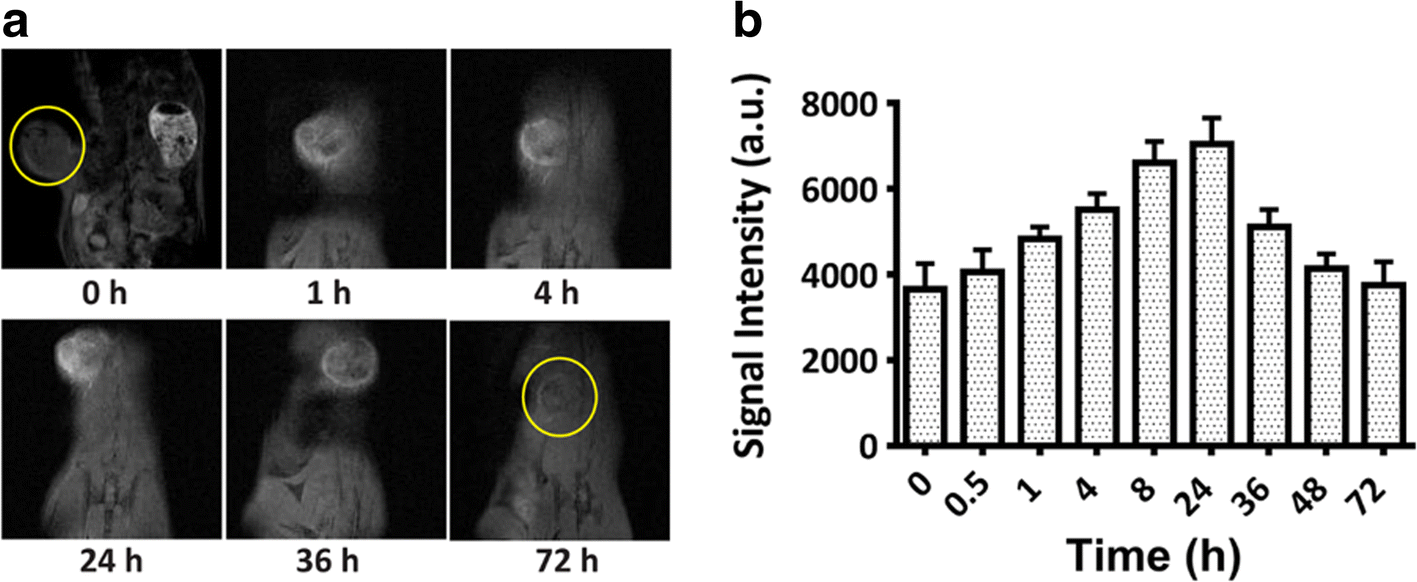
As shown in Fig. 4a, a remarkable T1-weighted signal was observed around the tumor tissue 0.5 h after the intravenous injection of BSA/Mn-LDH nanoparticles. This signal continued to increase in intensity for 24 h, but decreased gradually over the following 2 days (Fig. 4). The time course reveals that BSA/Mn-LDH nanoparticles were accumulated continuously around the tumor tissue, probably due to the ‘enhanced permeability and retention’ (EPR) effect. At the same time, accumulated LDH nanoparticles were metabolized or biodegraded (dissolution in the acidic tumor environment and digestion by tumor cells). Competition between accumulation and biodegradation of BSA/Mn-LDH nanoparticles around the tumor tissue thus explains the T1-MRI intensity variations. During the first 24 h post injection, Mn-LDH accumulation was predominant, increasing imaging intensity to reach its zenith at 24 h; afterwards, Mn-LDH biodegradation was quicker than its accumulation, decreasing gradually the imaging brightness until 72 h. This MR imaging profile of BSA/Mn-LDH nanoparticles may diagnose the tumor or other diseased tissues precisely where LDH nanoparticles can be accumulated.
In vivo MR imaging of BSA/Mn-LDH nanoparticles. A time-course (0, 1, 4, 24, 36, and 72 h) of the contrast enhancement in T1-weighted MRI of tumor (a) as well as the corresponding signal intensity variation (b) in the melanoma-tumor-bearing mouse after intravenous injection of BSA/Mn-LDH nanoparticles within 72 h. Error bar = standard deviation, n = 3. (Images reproduced with permission from Li et al. Reference Li, Gu, Kurniawan, Chen and Xu2017)
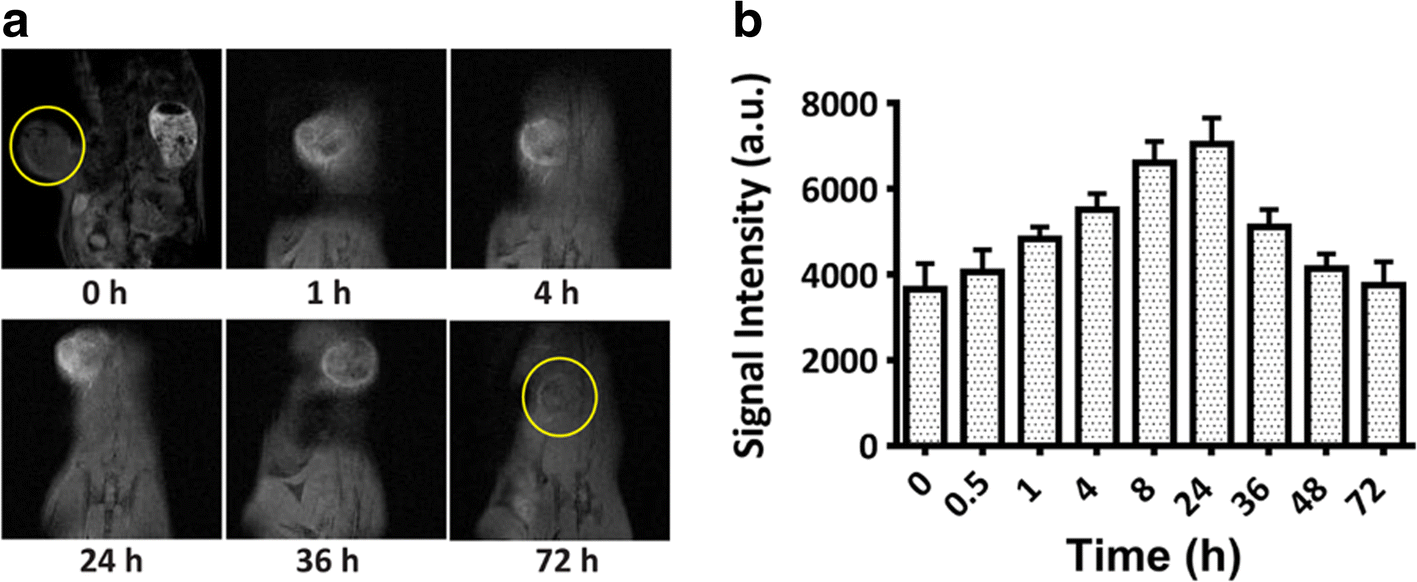
Interestingly, a stronger T1-MRI signal was recorded in the tumor compared to that in kidney and liver 24 h post injection, indicating that BSA/Mn-LDH nanoparticles were accumulated selectively in the tumor tissue due to the EPR effect, as supported quantitatively by the amount of Mn accumulated in the tumor tissue, liver, and kidney. Approximately 13.2 ng of Mn ions per mg of tumor, ~4.7 ng of Mn ions per mg of kidney, and ~3.1 ng of Mn ions per mg of liver were measured. Approximately 3.6% of the injected LDH dose was found to accumulate in the tumor. The effective accumulation of Mn-LDH nanoparticles in the tumor tissue is attributed mainly to the EPR effect. Presumably, the sheet-like morphology may also contribute significantly to this accumulation. Together with the pH-ultrasensitive changes in the tumor microenvironment, Mn-LDH nanoparticles are very promising as an MRI contrast agent for tumor diagnosis.
Replacement of Mg with 64Cu in LDH nanoparticles for PET imaging
BSA-coated Cu-MgAl-LDH (Cu-LDH-BSA) nanoparticles were prepared similarly, i.e. quick precipitation and subsequent hydrothermal treatment to make Mg2Al-CO3-LDH (Xu et al., Reference Xu, Stevenson, Lu and Lu2006a, Reference Xu, Stevenson, Lu, Lu, Bartlett and Gray2006b; Xu et al., Reference Xu, Jin, Liu, Hao and Lu2008a, Reference Xu, Niebert, Porazik, Walker, Cooper, Middelberg, Gray, Bartlett and Lu2008b), then coating with BSA, and finally, isomorphic substitution of a very small amount of Mg with 64Cu ions (Shi et al., Reference Shi, Fliss, Gu, Zhu, Hong, Valdovinos, Hernandez, Goel, Luo, Chen, Barnhart, Nickles, Xu and Cai2015). As-prepared Mg2Al-CO3-LDH nanoparticles had an average hydrodynamic diameter of 110 nm. After BSA coating, the average size of the LDH-BSA increased slightly to 130 nm. After the 64Cu isotope was mixed directly with LDH-BSA in a corresponding buffer (referred to as LDH-BSA; chelator-free labeling), the average particle size was said not to change significantly.
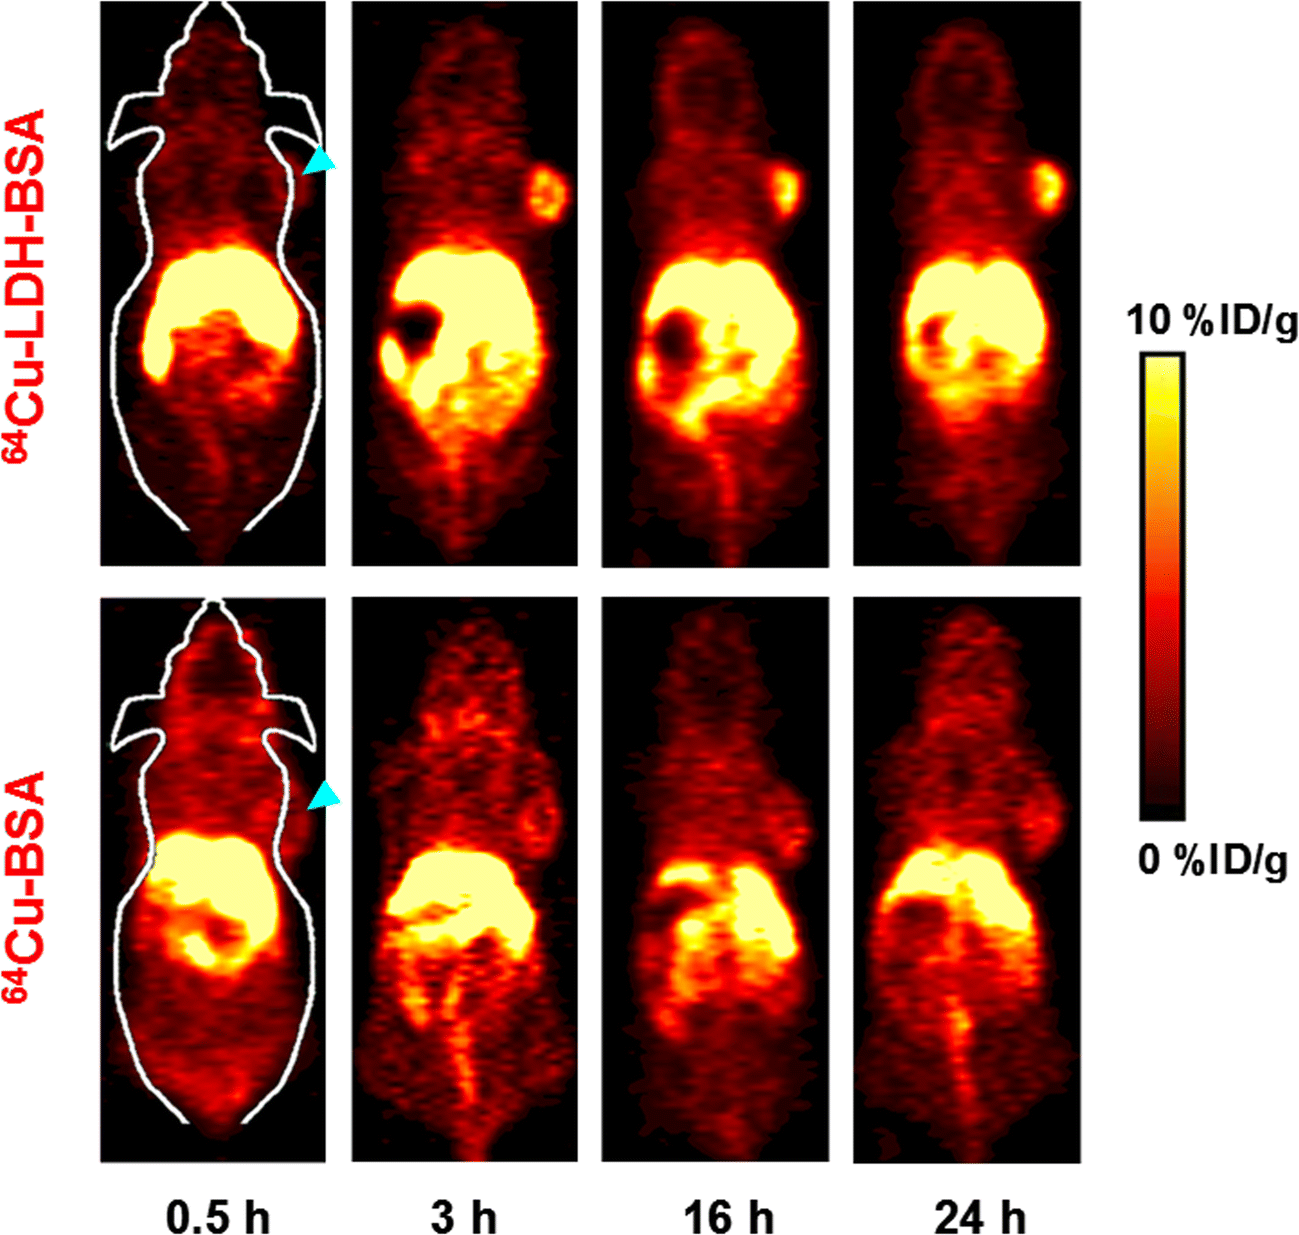
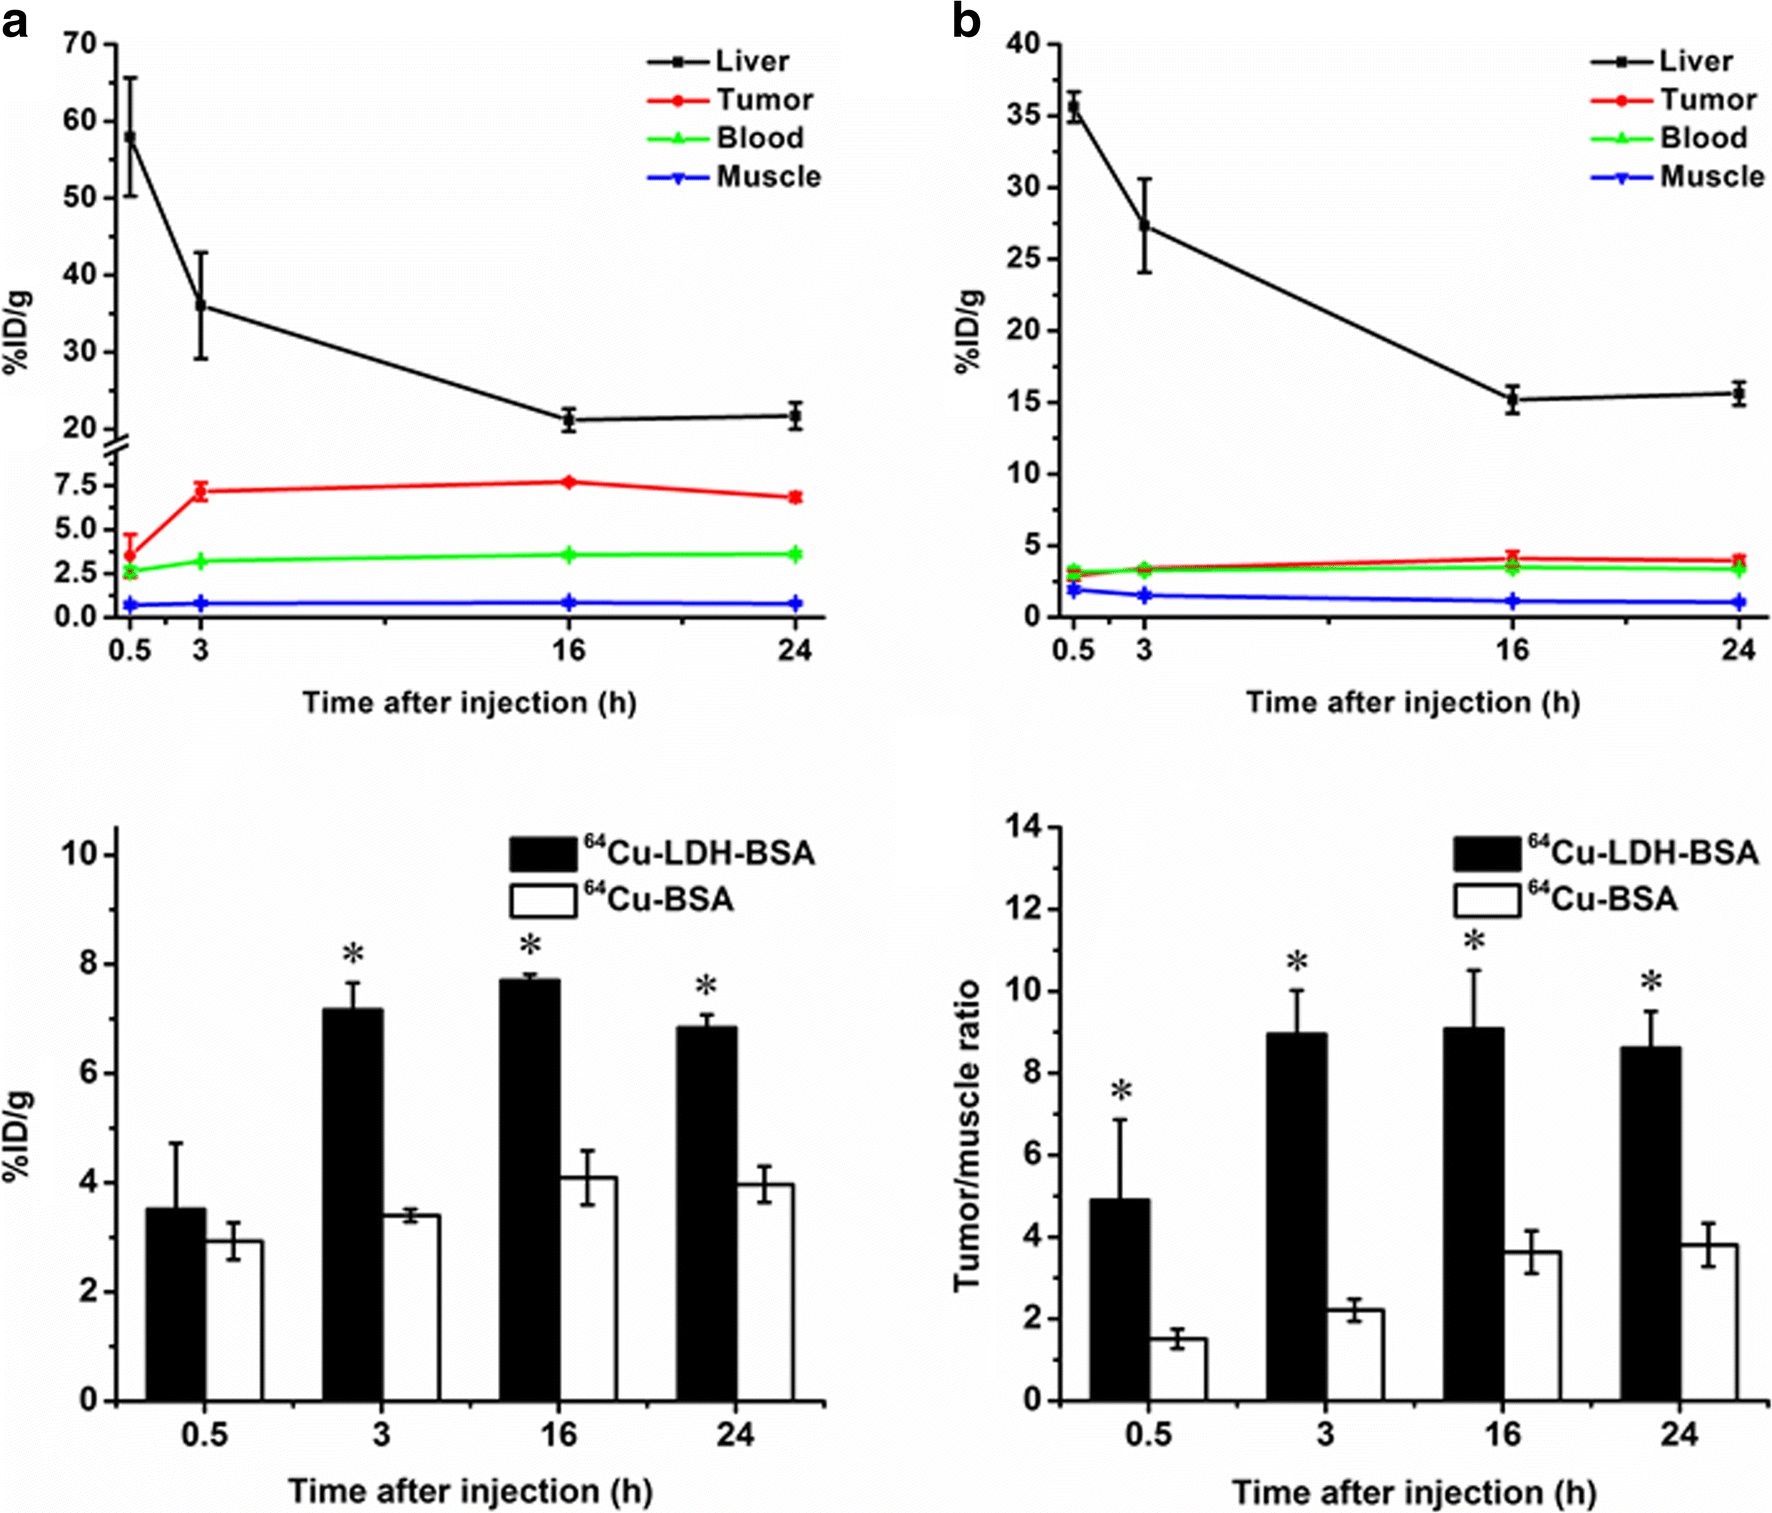
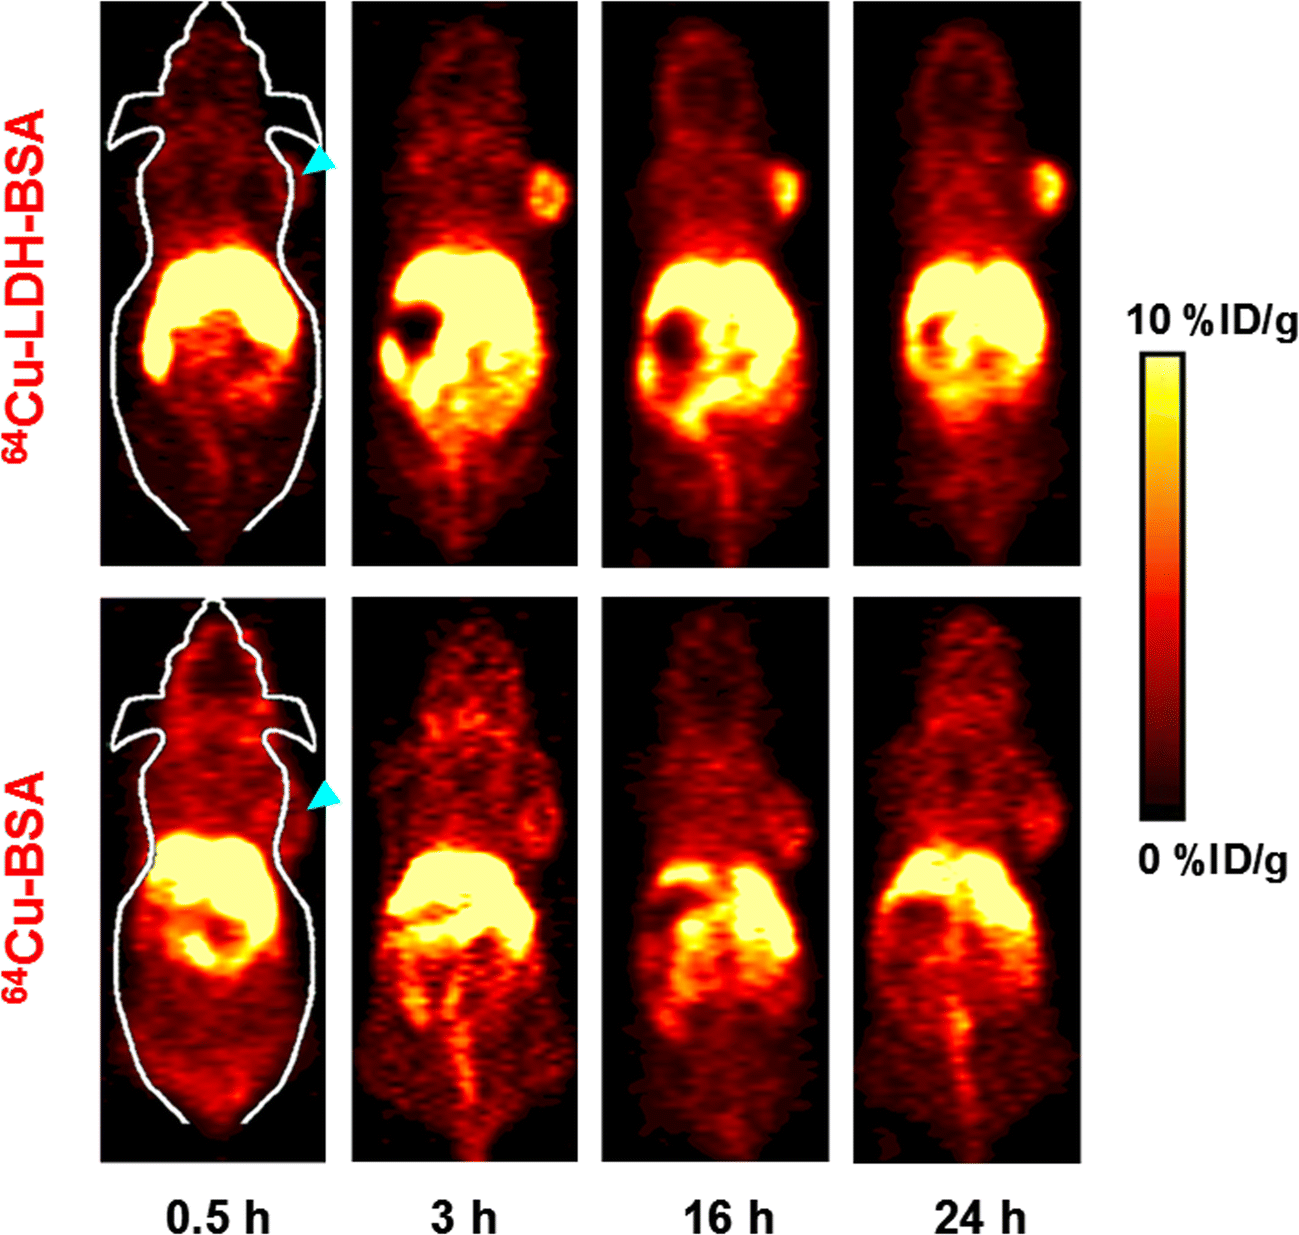
64Cu-LDH-BSA nanoparticles in suspension were injected intravenously into 4T1 tumor-bearing mice to examine their in vivo distribution profiles. PET imaging was performed at various time points (0.5, 3, 16, and 24 h post-injection) using a micro-PET/micro-CT Inveon rodent model scanner (Siemens, Suffolk, UK). The coronal PET images (Fig. 5) were treated for quantitative region-of-interest (ROI) analysis (Fig. 6). Prompt and persistent tumor accumulation was achieved via passive targeting, with the accumulated amount being 3.5 ± 1.2, 7.2 ± 0.5, 7.7 ± 0.1, and 6.8 ± 0.2% ID/g (injected dose per gram) at 0.5, 3, 16, and 24 h post injection, respectively. In contrast, retention in blood and muscle was much less at all time points (Fig. 6a). The tumor/muscle ratios of 4.9 ± 2.0, 8.9 ± 1.1, 9.1 ± 1.4, and 8.6 ± 0.9 were observed at 0.5, 3, 16, and 24 h post injection, respectively (Fig. 6d), suggesting excellent accumulation in the tumor. In comparison, the signal in liver peaked early and decreased quickly with time (Fig. 6a), indicating the hepatic clearance of 64Cu-LDH-BSA nanoparticles.
In vivo PET imaging. Serial coronal PET images at different time points post-injection of 64Cu-LDH-BSA and 64Cu-BSA were acquired in 4 T1 tumor-bearing mice. A strong signal in the tumor was observed for the mice injected with 64Cu-LDH-BSA. (Images reproduced with permission (Shi et al., Reference Shi, Fliss, Gu, Zhu, Hong, Valdovinos, Hernandez, Goel, Luo, Chen, Barnhart, Nickles, Xu and Cai2015))
Quantitative analysis of the PET data: (a) Time activity curves of the liver, 4 T1 tumor, blood, and muscle upon intravenous injection of 64Cu-LDH-BSA. (b) Time activity curves of the liver, 4 T1 tumor, blood, and muscle upon intravenous injection of 64Cu-BSA. (c) Comparison of tumor uptake at various time points post injection of 64Cu-LDH-BSA and 64Cu-BSA. The differences in terms of tumor uptake were statistically significant (P < 0.05) at all time points except 0.5 h. (d) Comparison of tumor/muscle ratio at various time points post injection of 64Cu-LDH-BSA and 64Cu-BSA. The differences in tumor/muscle ratio were statistically significant (P < 0.05) at all time points. All data represent three mice per group. (Images reproduced with permission, from Shi et al. Reference Shi, Fliss, Gu, Zhu, Hong, Valdovinos, Hernandez, Goel, Luo, Chen, Barnhart, Nickles, Xu and Cai2015)
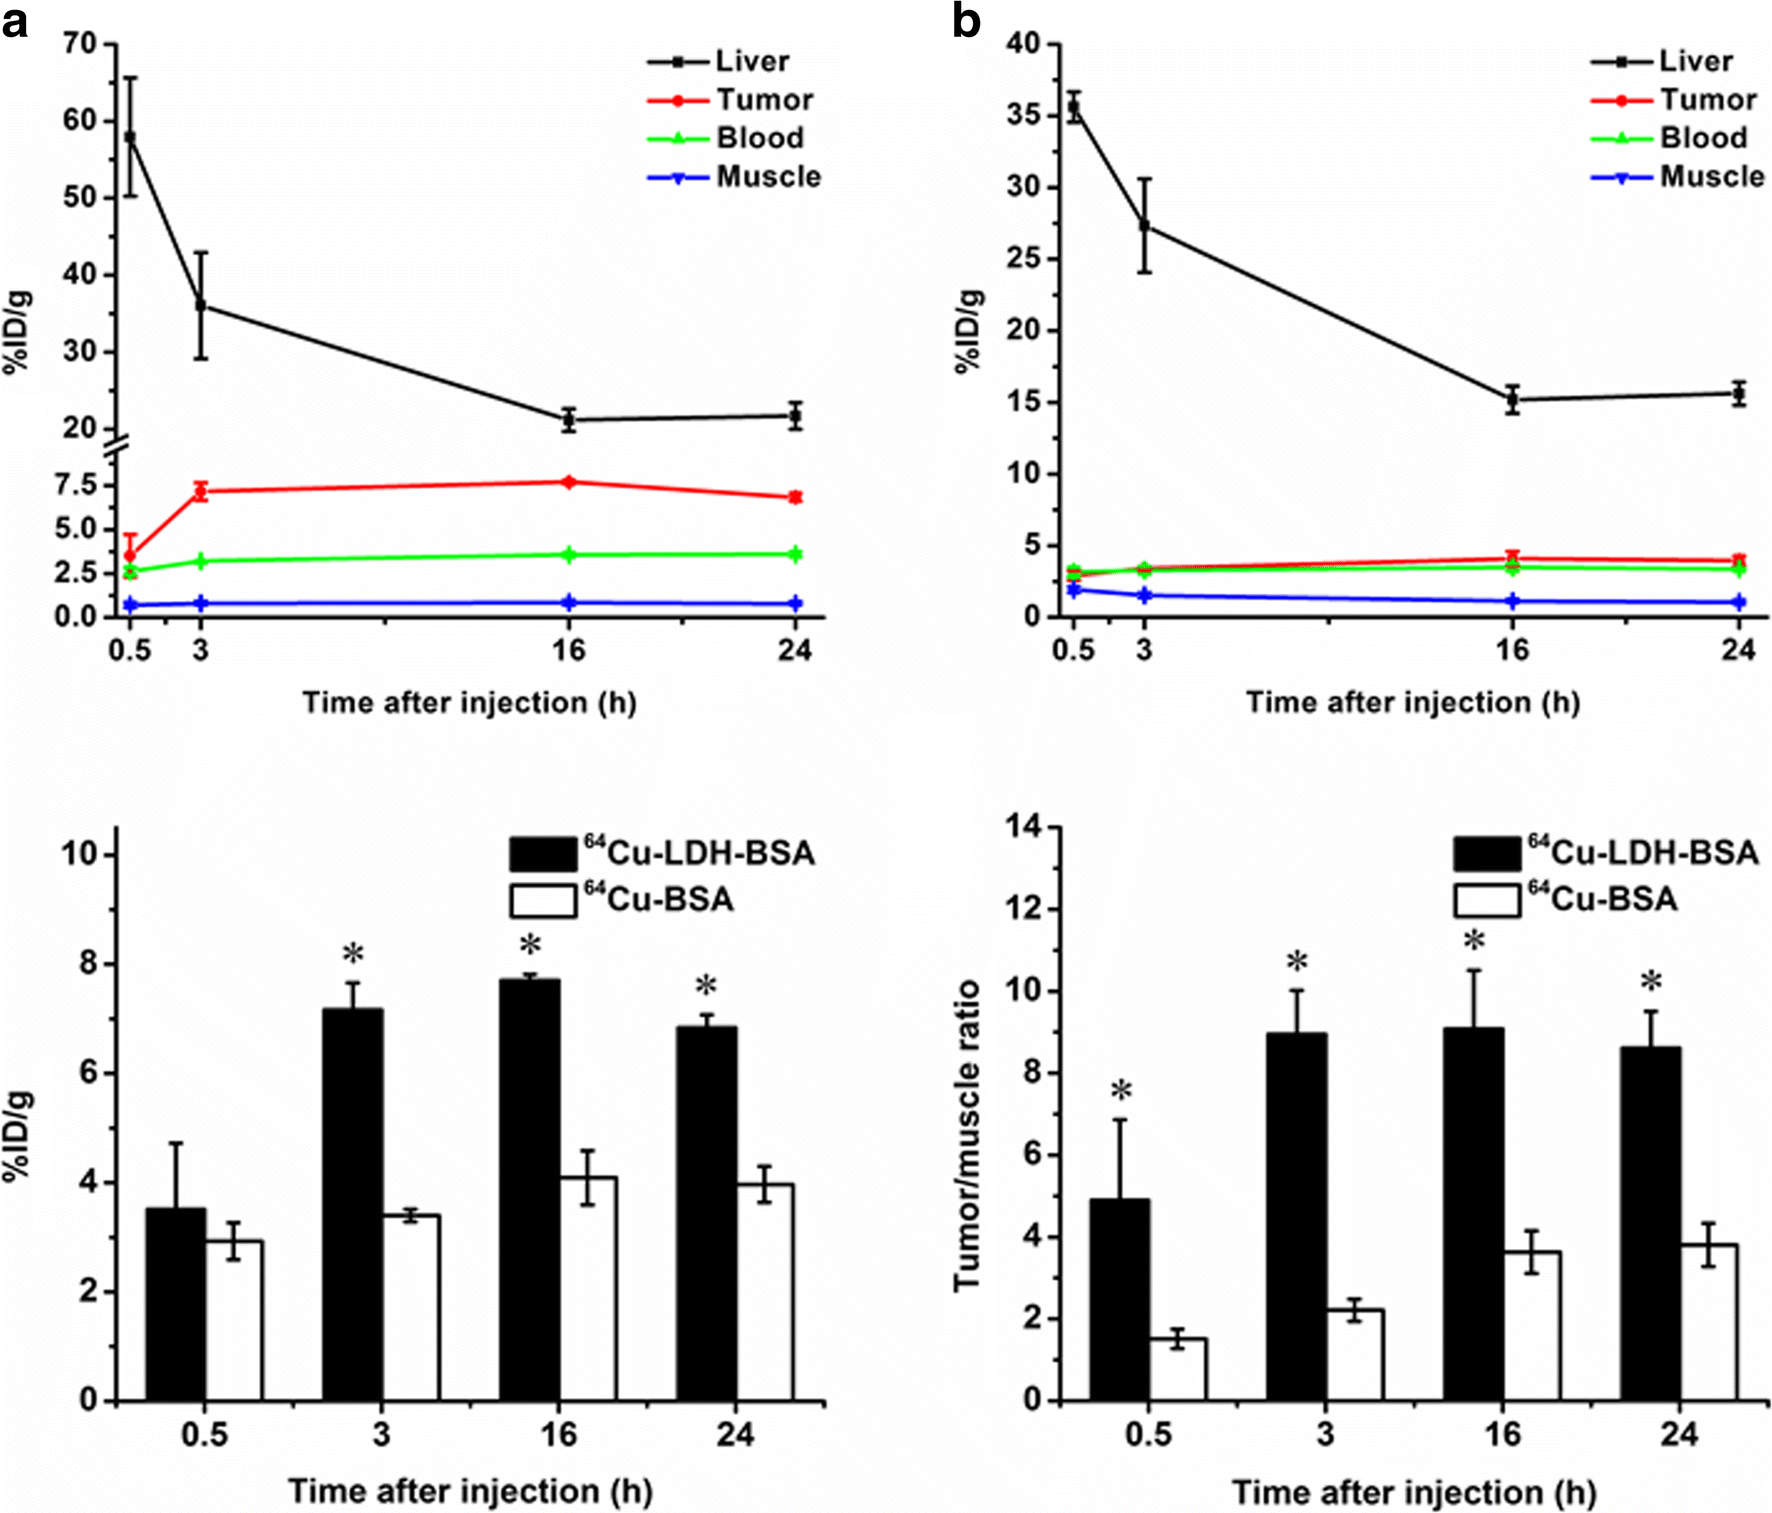
The PET imaging by intravenous injection of 64Cu-BSA further confirmed the imaging capacity of 64Cu-LDH-BSA for tumor tissues through the passive targeting pathway. As shown in Figs. 5 and 6, significantly less accumulation of molecule-based 64Cu-BSA in the tumors was observed, being relatively unchanged (2.9 ± 0.3, 3.4 ± 0.1, 4.1 ± 0.5, and 4.0 ± 0.3% ID/g at 0.5, 3, 16, and 24 h post injection). Moreover, the background signal in muscle was relatively stronger (1.9 ± 0.2, 1.5 ± 0.2, 1.1 ± 0.1, and 1.0 ± 0.1% ID/g at 0.5, 3, 16, and 24 h post injection, respectively; Fig. 6b), possibly due to the much smaller size of 64Cu-BSA compared with 64Cu-LDH-BSA. Both variations led to a poorer imaging contrast, i.e. smaller tumor/muscle ratio (1.5 ± 0.2, 2.2 ± 0.3, 3.6 ± 0.5 and 3.8 ± 0.5 at 0.5, 3, 16, and 24 h post injection, respectively; Fig. 6c). Taken together, with a prominent tumor accumulation and excellent imaging-contrast capability, 64Cu-LDH-BSA nanoparticles shows promise as a nanoplatform for in vivo tumor imaging and diagnosis.
COMBINATION THERAPY OF TUMOR CELLS
Many investigations have been carried out using LDH nanoparticles for the effective delivery of a single therapeutic substance, e.g. anti-cancer drugs MTX and 5-FU, the anti-restenotic drug heparin, and siRNA and DNA, have been summarized previously (e.g. Choy et al., Reference Choy, Jung, Oh, Park, Jeong, Kang and Han2004). A more recent strategy is to use LDH nanoparticles to co-load and co-deliver two therapeutic agents in order to synergize the treatment of diseases, such as cancer cells.
The first example is co-delivery of two therapeutic agents (5-FU and functional siRNA) which were co-loaded onto MgAl-LDH nanoparticles using a step-by-step method, as outlined in Fig. 7. First, an homogeneous MgAl-LDH nanoparticle (~100 nm wide) suspension was prepared using the co-precipitation and hydrothermal treatment method (Xu et al., Reference Xu, Stevenson, Lu and Lu2006a). Then, 5-FU was intercalated into the MgAl-LDH nanoparticles via the ion-exchange process. 5-FU/LDH hybrid nanoparticles had a similar particle-size distribution with 10% interlayer Cl− replaced with 5-FU. These hybrid nanoparticles were further loaded with functional siRNA (cell death siRNA) (siRNA-5-FU/LDH), with the average particle diameter unchanged. The value for the mass ratio of siRNA to 5-FU/LDH varied between 1:5 to 1:40, and almost all siRNA was loaded onto the 5-FU/LDH nanoparticle surface.
Schematic illustration for the step-by-step preparation of 5-FU/siRNA-LDH nanoparticles. (Image reproduced with permission, from Li et al. Reference Li, Gu, Chen, Chen and Xu2014)

Firstly, the cytotoxicity of MgAl-LDH nanoparticles for MCF-7 cells in the concentration range of 50–200 μg/mL was very limited as the cell viability was >90% following a 3-day incubation (Li et al., Reference Li, Gu, Chen, Chen and Xu2014). Thus, MgAl-LDH nanoparticles can be used safely as a drug- and gene-delivery system. The usual amount of LDH used is <50 μg/mL is the tests.
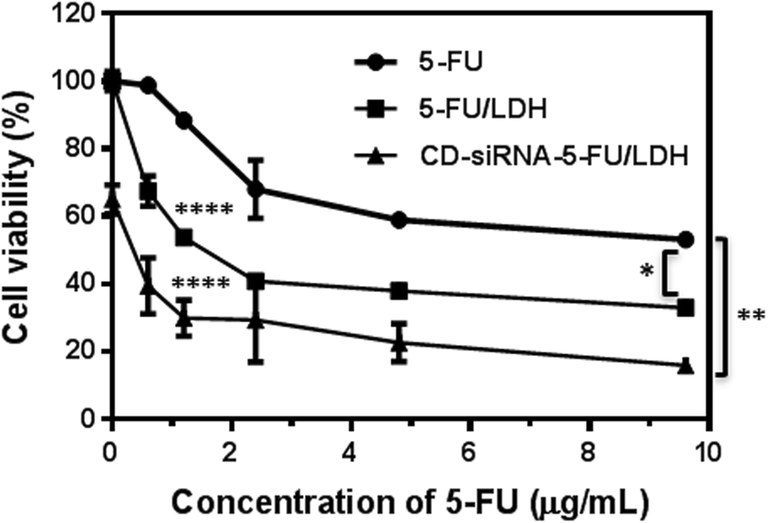
The cytotoxicity of 5-FU and 5-FU/LDH for MCF7 cells was examined (Li et al., Reference Li, Gu, Chen, Chen and Xu2014). As shown in Fig. 7, treatment with 5-FU reduced the cell viability in a dose-dependent manner and ~45% of MCF-7 cells was killed at 9.6 μg/mL, in agreement with previous reports (Chow & Loo, Reference Choy, Jung, Oh, Park, Jeong, Kang and Han2003; Chumakova et al., Reference Chumakova, Liopo, Mark and Esenaliev2006). Clearly, 5-FU/LDH nanoparticles caused considerably more MCF7 cell death and decreased the cell viability by 20–30% more at each concentration point in the range 0.6–9.6 μg/mL, compared with free 5-FU. This enhancement reflects the more efficient cellular uptake of 5-FU via LDH nanoparticles compared to free 5-FU (Choi et al., Reference Choy, Jung, Oh, Park, Jeong, Kang and Han2008), as reported for the cellular uptake of negatively charged FITC (fluorescein isothiocyanate) and dsDNA (double stranded DNA) (Xu et al., Reference Xu, Niebert, Porazik, Walker, Cooper, Middelberg, Gray, Bartlett and Lu2008b).
Treatment with functional cell death siRNA (CD-siRNA) did not just cause obvious cell death, even at a concentration of 80 nM in the medium, mainly because the negatively charged siRNA cannot be taken up easily by cells. In contrast, when CD-siRNA was loaded onto LDH, ~35% of MCF-7 cells were killed at 40 nM of siRNA in siRNA/LDH nanoparticle form without 5-FU (Fig. 8). The enhanced cytotoxicity further indicated the facilitation of the cellular uptake of negatively charged therapeutics (such as 5-FU and siRNA) via LDH nanoparticles.
MTT assay analysis of effects of treatments with 5-FU, 5-FU(10)/LDH, DC-siRNA/LDH, and CD-siRNA-5-FU/LDH on the viability of MCF-7 cells at the 5-FU concentration of 0–9.6 µg/mL and the CD-siRNA concentration at 40 nM in all relevant treatments for 72 h at 37°C. Data represent mean ±SD (n=5). *: p < 0.05; **: p < 0.01; **** p < 0.0001; all vs. 5-FU treatment. (Image reproduced, with permission, from Li et al., Reference Li, Gu, Chen, Chen and Xu2014)

Remarkably, co-delivery of CD-siRNA and 5-FU by MgAl-LDH nanoparticles further decreased the cell viability, particularly at the lower 5-FU concentration range (Fig. 8). For example, treatment with CD-siRNA-5-FU/LDH nanoparticles (1.2 μg/mL of 5-FU and 40 nM of siRNA) killed ~70% of MCF-7 cells, while a single treatment with either 5-FU/LDH or siRNA/LDH at the same concentration of 5-FU or siRNA only resulted in 46% or 34% of cell death, respectively. Thus, co-delivery of CD-siRNA and 5-FU with MgAl-LDH nanoparticles suppressed MCF-7 cell growth to a significant extent, probably in a synergistic manner. Further analysis shows that the level of anti-apoptosis protein Bcl-2 was reduced significantly after combination treatment with CD siRNA-5-FU/LDH nanoparticles. The over-expression of Bcl-2 is well known as one of the major mechanisms by which various cancer cells acquire resistance to apoptosis. Thus, the reduction of Bcl-2 expression, induced by siRNA-5-FU/LDH, leads to more cell death.
A co-delivery strategy using MgAl-LDH nanoparticles has been found to be effective for other cancer cell lines, e.g. U2OS and HCT-116. The combination treatment of U2OS or HCT-116 cells with CD-siRNA and 5-FU co-delivered by MgAl-LDH resulted in significant suppression of cell growth compared to a treatment with either CD-siRNA/LDH or 5-FU/LDH alone.
Another example is the use of 5-FU/LDH nanoparticles to treat HCT-116 cells in combination with free BEZ-235, a common drug for treatment of colon cancer. BEZ-235 cannot be loaded onto the LDH nanoparticles, so this combination treatment consisted of 5-FU/LDH nanoparticles and the molecular drug BEZ-235 only.
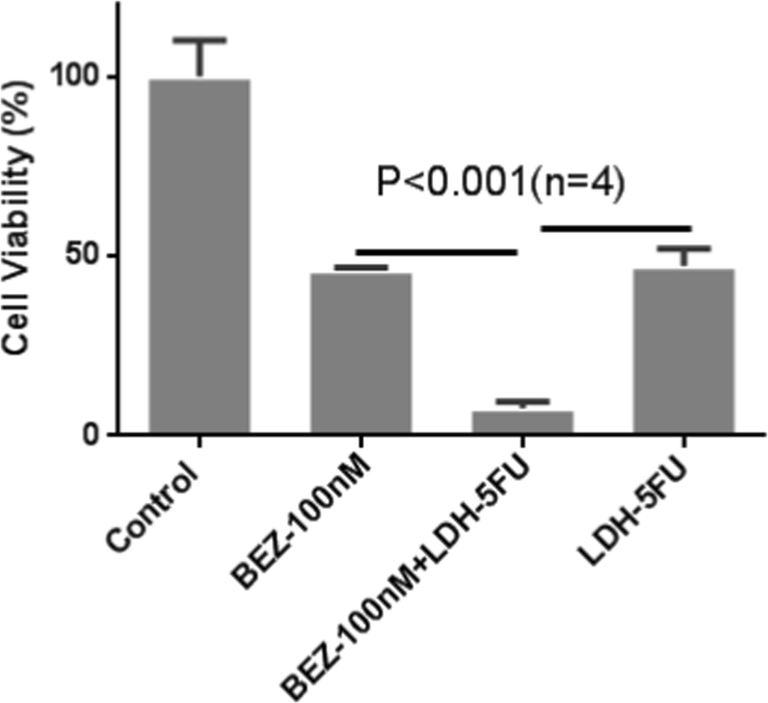
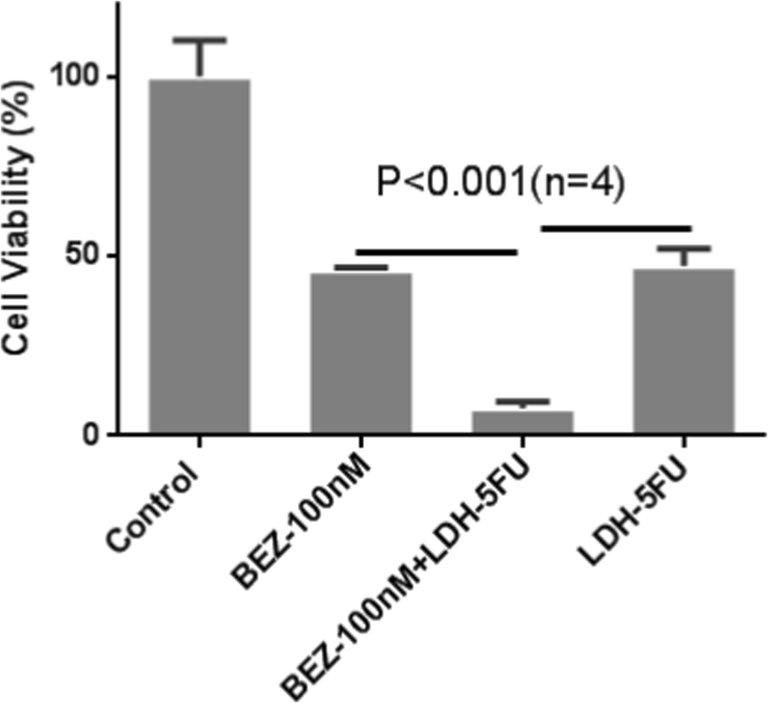
The growth of the colon cancer cells (HCT-116) was inhibited either by 5-FU/LDH nanoparticles or BEZ-235 in a dose-dependent manner (Chen, Cooper, et al., Reference Chen, Cooper, Zhou, Bartlett and Xu2013; Chen, Yee, et al., Reference Chen, Yee, Gong, Zhang and Xu2013). The half-maximal inhibitory concentration (IC50) was ~100 nM for BEZ-235 and 6 μg/mL for 5-FU in LDH-5-FU nanoparticles. Combined use of BEZ-235 and LDH-5-FU nanoparticles at both IC50 concentrations resulted in reduction of cell viability to only 8% (Fig. 9). The cell survival rate was significantly less than their linear combination effect (50% × 50% = 25%), indicating their synergistic effect (Ito et al., Reference Ito, Fujioka, Yoshida, Wakamatsu, Ito, Yamashita, Jimbow and Honda2007).
Combination treatment of colon cancer cells, HCT-116, with BEZ-235 and LDH-5-FU at [BEZ-235] = 100 nM and [5-FU] = 6 μg/mL in LDH-5-FU nanoparticles for 24 h at 37°C. Figure is reproduced, with permission, from Chen et al. Reference Chen, Shao, Li, Xu and Gu2014)
5-FU is a common chemotherapeutic agent used in treatment of colon cancer, and is a suicide inhibitor of thymidylate synthase, an enzyme necessary for DNA replication (Copur et al., Reference Copur, Aiba, Drake, Allegra and Chu1995; Johnston et al., Reference Johnston, Lenz, Leichman, Danenberg, Allegra, Danenberg and Leichman1995). The rationale for applying 5-FU and the PI3K/Akt inhibitor BEZ-235 is based on its effective inhibition of the pathway for colon-cancer treatment (Chen, Reference Chen2011; Manara et al., Reference Manara, Nicoletti, Zambelli, Ventura, Guerzoni, Landuzzi, Lollini, Maira, García-Echeverría, Mercuri, Picci and Scotlandi2010; Wu & Hu, Reference Wu and Hu2010). Inhibition of the pathway increases the colon cancer cell sensitivity to 5-FU. This is why dual inhibitor BEZ-235 for the PI3K/Akt/mTOR pathway sensitizes HCT-116 cells to LDH-packed 5-FU treatment.
CONCLUSIONS AND EXPERT OPINIONS
Incorporating functional metal cations into the hydroxide layers enables the LDH nanoparticles to be used for efficient imaging of tumor tissue. The signal-change profile in the MRI and PET images reveals clearly that LDH nanoparticles accumulate in the tumor tissue with the maximum level at 24 h post-injection. LDH nanoparticles are able to co-load and co-deliver two therapeutic agents, which inhibit the tumor-cell growth much more efficiently in a synergistic manner. These results show that the LDH nanoparticles can be a simple yet effective theranostic agent.
Incorporation of other functional metal cations, such as Cu, Fe, and Gd, in the hydroxide layer may be possible to make functional LDH nanoparticles for use as pH-sensitive imaging agents. These metal cations may also function as an agent for photothermal therapy. In particular, if the functional metal cations are incorporated into the LDH layers that are fully delaminated, the delivery and imaging capability and the pH sensitivity may be enhanced significantly, as reported by Mei et al. (Reference Mei, Ma, Bai, Zhang, Zhang, Liang, Wei, Evans and Duan2018a, Reference Mei, Wang, Yan, Hu, Liang, Yan, Wei, Evans and Duan2018b). Predictably, LDH nanoparticles will be tested for co-delivery of two or more negatively charged anti-tumor therapeutic agents for efficient inhibition of tumor-cell growth in animal models. A more ambitious prediction is to combine the imaging capability and therapeutic efficacy, together with the efficient passive targeting of plate-like LDH nanoparticles for tumor tissue, to allow for simultaneous imaging and treatment of the tumor in vivo.
ACKNOWLEDGMENTS
This work was supported financially by an Australian Research Council (ARC) grant (DP170104643) and the Australian Government Research Training Program Scholarship (RTP). The authors acknowledge the facilities and the assistance of Queensland Node of the Australian National Fabrication Facility (ANFF-Q), the University of Queensland.