


Since scholars first observed the strong incentives of legislators to build a “personal vote” by providing pork or performing constituency services rather than broad public goods, researchers have focused on institutional constraints, such as electoral rules, to understand why pork barrel activities vary across legislators and countries.Footnote 1 However, legislator incentives to serve narrow constituencies vary significantly, even when institutions are held constant. Our research concludes that voter attachment to political parties plays an important role in explaining this variation.
Much of the literature takes as a point of departure the incentives of political parties to curb legislator efforts to build personal constituencies, but does not directly examine party influence. Instead, the theoretical and empirical focus is on how political and electoral institutions affect the relative bargaining strength of parties and legislators.Footnote 2 We show that political party characteristics, independent of the institutional environment in which the parties compete, explain differences across legislators in pursuing pork.Footnote 3
In particular, our analysis is the first to show that voter attachment to political parties curbs legislator incentives to provide pork to their constituents, even in a setting where legislators operate within identical institutions. Voter attachment influences legislator effort to build personal constituencies in several ways. Their common thread is that the more important parties are to voters, the more difficult it is to sway voters’ electoral choices with constituency service and the easier it is for party leaders to favor candidates who advance party goals, even if the candidates are less effective at providing constituency service.
Our tests are based on data from a unique local infrastructure program in India, a constituency development fund (CDF). This is a specific type of public spending program that India, Kenya, Pakistan, the Philippines, and other developing countries have adopted. CDFs allocate budgetary resources directly to individual legislators to spend on public works in their constituencies. The Indian CDF is called the Member of Parliament Local Area Development Scheme (MPLADS). Allocations made under this program depend almost entirely on individual legislator effort and not on other institutional or political influences. In contrast, previous research examining legislator incentives to build personal constituencies has had to rely on legislative outcomes, such as total pork barrel spending, which are the product of individual legislator effort, but also of many other institutional and political influences.
Using a measure of voter attachment based on whether constituencies are party strongholds or not, we find robust evidence that legislators substantially reduce effort to provide public works to their constituents when their constituency is a party stronghold. This directly demonstrates that voter attachment to parties reduces legislator incentives to cultivate a personal vote. In the presence of strong parties, even legislators in single-member constituencies with strong institutional incentives to attract a personal vote, nevertheless, often “pass on pork.”
The next section of the article describes the specific CDF program in India and explains why disbursements under the program should accurately represent legislator effort on behalf of their local constituency. Section 3 lists the conditions under which legislators have weak incentives to exert such effort, yielding tests for the influence of political parties. We then perform these tests using available data on spending under the CDF program. Section 4 describes the data and specifications we use to examine cross-constituency variation in spending from 1999 onward, and Sections 5 and 6 present the main results and a discussion of robustness. Section 7 concludes by describing the implications of the analysis for the spread of CDF schemes and directions for future research.
MEASURING CONSTITUENCY SERVICE: THE MPLADS PROGRAM
Because legislator effort is not directly observable, scholars use various proxies to identify the effort of legislators to direct benefits to their districts. None of these measures comes as close as the MPLADS data to meeting the two conditions of the ideal proxy: that the measure be uniquely attributed to the legislator's effort, and that it be associated with benefits that flow uniquely to the legislator's constituents.
For example, Heitshusen, Young, and Wood (Reference Heitshusen, Young and Wood2005) analyze determinants of legislators’ subjective assessments of their own priorities for constituency service; these need not be strongly correlated with actual provision of benefits to constituents or with actual effort exerted by legislators. Stratmann and Baur (Reference Stratmann and Baur2002) examine committee membership of legislators and characterize some committees as better enabling legislators to provide geographically targeted benefits. Shiller (Reference Shiller1995) and Wawro (Reference Wawro2002) consider the number and relevance of bills that American legislators sponsor. Padro’ i Miguel and Snyder (Reference Padro’ i Miguel and Snyder2004) rely on subjective assessments of legislator performance by third parties (e.g., journalists). Committee membership, the number of bills introduced, and subjective evaluations are all useful measures of legislator activity, but unlike MPLADS they do not directly identify the beneficiaries or the benefits of legislator effort.
Many studies use correlations between legislator voting behavior and own-constituency spending as evidence of legislator incentives for pork barrel spending (e.g., Ames Reference Ames1995; Baqir Reference Baqir2002; Knight Reference Knight2004). In the apparently most straightforward case, omnibus pork barrel legislation with constituency-specific benefits in a country with single-member electoral districts, benefits can be precisely measured. However, a wide array of unobserved factors makes it difficult to attribute differences in benefits to the actions of an individual legislator. For example, apparent budget shortfalls to a constituency in one piece of legislation may have been compensated in other, unobserved legislation. Unobserved factors also influence executive implementation of legislative priorities.
The design of the MPLADS program in India fortuitously avoids the shortcomings of other measures of legislator effort. The scheme was inaugurated in December 1993 by a dominant national party, the Congress Party. It allocated 10 million rupees annually (about $250,000) to each single-member parliamentary constituency for use on local public works recommended by the member of Parliament (MP). In fiscal year 1998, the Bharatiya Janata Party (BJP)–controlled national government doubled the annual entitlement of each constituency to 20 million rupees.Footnote 4 Unspent money accumulates over time, such that when an MP leaves office, the unspent balance remains at the disposal of the successor MP. By March 2004, the end of fiscal year 2003 in India, each parliamentary constituency had thus been entitled to spend 165 million rupees on local public works over the preceding 10 years.Footnote 5
The MPLADS program is unique in the degree to which it can isolate the contribution of a legislator's own efforts to constituency-specific benefits. First, the amounts available to spend are independent of legislator effort and are identical across legislators—in other measures of legislator effort, the effort that legislators “could” have undertaken is generally unobserved. Second, spending on public works under the program must be initiated by the legislator, acting alone, and is identified with the legislator's name through information placards located at the project site. Third, unlike other public works legislation in India, the MPLADS program allows national legislators to take credit for local public works.Footnote 6 Fourth, successful initiation of MPLADS projects by legislators requires substantial effort on their part.Footnote 7 Legislators must identify multiple small or mid-size projects because of size limits on any one project; those projects must conform to project implementation guidelines. They also need to pursue local bureaucrats to make sure implementation proceeds smoothly.
For example, a study of MPLADS undertaken by the Planning Commission of India (2001) reports that an MP from the state of Kerala recommended construction of additional classrooms for a rural high school on November 11, 1996. The concerned district collector (DC) took 38 days to review and forward this proposal for estimate preparation to the relevant block development officer (BDO). The BDO took 46 days to prepare the estimate and forward it to the District Rural Development Agency (DRDA) for approval. The DRDA provided its approval after 130 days. It then took the DC 250 days to provide formal administrative sanction to the work. The Block Level Beneficiary Committee that had to execute the work (because the guidelines prohibit using professional contractors for MPLADS works) was constituted 220 days after the DC had sanctioned the work, by which time they declared the work could not be undertaken because the funds allotted were insufficient.Footnote 8 The MPLADS audit conducted by the comptroller and auditor general (CAG), covering the period 1997 to 2000, showed that only 40% of projects recommended by MPs were subsequently sanctioned by DCs, taken up by implementing agencies, and completed.Footnote 9
The final piece of evidence that legislator disbursements from the program require effort is that disbursements were very low until the program was widely publicized, raising the political costs of not disbursing. If disbursement entailed no effort, the political costs of not disbursing would be irrelevant.
In fact, at its outset, MPLADS was almost unknown. It was introduced without parliamentary debate, as part of a larger effort of the government to expand its discretionary spending fund (its Contingency Fund; Times of India Reference Besley and Burgess1997). Only legislators from the communist parties of the Left Front, a coalition of strong parties dominating the state of West Bengal, commented on the program at the time of its initiation, objecting to it on the grounds that MPLADS would be used by national parties to encroach on the policy domain of lower tier governments (Uniyal Reference Betancourt and Gleason1994).Footnote 10
Not surprisingly, a search on the media database News Plus/Factiva for newspaper coverage of the MPLADS program yields only six articles in the 4.5-year period between October 1993, just before MPLADS was introduced in the Parliament, and June 1998. Only one article, written in February 1994, discussed the program itself in any significant detail, with the others mentioning it only in passing as part of other stories. This single article was published only in the Inter Press Service Global Information Network rather than in a leading newspaper. In sum, the program was not widely politically salient for the first years after its initiation.
During this period of low voter information about the program, between the time of the initiation of the MPLADS program in December 1993 and 1999, MPs left most of their allocation unused. MPLADS disbursements in the average and median districts amounted to approximately 31 million rupees, out of a total allocation of 85 million, or only 36% of the available funds.Footnote 11 The highest-ranking district in utilization spent 78%, whereas the second highest ranked district spent only 57%.
The scenario changed suddenly in 1999 after the CAG of India published a pilot audit of the MPLADS program in a few states (Government of India Reference Ashworth1998). The CAG report revealed both lack of utilization of funds and some inconsistencies in the way funds were used. It concluded that guidelines needed to be revised for “proper implementation” and prevention of funds misuse. These findings fed a critical—and newsworthy—view of politician behavior. A search on News Plus/Factiva for the period July 1998 to December 1999 yields 60 articles: 10 times as many articles were written in the 1.5 years following the CAG report than in the 4.5 years following the introduction of the program. Most of the articles were published in leading newspapers, focused on the issues raised in the CAG report, and made legislator accountability the key story. In response to the CAG report and possibly to the media coverage as well, the BJP-led government in 1999 instituted more stringent program implementation guidelines, including provisions for review and scrutiny by ministry authorities if funds are severely under used (Hindu Business Line Reference Ashworth and Bueno de Mesquita1999).
The publicity surrounding MPLADS, triggered by the CAG audit, significantly raised the political salience of MPLADS disbursements. The national elections of December 1999 ushered in a new cohort of MPs precisely during this period of increasing media coverage and political salience of MPLADS. Over the 4 years in office of this 1999-elected cohort, until the elections of June 2004, media coverage intensified, with the same News Plus/Factiva search producing 244 articles mentioning MPLADS. The utilization (nonutilization) of allocations was a major theme of this news coverage.
Apparently driven by this media attention, legislators exerted greater effort than had previously been worthwhile and dramatically increased MPLADS disbursements. By the end of the period 1999 to 2003, the median MP office had disbursed 85% of accumulated funds. All but 32 out of 543 increased their utilization of MPLADS by at least 20 percentage points; most increased it by more than 45 percentage points.
We have found no evidence that MPLADS requires more effort than other forms of constituent service. In particular, there is no indication that the effort required to deliver MPLADS relative to other types of constituency services is systematically and coincidentally higher in constituencies where political parties are dominant. Consequently, unobserved variation across legislators in their costs of delivering pork through other means should not affect the relationship between the effort that they exert in disbursing MPLADS allocations and the degree of party dominance that we investigate.
WHEN DO LEGISLATORS PASS ON PORK?
Institutional determinants of constituency service and pork barrel policies have received the most attention in the literature: voting rules and regime type fix the electoral returns to legislators of building a personal constituency. Political parties have an effect on legislator behavior in this work, but it derives from the institutional environment. Our focus, in contrast, is on direct influence of political parties on constituent service, even when institutions are identical across legislators.
Central to the pork barrel literature is the idea that legislators derive political benefits from providing pork to their constituents that they cannot achieve otherwise. Voter attachment to parties affects those benefits in several ways. For example, Ashworth and Bueno de Mesquita (Reference Ashworth and Bueno de Mesquita2006) argue that voters prefer candidates with higher ability because these candidates can do a better job of providing public goods to them. Unfortunately, voters cannot observe ability, but only infer it from constituency service activities, which only incumbents can provide. Consequently, even where voters value public good provision more than constituency service, legislators persist in providing constituent services to signal their ability.
Voter attachment to parties attenuates this tendency. Where the electorate overwhelmingly favors the policy stance of a political party, they will vote for that party even if the party's candidate is low ability. Knowing that voters’ electoral preferences will be little affected by their efforts to demonstrate their individual ability, incumbents have less incentive to dedicate effort to constituent service.
Voter attachment to parties also affects parties’ candidate selection. In the literature on political party formation (e.g., Aldrich Reference Aldrich and Page1995; Caillaud and Tirole Reference Caillaud and Tirole2002; Levy Reference Levy2004; Morelli Reference Morelli2004; Snyder and Ting Reference Snyder and Ting2002), parties try to recruit candidates whose policy preferences match the parties’, allowing the parties to project credible policy stances. This is easier to do in constituencies where voters are more strongly attached to the party (e.g., to the party's ideology). There, party leaders can afford to recruit candidates who serve the interests of the party and not candidates who are more favorable to or adept at constituency service. In contrast, in constituencies where voter attachment to the party is weak, parties prefer to nominate candidates with the ability to win on a personal vote.
Parties may also prefer to nominate personalistic candidates in constituencies when they cannot make credible preelectoral promises to voters regarding either public goods or narrowly targeted pork barrel policies. Keefer and Vlaicu (Reference Keefer and Vlaicu2008) argue that under these circumstances, parties seek out candidates who can more easily make personally credible promises, typically to narrower groups of voters who would benefit most from pork barrel projects.
In each case, voter attachment to parties disrupts political incentives to provide constituent service. In the first case, attachment reduces legislator incentives to signal ability by providing constituency services. In the second, attachment allows party leaders to choose candidates who reflect the party's position on issues rather than candidates who mirror local preferences. In the last case, attachment is linked to the ability of political parties to make credible promises to provide public goods, reducing political incentives to pursue narrowly targeted policies.
Voters in India are attached to parties for several reasons. All are consistent with the foregoing discussion. One is identity: voters are attached to parties that can credibly claim to defend the interests of their social class (say, Hindus, or low-caste voters). Some parties have also staked out credible ideological positions (e.g., to serve the interests of the poor), creating another source of voter attachment to a party, independent of effort exerted on behalf of local constituents by the incumbent legislator. The Communist Party in West Bengal or in Kerala has such appeal. The charisma of party leaders and prominent candidates can attract votes, independent of the characteristics of the party's local legislative candidate.
Finally, some parties maintain party machines that reliably provide individual favors for party supporters (jobs, favorable treatment by the bureaucracy, etc.), independent of the state and independent of the identity of the party's legislator, another source of voter attachment to the party. We do not aim to disentangle the sources or degree of voter attraction to different parties in India. These vary by party and region, and individual parties could have multiple sources of voter attachment that reduce legislator effort. In West Bengal, for example, voter attachment to the Communist Party can be explained by both its ideological appeal and its internal, “machine-like” organization.Footnote 12
In the next section of the article, we test the proposition that voter attachment to parties reduces MPLADS disbursements using available cross-constituency data after 1999. We take advantage of the fact that, even after the dramatic rise in MPLADS disbursements following the increase in newspaper coverage, 30% of districts still had spent less than 75% of accumulated allocations by 2004, leaving at least $500,000 of their entitlement unspent. There was also much more variation across the 543 districts after 1999: the standard deviation of utilization rates of accumulated funds across districts increased from 9 percentage points before 1999 to 16 percentage points afterward. In the state of West Bengal, MPs left 40% unspent; in Tamil Nadu, only 6%.
CROSS-CONSTITUENCY VARIATION IN MPLADS SPENDING: DATA AND SPECIFICATIONS
The MPLADS spending data are available from the relevant central ministry responsible for overseeing its implementation. The first available data point is for cumulative spending incurred in each parliamentary district from the inception of the program in 1993 until March 31, 2000 (the end of fiscal year 1999).Footnote 13 Three different cohorts of MPs had access to MPLADS during this period: MPs elected in 1991 who faced elections again in 1996, MPs elected in 1996 who faced elections in 1998, and MPs elected in 1998 who faced elections in 1999. It is not possible to analyze the influence of specific legislator characteristics on MPLADS spending over the period 1993 to 1999 because we cannot disaggregate constituency spending between the three cohorts. However, the fourth cohort of MPs with access to MPLADS was elected in 1999; its term in office lasted until the next elections of April 2004, or 4 fiscal years. For this cohort, we have constituency-level data on spending incurred by individual MPs over their term in office from 1999 to 2004. We therefore analyze the determinants of variation in MPLADS spending by this 1999-elected cohort of legislators across 483 electoral districts.Footnote 14
We first estimate the following basic specification to examine the role of political parties in determining legislator effort to bring public works to their constituencies:

The left-hand side variable, UtilizationMPLADS, is the actual spending incurred by the MP in constituency d in state s as a percentage of what the MP was entitled to spend on public works in his or her constituency. The entitlement includes the legacy of unspent allocations that MPs had at their disposal in 1999 and additional yearly allocations from 1999 on. This measures the effort exerted by MPs to bring local infrastructure to their constituents.
Our test also hinges on our measure of voter attachment. There are no independent measures of constituency-level voter attachment to parties in India.Footnote 15 We instead measure attachment using the variable PartyStronghold. It equals 1 if the party won every election in constituency d in state s in the 1990s (in the 1991, 1996, 1998, and 1999 elections), regardless of which candidate the party nominated to the party's ticket, and 0 otherwise. This was a period of substantial electoral volatility and emerging incumbency disadvantage, supporting our interpretation of the Party Stronghold indicator variable as identifying those constituencies where voters are particularly attached to political parties. A constituency is most likely to be a party stronghold when voters in the constituency are more strongly attached to the party (or simply more hostile to the party's competitors), for whatever reason, compared to voters in other constituencies where the party is less successful. The remainder of this section is largely concerned with how we take alternative explanations for party dominance into account.
For example, a party may be dominant not because of voter attachment, but instead because the party has used extra-institutional means (vote rigging, violence) to retain power. There is no evidence that party dominance is systematically associated with such extra-institutional influences in India, however. On the contrary, party dominance is in fact less likely in those states in India most associated with such extra-institutional electoral influences, such as Bihar or Uttar Pradesh.Footnote 16 In any case, the potential for extra-institutional influence is most heavily determined by state-level characteristics, one of many reasons our specifications include state-level fixed effects, λs. The use of extra-institutional measures to maintain party dominance should also be associated with systematically larger majorities and a splintered opposition. To the extent this is true, various controls that we employ for electoral strength should also capture the influence of extra-institutional strategies.
Another alternate explanation for party strongholds is that the successful party has chosen a popular candidate to nominate to the constituency ticket. If, in turn, the candidate's popularity is built on ascriptive (e.g., religious, ethnic, caste) or other appeals that are unrelated to local public works provision, resulting low MPLADS disbursements would be unrelated to party influence. We address this issue by controlling for the variable Candidate-Stronghold in the following estimations. This variable equals 1 if the same person has been elected into office in constituency d in state s in every election between, and including, 1991 and 1999, irrespective of his or her party affiliation. We include this variable to test whether a party could have an electoral lock on a constituency for reasons other than the citizens’ intrinsic preference for the party.Footnote 17 There are 42 candidate stronghold constituencies in our sample, but only 6 are candidate, but not party, strongholds (e.g., constituencies where the dominant candidate switched his or her party affiliation). The data do not suggest that candidates can maintain dominance without a dominant party.
Of the 483 constituencies in our analysis, 97 (20%) are party strongholds, and of these the party switched the nominated candidate in 61 districts, retaining the same candidate in the remaining 36 districts. We test whether the effect of party stronghold is different in constituencies where a party switched its candidate than in constituencies where there was no such switch. That is, we estimate the following specification:

The first interaction term equals 1 for those party stronghold constituencies where the party switched its candidate, and the second those constituencies where the party retained the same candidate on its ticket. We test for the equality of coefficients φ1 and φ2 to ensure that the effect of party strongholds is driven by voter attachment to parties rather than candidates.
To ensure that party stronghold effects are not simply reflective of noncompetitive elections, we control for the closeness of electoral races in constituencies, MarginVictory.Footnote 18 This is the average margin of victory in constituency d of the winning candidate (over the runner-up candidate, under a simple plurality electoral law in single-member constituencies) over the three elections of 1996, 1998, and 1999.Footnote 19 The margin of victory could, itself, be taken as a measure of voter attachment. As Ashworth and Bueno de Mesquita (Reference Ashworth and Bueno de Mesquita2006) note, however, electoral results, such as proportion of votes won, are affected by numerous other factors.Footnote 20 In fact, electoral margin of victory is always insignificant in our analysis.
The competitiveness of districts and legislator incentives to make MPLADS disbursements may also be influenced by a unique institutional arrangement in India that guarantees the political representation of disadvantaged groups. Parties must nominate candidates from constitutionally scheduled castes and tribes in approximately 20% of constituencies (108 of 483 in our sample). The last electoral delimitation law of 1977, which was fully implemented by 1982, determined which constituencies would be reserved (Pande Reference Pande2003).Footnote 21 To control for the impact of this affirmative action policy on legislator incentives to distribute pork, we include an indicator variable for whether a constituency is reserved for candidates belonging to the scheduled castes, and tribes: Reserved equals 1 if constituency d is so reserved, and 0 otherwise.
Other constituency-specific characteristics in ηd could be correlated both with party dominance and with legislator effort to disburse MPLADS, introducing bias into our party stronghold estimates. We address this possibility in several ways. The most important is to account in every specification for previous spending under MPLADS from 1993 to 1999. The variable 1993–99Spending measures the total MPLADS spending undertaken in constituency d since the inception of the program until the cohort elected in 1999 took office. In addition, we undertake a host of robustness checks by including additional variables on which data are available. These are population density, population percentage of the ethnically disadvantaged (Muslims, scheduled castes, and tribes), availability of middle schools, electricity, and post and telegraph facilities (measured by the 1991 Census).
Our estimation strategy of including state fixed effects, λs and prior spending on MPLADS, and checking robustness to a number of additional controls, addresses the three most important unobservable sources of possible bias in our results: media penetration and citizen information about legislator performance; variations across constituencies in levels of citizen activism and organization, which might influence both whether parties have strongholds and whether legislators and bureaucrats respond to citizen demands; and the attractiveness of the constituency's administrative district as a posting for competent bureaucrats.
Unobserved variation in the level of information of constituency residents could confound our results in two ways. First, it might be that constituencies with less informed citizens could be both more vulnerable to dominant parties and less likely to hold politicians accountable for MPLADS allocations, creating a spurious negative association between party strongholds and MPLADS disbursements. Second, it may generate reverse causality: in party strongholds, parties can more easily control the media and reduce citizen information about legislator efforts to disburse MPLADS allocations. The first effect reflects factors such as remoteness, which limit constituency information and are unchanging over time. Such factors are fully captured by the control for prior MPLADS spending. Controls for the presence of middle schools and the population of scheduled castes should also capture fixed unobserved variation in citizen information across constituencies.
With regard to the second effect, Besley and Burgess (Reference Besley and Burgess2002) present evidence that party ownership of the media has a significant negative effect on newspaper circulation. However, reductions in MPLADS spending due to party control of media are likely to be consistent with our theory: parties’ main objective in controlling media is to enhance voter attachment (or limit voter opposition) to the party. It is implausible, in contrast, that the main objective would be to protect individual party legislators from the consequences of low effort. Therefore, although it is true that post-1999 changes in media at the constituency level are not captured by prior MPLADS spending, it is unlikely that these changes bias our results. Even if they are correlated with changes in constituency-level party dominance (and the Besley and Burgess evidence refers only to state-level evidence), parties are most likely to use media control to further party objectives, consistent with our theory.
If constituencies with well-organized citizens are better able to oblige legislators to disburse MPLADS allocations, and if they also influence whether a single party gains electoral dominance, this would also inject bias into our estimates. Again, though, prior MPLADS spending should also account for the unobserved effects of constituency-specific citizen organization.
Finally, some states and constituencies are evidently less desirable postings for competent bureaucrats than others because of their remoteness or other characteristics. Less competent bureaucrats would process MPLADS requests less reliably. If party dominance is significant in these same constituencies, a spurious inverse relationship would emerge between party dominance and MPLADS disbursement. In fact, states associated with greater backwardness, the factor most likely to discourage more competent bureaucrats, are also the ones where party dominance is least evident, so that unobserved bureaucrat competence yields a bias against our hypotheses. Regardless, our controls for state fixed effects and prior spending reduce the potential for bias from this source. State fixed effects capture unobserved state characteristics, whereas variation in spending across constituencies should reflect any systematic tendency of particular districts to attract less competent bureaucrats.
The control for prior spending also limits the noise introduced by the accounting rules for MPLADS. Constituencies where more of the MPLADS allocation before 1999 had been spent would have relatively smaller accumulated entitlements by the time the 1999-elected cohort of MPs took office. In these constituencies, less effort might be required to disburse a given fraction of the remaining allocation than in those where predecessors had left a larger legacy of unspent MPLADS funds.
Not all unobserved factors captured by prior MPLADS spending generate a bias in favor of our hypothesis; some yield a strong bias against it. For example, it is possible that constituencies exhibit unobserved variation in the degree to which legislators can extract rents from MPLADS allocations. If these constituencies are also party strongholds, then, insulated from competitive pressures by party dominance, incumbent MPs have greater scope for channeling MPLADS disbursements to crony contractors. However, this would imply higher MPLADS disbursements in party strongholds, not lower, as we find.
In sum, although we cannot definitively exclude the possibility that unobservable constituency-specific characteristics drive our results, controlling for previous spending addresses a wide range of concerns.
CROSS-CONSTITUENCY VARIATION IN MPLADS SPENDING: RESULTS
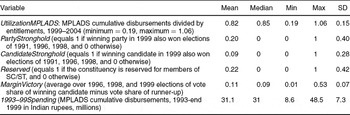
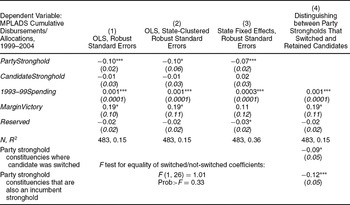
The summary statistics of the variables used in the basic specification are listed in Table 1. Table 2 presents estimates of specification (1) that make three different assumptions about the distribution of errors across constituencies within a state. In all of them, the party stronghold variable is a significant determinant of variation in spending. The party stronghold coefficient estimates in columns (1) and (2) are both −0.10, although standard errors are bigger in the second case because of clustering at the state level. These indicate that MPLADS disbursements in constituencies with a dominant party are 10 percentage points lower, more than one-half of the standard deviation in spending in the data. The size of the coefficient falls slightly when we include state fixed effects in column (3), to −0.07. This estimate measures the deviation of party stronghold constituencies within each state from the state average and indicates that within a state, MPLADS spending in party strongholds is 7 percentage points less than in nonparty strongholds.
Summary Statistics for 483 Constituencies

Effect of Party Dominance and Reservations on Legislator Effort
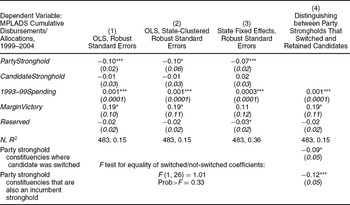
Note: Robust standard errors in parentheses. In columns (2) and (4), these are clustered by state (27 states or clusters). Column (3) includes state fixed effects. All regressions include a constant (not reported).
*p value of 0.10, **p value of 0.05, and ***p value of 0.01.
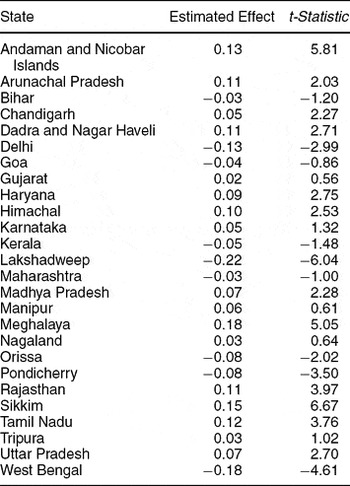
The state fixed effects themselves, listed in Table 3, also support the argument that voter attachment to a single party reduces incumbent incentives to disburse MPLADS. States with dominant parties have significantly lower spending than other states. West Bengal—the only state where a single political party, the Communist Party of India (Marxist), has dominated state politics and leadership since 1977—stands out as a state with significantly and substantially lower MPLADS spending than other states. Average spending in constituencies in West Bengal is 18 percentage points lower than average spending in other states. In contrast, in those states where voters exhibit more even attachment to rival political parties, as in the state of Tamil Nadu in India, legislators exert significantly greater effort. When parties are neck-to-neck in electoral contests, they use any additional instruments available to them to demonstrate the superiority of individual candidates they nominate.
State Fixed Effects (λs)

Note: State dummies, with the exception of Andra Pradesh, the comparator state, were added to the specification in Table 2, column (1). The resulting coefficient estimates are reproduced in this table.
The control for prior spending is robustly significant and a positive determinant of utilization after 1999, reflecting the combined effects of unobserved constituency-level characteristics and the accounting regularity that more spending prior to 1999 leaves less money after 1999, with correspondingly less effort required to use allocations after 1999. The positive coefficient on this variable also suggests that unobserved district specific characteristics (higher-quality bureaucrats, more informed and active citizens) that are captured by prior spending have a significant effect on current MPLADS spending. If the party stronghold coefficient, our estimated impact of voter attachment to parties, were only significant because of a spurious correlation with these unobserved factors, then it would be insignificant after controlling for prior spending. Instead, it is significant.
Party stronghold effects are also robust to the control for a constituency's average margin of victory. This variable is significant at the 10% level, but only in specifications without state fixed effects. Its sign is positive, suggesting that closeness of electoral competition as measured by lower margins of victory is associated with lower MP effort in disbursing their entitlement. However, this correlation could well be due to reverse causality—MPs that exert greater effort in spending their MPLADS allocation are able to achieve higher margins of victory. Our concern is the robustness of the party stronghold effect when we control for the margin of victory; the results here amply support the argument that the party stronghold effect is primarily driven by voter attachment to a party rather than lower levels of electoral competition per se.
The systematic evidence from Table 2 is compelling that legislators provide less constituency service in high attachment areas. There are no data to test whether, consistent with the arguments presented previously, these same legislators are also more likely to shirk, or are less able, or exert greater effort on public good provision or party-building activities. However, some available evidence supports these corollary hypotheses.
Bardhan and Mookherjee (Reference Bardhan and Mookherjee2005) argue that greater voter attachment to a dominant party in the Indian state of West Bengal is associated with greater shirking by village governments in implementing the party's policy of land reforms. The Marxist parties of West Bengal, which generally enjoy high voter attachment, are also known to demand that their candidates provide significant support to the party as a whole. Finally, it is well known that parties aim to find congenial constituencies for party luminaries (e.g., veteran party leaders, or heirs of deceased party luminaries) who can influence policy making in the legislature, even if they have no comparative advantage in disbursing MPLADS (e.g., because their patron-client ties within the constituency are few). In many parliamentary systems, such candidates are disproportionately likely to stand for election in constituencies with high voter attachment to their party, although we cannot confirm this in the case of India.
In contrast to the significant results for the party stronghold variable, candidate dominance (CandidateStronghold) exhibits no significant correlation with MPLADS spending. This is also the case if we substitute a different measure of experience—the total number of terms a legislator has served, regardless of whether they are consecutive. Column (4) in Table 2 indicates no statistical difference in spending between party stronghold constituencies that switched their nominated candidate and those in which they did not (in which the candidate was dominant as well). This is an important robustness check for the party stronghold results, demonstrating that lower spending in party stronghold constituencies is driven by voter attachment to parties rather than to individual candidates.
In contrast to our results for candidate stronghold, research on the effects of legislator experience in the United States finds that seniority is positively correlated with legislative activity (Padro’ i Miguel and Snyder Reference Padro’ i Miguel and Snyder2004; Shiller Reference Shiller1995; Wawro Reference Wawro2002). Golden and Picci (Reference Golden and Picci2007) find that districts of senior legislators in Italy receive greater public investments. The difference in results could be due to country context, but we believe that two other reasons are more likely. First, because the MPLADS program was of fairly recent vintage and novel in the authority it gave to MPs to deliver benefits to their constituencies, its introduction may have given legislators incentives to perform in ways that they had not done before, so that both experienced and new legislators felt the need to demonstrate their ability to perform this new role. MPLADS allocations were also equal across legislators, and program rules did not allow individual legislators to bargain for more funds (as in Golden and Picci).
Second, our focus is on a narrow, more precise measure of effort dedicated to constituency service. Shiller (Reference Shiller1995) and Wawro (Reference Wawro2002) employ a measure of bills introduced, and Padro’ i Miguel and Snyder (2004) use subjective assessments of legislator performance by third parties (e.g., journalists). All of these bundle together effort or effectiveness across legislative tasks, among which are constituency service. The fact that, in the aggregate, legislative activity, effort, or effectiveness increase with seniority is not inconsistent with the possibility that constituency service, by itself, is unaffected by seniority (as we find), or actually falls, as Ashworth and Bueno de Mesquita (Reference Ashworth and Bueno de Mesquita2006) argue.
Table 2 also reports effects of seat reservations on MPLADS spending. These results are relevant to an ongoing debate, both in academic and policy circles, about the policy effects of using electoral law to privilege disadvantaged groups. The results indicate that MPs in reserved constituencies, on average, exert no more effort on constituency service than do MPs in unreserved constituencies: there is little difference in MPLADS spending across the two types of constituencies. The point estimates of the coefficient on the indicator variable Reserved are negative, but are small and imprecisely estimated. The most significant result, in column (3) of Table 2, indicates that MPLADS utilization in reserved constituencies is 3 percentage points lower than average MPLADS utilization in the state.
However, a large and robust effect of reserved constituencies appears when a reserved seat is also a candidate stronghold. A dominant candidate (one who has repeatedly won elections) in a reserved constituency uses 9 percentage points less of his or her MPLADS allocations than dominant candidates in other districts. The behavior of reserved candidates is not robustly different across party strongholds and nonstrongholds.Footnote 22 The likely explanation for this result is that reservations bring to the legislature candidates from disadvantaged social groups who are more likely to be motivated to use their legislative authority on behalf of group members throughout the country.Footnote 23 If legislators from reserved districts dedicate their efforts to obtaining public benefits to members of their groups in all constituencies (e.g., job quotas, as found by Pande Reference Pande2003), this might come at the expense of efforts to bring public works to their own districts. Strong candidates would be more likely to make this trade-off because the electoral risks to them of exerting less effort on their constituency are lower.
ROBUSTNESS OF ESTIMATES TO ALTERNATE MEASURES AND OMITTED VARIABLES
In several cases, theoretical considerations led us to construct dichotomous variables even though more continuous information is available. Our results are insensitive to the use of alternative variables, however. For example, dichotomous measures are arguably the best way to identify constituencies as strongholds, but one could also employ more continuous measures. When we use the sum of the number of elections from 1991 to 1998 (maximum equaling three) that the 2000 incumbent party or legislator had won, we still find a significant negative association between the number of elections won and MPLADS utilization, consistent with the party stronghold results that we report.
The party stronghold results are also robust to including alternative measures of electoral competitiveness. For example, using the incumbent vote share in the 1999 elections in place of the margin of victory has no effect on the results; the coefficient on incumbent vote share is also small and insignificant. We also replace the candidate stronghold indicator variable as a measure of legislator experience with the number of years prior to 1999 that the 1999 incumbent had served in the legislature. This has no effect on results: the variable is insignificant, and party strongholds continue to have a strong negative impact on MPLADS implementation.Footnote 24
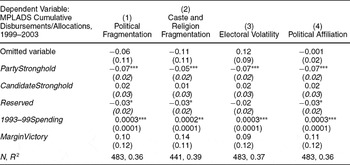
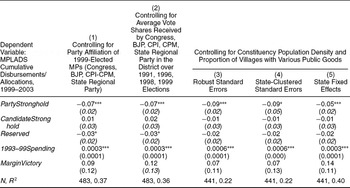
A number of additional omitted variables could affect the estimated coefficients on party stronghold in Table 2 if they are correlated with voter attachment to parties and with MPLADS spending. Tables 4 and 5 report variations of the basic specification (1) with state fixed effects that take these potential omitted variables, from political fragmentation to party policies regarding infrastructure, into account.Footnote 25
Including Omitted Variables

Note: Specifications and estimation strategy are the same as in Table 2, column (3), including state fixed effects. Robust standard errors in parentheses.
*p value of 0.10, **p value of 0.05, and ***p value of 0.01.
Constituency Party Preferences and District Public Good Endowments

Note: Column headings indicate additional controls; these coefficients are not reported.
*p value of 0.10, **p value of 0.05, and ***p value of 0.01.
Robust standard errors in parentheses. Columns (1), (2), and (5) include state fixed effects.
Political Fragmentation
Banerjee and Somanathan (Reference Banerjee and Somanathan2007) argue that political fragmentation may reflect greater electoral competitiveness in a district. It is therefore possible that political fragmentation is correlated both with a lower likelihood of a constituency being a party stronghold and a higher likelihood of legislator effort toward MPLADS (responding to more competitive electoral conditions). Column (1) of Table 4 includes a variable for political fragmentation in each constituency d averaged across the four elections of 1991, 1996, 1998, and 1999. Fragmentation is defined, as in Banerjee and Somanathan (Reference Banerjee and Somanathan2007), as

where μi is the vote share of the ith political party contesting elections from the constituency. Including the variable has no effect on the size and significance of PartyStronghold, and it is itself not correlated with MPLADS spending.
Social Fragmentation
Research has shown that social fragmentation reduces the provision and changes the composition of local public goods (Alesina, Baqir, and Easterly, Reference Alesina, Baqir and Easterly1999; Banerjee and Somanathan Reference Banerjee and Somanathan2007; Betancourt and Gleason Reference Betancourt and Gleason2000; Easterly and Levine Reference Easterly and Levine1997). If it were the case that social fragmentation increased political incentives to use MPLADS and, at the same time, reduced the likelihood that a constituency was a party stronghold, its omission would bias the political stronghold coefficient in a negative direction, potentially accounting for the results we report. However, we test the effects of social fragmentation directly by including a variable received from Banerjee and Somanathan (Reference Banerjee and Somanathan2007). It measures caste- and religion-based fragmentation using population data from the Census of 1991. Column (2) of Table 4 reports these results. As they predict, social fragmentation has a negative effect on MPLADS spending, although it is not precisely estimated. More important, for our purposes here, the coefficient on PartyStronghold remains significant and large, although with slightly reduced magnitudes.Footnote 26
Electoral Volatility
Where voter behavior is subject to greater shocks, or for some other reason is expected to have a larger random component, any given effort by politicians to satisfy constituent interests has a lower payoff. Political incentives to satisfy constituent interests, for example, through full utilization of MPLADS, are therefore reduced. Greater volatility is also likely to be negatively correlated with being a party stronghold. The estimated negative correlation between party strongholds and MPLADS spending could then be driven by the exclusion of electoral volatility from our previous specifications. To address this possibility, the specification in column (3) of Table 4 includes a variable taken from Nooruddin and Chhibber (Reference Nooruddin and Chhibber2008) measuring volatility of elections in a constituency,
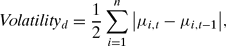
where volatility in constituency d between two consecutive elections at times t and t−1 is measured as the sum of change in vote shares of n political parties.Footnote 27 We average this measure of volatility across the elections of 1991, 1996, 1998, and 1999. The results in column (3) of Table 5 show that including electoral volatility has little effect on the magnitude and no effect on the significance of PartyStronghold. Electoral volatility is itself insignificantly correlated with MPLADS spending.
Political Affiliation with State Government
There may be spillover effects from MPLADS spending on the party's reputation in states where the government is controlled by the MP's party because the state government is broadly responsible for general provision of local services and infrastructure. MPLADS projects could contribute to overall improvement in state-provided services. This may lead parties to encourage or facilitate spending by their MPs in states where the party is in power. Although we already control for such possible effects through the inclusion of state fixed effects, we nevertheless include an indicator for political affiliation between an MP and the state government to examine its influence. The specification in column (4) of Table 4 includes an indicator variable that equals 1 when the constituency's incumbent legislator belongs to the same political party as the state chief minister and 0 otherwise. The affiliation indicator is insignificant and including it does not change the size and sign of the PartyStronghold coefficient.
Party-Specific Effects
It is possible that unobserved constituency characteristics lead voters both to prefer one party overwhelmingly relative to the others, giving rise to party strongholds, and to prefer that incumbents exert effort on policies other than MPLADS. The omission of these characteristics in our specifications would then bias the PartyStronghold coefficient downward, again potentially accounting for our results. We directly examine whether partisan differences in policy preferences drive the PartyStronghold effects by controlling for the party identity of individual legislators. We add indicator variables for legislators belonging to the Congress Party, the BJP, one of the Communist parties, or one of the major state-based regional parties (where a “major” party is defined as one that has formed a state government, with chief ministers belonging to the party, and “state-based” defined as a party that has not contributed a prime minister at the helm of the national government).Footnote 28
These results are reported in column (1) of Table 5. In column (2), we include average vote shares accruing to these parties in successive elections in the 1990s. The party identity of legislators and party vote shares have no independent effect when state fixed effects are included and do not alter the estimated impact of PartyStronghold.Footnote 29
Party Access to Other Infrastructure Projects
Party stronghold districts might have a greater stock of public infrastructure because of a party's efforts to cultivate strongholds through targeted provision of national infrastructure projects to their favored districts. This might reduce the marginal benefit to district residents of additional public infrastructure, and so reduce the attractiveness of using MPLADS as an instrument of constituent service. We address this possibility by including measures of a constituency's stock of public infrastructure, particularly those provided through national projects that parties controlled.
Banerjee and Somanathan (Reference Banerjee and Somanathan2007) matched electoral constituencies to the administrative districts for which the Census of India provides data on availability of public infrastructure. They have further identified some key public infrastructure that proliferated across all national electoral districts between 1971 and 1991, when a strong national party committed itself to universal coverage. Using their data set, we control for five commune infrastructure variables, the proportion of villages in an electoral constituency that had a middle school, tap water, electricity, post and telegraph facilities, and paved roads, as measured by the 1991 Census. We also include population density as measured by the Census, as yet another district characteristic that might influence the ease of or demand for project implementation. These results are reported in the final three columns of Table 6.Footnote 30
In the third and fourth specifications reported in Table 6, the size and significance of the coefficient on PartyStronghold remain unchanged. In the third specification with state fixed effects, the size of the coefficients falls slightly, suggesting that there is some correlation between a district being a party stronghold and its available public infrastructure from past public investments by state and national governments.
These tests demonstrate the robustness of the negative effect of party strongholds on MPLADS spending to numerous additional controls. When combined with the fact that the basic estimates survive the inclusion of prior spending and state fixed effects, this reinforces our confidence in the conclusion that constituency service by politicians is lower when voters are more attached to political parties.
CONCLUSION
Most explanations of large interjurisdictional variations in policy outcomes in democracies are institutional (e.g., the electoral rules of the game), informational (what citizens know about the effects of politician actions on their welfare), and societal (e.g., the extent of social polarization). Our evidence underlines the importance of a generally neglected factor: variations in voter attachment to political parties. These results have implications for several lines of research and for policy.
First, the results are the first direct evidence of the significant policy effects of voter attachment to parties and, more generally, of strong parties; these effects merit more investigation, however. For example, although our data have allowed us to show what legislators do not do in constituencies that exhibit voter attachment, we have little evidence on whether they reallocate their effort to nonlegislative endeavors (shirking), to effort on the provision of public goods, or to party building. Similarly, our mixed evidence on incumbent experience and constituency service argues for greater empirical and theoretical examination of the role of legislator experience in constituency service.
Second, the policy importance of voter attachment underlines the need to understand it better. How and under what conditions, for example, do voters develop an ideological or social affinity for parties and candidates, independent of their policies? What is the contribution that candidate selection makes to attachment?
Third, a growing body of influential research points to the large impact that citizen information has on government policy performance. The qualitative evidence that we present on the evolution of MPLADS reinforces the catalytic role of information: MP disbursements of their MPLADS allocations surged with a dramatic increase in media focus on those disbursements. However, the evidence suggests that a complementary factor was critical for media influence to have this impact: the production of a report by a nonmedia organization (the auditor general). This suggests that the information gathering and information dissemination roles of media need to be separately analyzed.
Fourth, these results are important for understanding the interaction of political and economic development, and in particular, the role of political parties in supporting economic development. Keefer (Reference Keefer2006) finds substantial evidence that countries governed by programmatic parties (e.g., parties in which policy labels are informative to voters) prefer more public and fewer private goods. Kitschelt and Wilkinson (Reference Kitschelt and Wilkinson2007) argue that clientelist policies emerge when voters are personally attached to politicians. Our results further this line of research. Although we cannot characterize parties as programmatic or clientelist, we do show for the first time that voter attachment to parties, whether based on a party's program or voter access to a party machine, significantly suppresses incumbent legislators’ efforts to provide pork and services to their constituents.
Finally, the evidence here indicates that evaluations of constituency development funds in nascent democracies of Africa and East Asia should take into account their effect on the development of programmatic political parties. On the one hand, the results here suggest that they will have less of an impact when voters are attached to political parties. On the other hand, they raise the possibility—although one that requires much more investigation—that CDFs could slow the emergence of programmatic political parties.



Comments
No Comments have been published for this article.