I. INTRODUCTION
The large dielectric response (up to 105)Reference Subramanian, Dong, Duan, Reisner and Sleight1 observed in CaCu3Ti4O12 (CCTO) has led to efforts to use this dielectric in various applications. This material shows many interesting properties: an unusual high-dielectric constant that is nearly temperature independent in the range from 100 K to 600 K; no phase transition and structure change until 35 K; and an abrupt drop of the dielectric constant below 100 K.Reference Subramanian, Dong, Duan, Reisner and Sleight1, Reference Ramirez, Subramanian, Gardel, Blumberg, Li, Vogt and Shapiro2 Thus, CCTO has stimulated a fundamental physics interest in the origin of the unusually large dielectric constant.Reference Chen and Wang3 Normal ferroelectric behavior was rejected on the basis of the absence of ferroelectric domains and the fact that no phase transition was observed in this material.Reference Subramanian, Dong, Duan, Reisner and Sleight1, Reference Ramirez, Subramanian, Gardel, Blumberg, Li, Vogt and Shapiro2, Reference Homes, Vogt, Shapiro, Wakimoto and Ramirez4 A high sensitivity to the sintering process as well as the sample annealing conditions was found, culminating in a noticeable change of the high-dielectric constant under varying conditions,Reference Ni and Chen5–Reference Adams, Sinclair and West7 suggesting extrinsic causes for the dielectric response.Reference Lunkenheimer, Fichtl, Ebbinghaus and Loidl8–Reference Fang, Lin and Lin17 However, to date it is unclear how to describe that behavior in detail. Researchers have gravitated towards Maxwell-Wagner polarization,Reference Li and Schwartz18 which occurs between the inhomogeneous conductive regions such as the surface barrier layer capacitance (SBLC) introduced by the depletion layers between a sample and an electrode mentioned by Lunkenheimer et al.Reference Lunkenheimer, Fichtl, Ebbinghaus and Loidl8, Reference Lunkenheimer, Bobnar, Pronin, Ritus, Volkov and Loidl19 and later detailed by Deng et al.Reference Deng, Yamada and Muralt20, Reference Deng, Xanthopoulos and Muralt21 using x-ray photoelectron spectroscopy (XPS) analysis with CCTO films; and the internal barrier layer capacitance (IBLC) at grain boundaries submitted by Sinclair et al.Reference Adams, Sinclair and West7, Reference Sinclair, Adams, Morrison and West9, Reference Adams, Sinclair and West10 when they found semiconductive grains and insulating boundaries that were later proved by Chung et al.Reference Chung, Kim and Kang22; or at subgrain/domain boundaries that were advanced by Zhang et al.Reference Shao, Zhang, Zheng, Zhong and Wang12 and Fang et al.Reference Fang, Lin and Lin17 Recently, the new idea of a nanoscale barrier layer capacitance (NBLC) was put forward based on polaronic stacking faults. It is thought that this model could give larger capacitances.Reference Bueno, Tararan, Parra, Ramirez, Ribeiro, Longo and Varela23 However, Maxwell-Wagner scenarios do not provide the high dielectric response that can be obtained here. Recently, much research into dopingReference Mu, Zhang, He, Shen and Liu24–Reference Grubbs, Venturini, Clem, Richardson, Tuttle and Samara26 and annealingReference Deng and Muralt27 has found that the huge dielectric constant is defect related. Moreover, an interesting alternative has been proposed: that multipole defects in the CCTO structure are responsible. Once such a defect site is occupied, it possesses not only an extra charge, but it also develops an electrical dipole moment.Reference Luo, Yang, Chen, Song, Wang and Baerner28 There could be a variety of such trap sites or only a single one.Reference Li and Schwartz18, Reference Horyn, Bukowskas and Sikora29–Reference Bärner, Morsakov, Medvedeva, Deng and Yang33 Also, because of the dipole, each site could be electrically bipolar.Reference Dimos, Schwartz and Lockwood34 If this approach is relevant, the trap state relaxationReference Bärner, Morsakov, Medvedeva, Deng and Yang33 and the dielectric response should be strongly correlated. Accordingly, in this paper we use two experimental methods in parallel to investigate the relation, (i) the trap state impedance spectroscopy, and (ii) the conventional bridge measurement of the complex dielectric constant. The first method looks primarily at the trap state charges (monopoles), while the second method looks primarily at the dipoles, which may or may not be attached to the localized charges.
II. EXPERIMENTAL
CaCu3Ti4O12 (CCTO) ceramics were synthesized by standard solid state reaction, using stoichiometric ratio mixtures of CaCO3 (99.99%), CuO (99%), and TiO2 (99.5%), and dense ceramics were obtained by sintering at 1373 K in air for 12 h with two intermediate grindings. The doped samples CaCu3Ti4–xMnxO12 [CCT(M)O] were prepared using the same method while the base material MnO2 (97.5%) was added in stoichiometric proportion. More details can be found in Luo et al.Reference Luo, Yang, Chen, Song, Wang and Baerner28 Silver paint was used for the electrodes. As experimental equipment we used a capacitance bridge and impedance spectroscopy measurement to detect nonrandomly distributed charged defects. Specifically, the dielectric dispersion and complex impedance measurements are performed in the frequency range of 20 Hz to 3 MHz within a temperature range of 10–420 K using a impedance analyzer (WK 6420A, Taiwan) together with a closed ? cycle ? refrigerator (Janis, America).
III. RESULTS
A. Impedance spectroscopy on CCTO
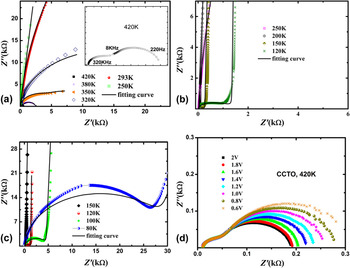
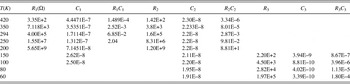
Figures 1(a), 1(b), and 1(c) are the impedance spectra measured over a wide temperature range of 80–420 K. At the high temperature of 420 K, the impedance spectrum clearly shows two semicircles [see the inset of Fig. 1(a)]. As the temperature decreases, the low frequency semicircles fade away due to the frequency limit of the instruments, while higher frequency semicircles appear. As the temperature continues to decrease to temperatures of 250 K and 200 K, the radii of these semicircles reaches a high value such that the circular arcs approximate straight lines [see Fig. 1(b)]. With a further reduction of the temperature to 120 K, a high-frequency semicircle appears, and as the temperature decreases further to 80 K, this semicircle becomes more obvious [see Fig. 1(c)]. Thus we can deduce that there are three sets of electrically active defects or trap states available in ceramic CCTO. According to the impedance values,Reference Irvine, Sinclair and West35 external or internal boundary resistances are suggested, which is consistent with Maxwell-Wagner scenarios. However, in that case, for one trap site we expect a maximum of two semicircles (one for the external surface, and one for the grain boundaries), representing the same trap state in two spatially different environments. As we have at least three semicircles, there has to be a chemical, structural, or polar trap state discrimination, that is, either we have the same trap state type in three different electrostructural environments, or three chemically different trap state configurations, or some combination thereof. The low frequency semicircle at higher temperature shows a change with different AC voltages, indicating a defect transport behavior [see Fig. 1(d)]. Note that with the impedance cycles, the sampling frequency goes up when moving on the semicircle to the left, while with the dielectric response, the frequency moves to the right, see, for example, Luo et al.Reference Luo, Yang, Chen, Song, Wang and Baerner28 So if we want to compare spectral regions along the Z′ axis and the frequency f axis, the sequence gets inverted. The data obtained from fitting the semicircles to a series of RC parallel circuitsReference Nadeem, Akthar and Haque36, Reference Ragavendran, Morchshakov, Veluchamy and Bärner37 are collected in Table I.
Z″ versus Z′ yielding three semicircles. (a) Semicircles I and II. (b) Semicircles II and III, exchanging some spectral weight. (c) Semicircles II and III, staying predominantly separate. (d) Semicircles I and II at different AC voltage loads.

Parameters of the three CCTO semicircles, I, II, and III, at different temperatures.

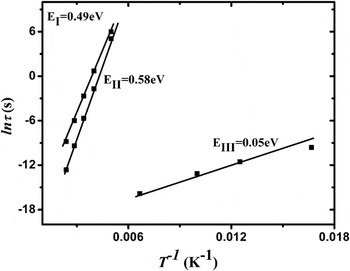
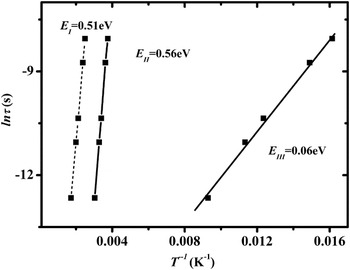
From Table I, a curve ln(τ) versus 1/T with τ(T) = RC can be plotted and then can be compared with equivalent curves taken from the dielectric response. We find exponential behavior in Fig. 2, consistent with standard relaxation time behavior, i.e.

ln(RC) versus 1/T for the three semicircles, revealing activation energies and prefactors of the relaxation times (see Table II).

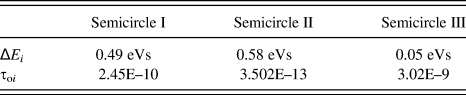
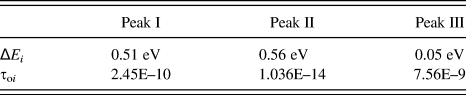
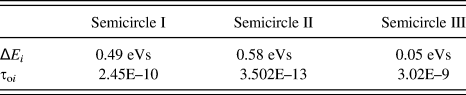
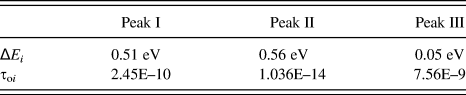
We can extract the activation energies ΔEi and the prefactors τoi for all three semicircles (see Table II). Note, however, that the prefactors τo can still hold a weak temperature dependence τo(T), which in Eq. (1) is overshadowed by the exponential factor.
Activation energies and the prefactors of the three CCTO semicircles.
B. Dielectric response
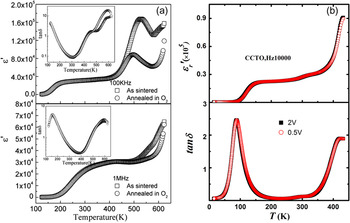
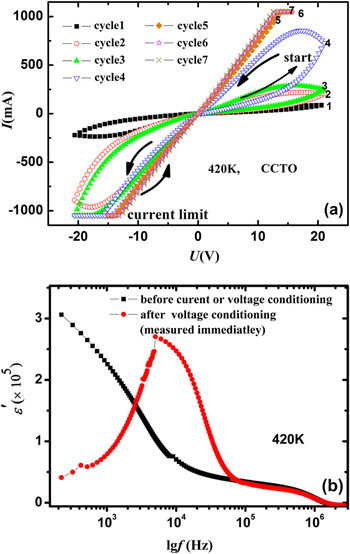
First, we try to determine whether the permittivity versus temperature curve also shows three regimes. In previous research,Reference Ni and Chen5 a complex permittivity versus temperature curve [Fig. 3(a)] shows three loss factor peaks [see the inset of Fig. 3(a)].Reference Ni and Chen5 However, the upper loss peak is convoluted. Our own measurement of the complex permittivity versus temperature curve [Fig. 3(b)] shows three peaks, too, but the middle one (at 300 K) is so small that one cannot be sure. Note that the curve does not change with AC voltages [see Fig. 3(b)], so this behavior is different from what is shown in Fig. 1(d). From the dielectric dispersion curves, we can also deduce two relaxation steps at 104 Hz and 106 Hz and a small anomaly in between [see the curves in Fig. 4(b)] which may indicate that there are three different regimes. To confirm, here we use a trick called electrical conditioning to show that there are actually three regimes.Reference Luo, Yang, Chen, Song, Wang and Baerner28 If we apply repetitive and consecutive I-V cycles on the sample, as described in more detail in Luo et al.,Reference Luo, Yang, Chen, Song, Wang and Baerner28 the surface barrier gradually decreases and in the end disappears [see Fig. 4(a)]. The I-V characteristic changes after about four cycles from nonlinear (electrical barrier type) to linear (ohmic), and simultaneously, the low frequency dielectric response disappears while the center frequency response increases [see Fig. 4(b), solid spheres curve]. Thus we can transfer spectral weight from frequency region 1 to region 2, while region 3 remains unaffected.
(a)  and tan δ (inset) versus temperature T for CCTO at 100 kHz and 1 MHz showing three relaxation structures.Reference Ni and Chen5 Annealing at 1223 K in oxygen for 6 h. (b)
 (upper curve) and tan δ (lower curve) versus temperature for CCTO at 10 kHz showing two large relaxation peaks (at 100 K, 400 K) and a small one (at 300 K). AC peak to peak voltage: 2 V and 0.5 V.

(a) The voltage conditioning effect as referred to in Lunkenheimer et al.Reference Lunkenheimer, Bobnar, Pronin, Ritus, Volkov and Loidl19 (seven cycles, cycle frequency 0.1 s, max voltage ±20 V, max current ±1 A). (b) The real part of the permittivity  versus the frequency. Note that regime I gets annihilated, while regime II increases in spectral weight; regime III is unaffected.

We submit that the real part of the permittivity versus temperature curve (Fig. 3) also harbors three regimes and so the τ-values at different temperatures can now be calculated from Fig. 3, for example, using the T-dependence of the loss tangent, as at the maximum:

Thus we have a three-fold relaxation type of transport on the one hand and a three-fold relaxation type dielectric function on the other. However, smaller details remain different, such as the absolute values of the relaxation times, the absolute values of the activation energies, and the response to AC voltage and current loads as well as small shifts in impedance spectral weight.
The overall result for the dielectric relaxation times in CCTO is shown in Table III and Fig. 5. Again, we find it is almost the same in number, activation energies, and prefactors as that of the trap state relaxation.
ln τ versus 1/T as taken from the loss tangent peak positions.

Activation energies and the prefactors as calculated from the three peaks.
C. The dielectric function of CCT(M)O
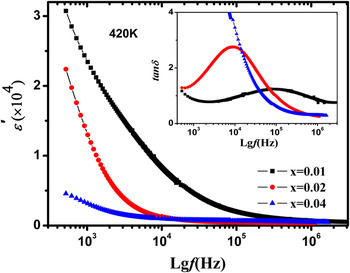
Most people have tried to use the doping or substitution method to investigate the dielectric properties of CCTO, but most would bring a decrease of the dielectric constant. Krohns et al.Reference Krohns, Lu, Lunkenheimer, Brize, Autret-Lambert, Gervais, Gervais, Bouree, Porcher and Loidl38 found that the structure details introduced by doping only result in a minor effect on the dielectric properties, which gives evidence that other defects play an important role in the dielectric behavior of CCTO. On the other hand, conduction is seriously decreased by doping in most experiments,Reference Mu, Zhang, He, Shen and Liu24–Reference Grubbs, Venturini, Clem, Richardson, Tuttle and Samara26, Reference Krohns, Lu, Lunkenheimer, Brize, Autret-Lambert, Gervais, Gervais, Bouree, Porcher and Loidl38 which could have a reducing effect on the polarization in both the fixed and repositioned charge models. Alternatively, Mn-substitution could reduce the magnitude of the local dipole moments, whereupon the peculiar dielectric properties of CCTO would be related to the Ti ion. Usually trap sites are common in manganites, but it is infrequent for electric dipoles to occur in manganites. In contrast, compounds that contain Ti, such as ferroelectric BaTiO3, tend to produce electrical dipole moments. Indeed, even for our lowest Mn content, CaCu3Ti4–xMnxO12 with x = 0.01, we observe almost the same electric conditioning effect and loss factor as with CCTO, suggesting a similar transport behavior, but the dielectric constant  is already reduced by a factor of 100. The dielectric function
 and tan δ for different Mn substitutions 0.02 < x < 0.04 are shown in Fig. 6.
The real part of the permittivity for different Mn substitutions. Inset is the corresponding loss factor tab δ(0.01 < x < 0.04).

Consider the proposition that the pertinent defect is now associated in part with Mn instead of Ti and so does not develop a dipole moment at all. That would not account for the observed reduction. Instead, the substituted Mn ions might create long range distortions, which reduce the dipole moments of almost all of the Mn- and Ti-based traps, consistent with the strong dielectric sensitivity of CCTO samples to cutting and polishing.
IV. DISCUSSION
A. Trap state relaxation amplitudes
1. Independent charges and dipoles
What if the similarity of the number and properties of the (i) impedance spectroscopy and (ii) dielectric response relaxation times is accidental? In that case, we need two independent settings, the first for electrical dipole relaxation and the second for the trap state relaxation in a Maxwell-Wagner scenario. For Eq. (1), electric dipole relaxation, we can use the standard Debye theory, which yields for the volume permittivity:
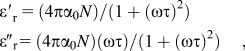
where τ represents the relaxation time of the induced or permanent dipoles, N is the dipole concentration, and α0 is the polarizability. Inserting

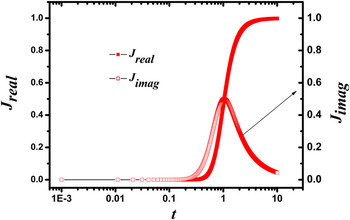
with το ≈ 1/T and normalizing both the amplitude and the temperature yields Fig. 7. Now the real part of the dielectric constant (DK) of Fig. 3(b) could be viewed as a superposition of three such curves, each representing an independent dipole species, however, Fig. 3(a) could not, as with such a superposition there is no downward slope possible with increasing temperature. This is a demonstration of the second model, the trap state relaxation model. Recently, charge exchange between the trap states on E-field parallel and perpendicular grain boundaries in a polycrystal was proposed.Reference Bärner, Deng, Wang, Annaorazov, Medvedeva and Yang39 Exchanging charges between the two sets of planes enhances the space charge potential of the E-field parallel (fp) plane and reduces that of the field perpendicular (fs) plane, thus leading to boundary resistivity changes in the external field direction. For that, not only must the same trap state exist at both types of boundaries, but it must harbor a dipolar anisotropy—only then will charge repositioning occur (the so-called electrical Snoek effect). In that case, the trap state relaxation yields a (complex) electrical susceptibility J:

Trap state Debye relaxation versus temperature. Parameters: A = 1, ωB 1 = 0.368.

where α1, α2 are the anisotropic electrical polarizabilities of a trap state in two different environments (tetragonal symmetry), β = 1/k BT is the Boltzmann factor, ω is the sampling frequency, and C is the charged trap state concentration measured against the total number of trap states. Note that because of the square of C and of the difference in polarizabilities, this is a second order effect which is usually small and can only compete with a first order one such as that manifested in Eq. (3) if the electrical polarizabilities αi are large. So in case that second order effects occur in CCTO, any small variation, for example substitution of Ti by Mn, would likely reduce its contribution to the DK to insignificance. The resistance, however, would remain intact as it represents only those boundary resistance changes that are related to the changing number of trapped charges.Reference Luo, Yang, Chen, Song, Wang and Baerner28, Reference Bärner, Deng, Wang, Annaorazov, Medvedeva and Yang39 Three chemically or structurally different trapped species of this kind would account for the three trap state relaxation processes. However, what are the weak points of this independent trap and dipolar species approach?
(i) It cannot explain the coincidence in number and properties of the relaxation times found using the impedance spectroscopy and the dielectric response.
(ii) It cannot explain the large variety of the dielectric response observed in CCTO.
(iii) It cannot produce the observed downward slopes in the real part of the permittivity with increasing temperature.
Thus, there is reason to look into other possibilities, which, however, should at least show the potential to resolve these three difficulties.
2. Interdependent charges and dipoles
According to linear response theory,Reference Dattagupta40 the Debye-type spectral function Eq. (5) and the corresponding creep function Y, which can be calculated from the difference of the average square of the trap induced polarization energy <p 2>Reference Dattagupta40, Reference Kittel and Oldenbourg41 and its squared average <p>2 have the same amplitude A:

where A = (2/9)βC 2(α1 − α2)2 and the temperature dependent relaxation time is

where E T is the trap level energy difference to the conduction band and το is a weak function of the temperature. The above averages are related to the tensor components αi and the occupation probabilities (1/3 per site) and the jump rates. Here, specifically:
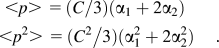
Note that the amplitude A is largest, if say α1 is small compared to α2, α1 << α2. In that case, in an external electrical field E, almost all charges would come to rest at the α2 sites, as then the additional dipole energy –α2E2 would provide the largest reduction in total energy. Figure 7 also shows both parts of the Debye spectral function versus temperature, according to Eq. (5), introducing a weak (1/T)-dependence of the prefactor of τ. This takes into account that the attempt frequency 1/το likely increases with increasing lattice temperature T. Thus,



Then, inserting Eq. (8) into Eq. (5) and setting A = 1, we get the equation
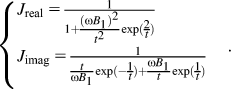
Now we can get the trap state Debye relaxation as shown in Fig. 7, setting the loss maximum at t = 1, which requires
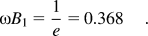
However, even if the amplitude A would be as large as that found in CCTO, a (multiple) Debye type real part  of the dielectric susceptibility is not always found in CCTO. In particular, at high temperatures
 often shows a maximum instead of a step [see Fig. 3(a)]. Thus, we now include a bilinear (+,–) electric axis for the local trap state polarization, hoping that in this case under an external electrical DC-field E all charges could assemble at one directional site, say
 , but now with all the dipoles in one direction, say
 . With linear response theory, that axis would mean four components, that is,
 ,
 and
 ,
 . Now we follow the same steps as before, but now with all four competing sites,

and assuming that the α2 trap state polarization is again much larger, we obtain for both (+,–) polarization amplitudes A:

Note that here  and
 are completely equivalent, suggesting that under an external AC electrical field, the α2 trap states are getting occupied at the expense of the positions α1, but there will be no overall dipole moment, as both (+,–) α2 dipole polarizations are equally occupied. A nonzero polarization can only appear if there is a slight occupation 2,
 , so that finally more traps end up having the same dipole orientation. With the (+) and (–) energy levels equal, there is no reason for that, as is also evidenced by the single relaxation time λ = 1/τ, which again suggests a single or multiple Debye type real part, which is not found in CCTO.
B. Splitting of the relaxation times
Mainly because of the variation in the space charge (internal) fields, we have to expect that the trap state energy levels are already slightly different at zero external fields. This would account for the large number of dielectric starting situations which is observed. However, a zero DK situation, that is, when the charges are evenly distributed on the boundaries and simultaneously on the two polar sites, can always be reached. For example, the zero DK situation can be approached (in CCTO) by running sequences of dielectric spectra up to 500 K, initiating an electrical creep. Because of the temperature dependence of the relaxation time, an energy level splitting would result in a splitting of the relaxation times, say into τ+ and τ−. In that case, we could observe a high dielectric constant, but only in the region where the real parts of the permittivity function versus temperature are not identical. If we set the negative dipole activation energy E−, and the positive one E+, the relaxation times are 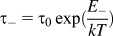 and
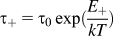 . Setting
 and
 ,
 and
 , we get

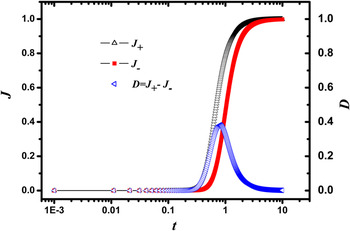
For example, if we take E − = 1.5E +, A+ = 1 = A–, the real parts of the dielectric constant of the two split dipoles and their difference D (i.e., the window) could be shown in Fig. 8.
Real part of the dielectric constant if the relaxation times are split for two opposite electrical dipoles (t = t −, T −/T + = 1.5, A+ = 1 = A-).

Figure 8 also suggests that by splitting τ, the maximum relaxation peak condition ωτ = 1 would differ in temperature with ω = constant. So we would have a window where a high real part  could develop with the loss being small. A drop in the real part of the DK can also occur, just as found in some of the dielectric spectra versus temperature curves [Fig. 3(a)]. Note that even the relaxation curve Fig. 3(b) might represent in fact two windows, that is, when the first rise goes into a plateau whose drop coincides with the rise of a second high temperature plateau. A hint that this might be true is given by the prefactors of the relaxation times. Setting the measured τo equal to ωB o/tT 1 at t = 1, we would have a correlation if the product τoE of two exponentials has the same value. As calculated from Table III , this product is for the first row (0.51 eV): 1.25 × 10⁻¹⁰ eVs, for the third row (0.05 eV): 3.8 × 10⁻¹⁰ eVs, and for the second row (0.56 eV): 0.58 × 10⁻¹⁴ eVs. Clearly, the 0.51 eV and 0.05 eV relaxation lines are correlated by their attempt frequencies, while the 0.51 eV and 0.56 eV lines are correlated by their activation energies. The same holds for the parameters of Table II, for which I and III are related (I: 1.2 × 10⁻¹⁰ eV, II: 2.0 × 10⁻¹³ eV, III: 1.5 × 10⁻¹⁰ eV). Note that aside from satisfying the explanatory conditions set in Sec. IV. A. 1, the bipolar trap state interpretation could also reduce the number of structurally or chemically different trap states to only two—eventually bulk and surface related, with the second plateau drop at temperatures beyond 500 K. From the dielectric constant at a low fixed frequency f 0 = 520 Hz and at constant temperature but varying Mn substitution, we can estimate the order n of the dielectric relaxation process: εi(f0) = const(T)xn. From Fig. 7 and other data we obtain n = 1.6, in contrast to Vegard’s law (n = 1).
V. CONCLUSIONS
In CCTO we observed three trap state relaxation processes and three dielectric relaxation steps, which are correlated. The strong correlation of the trap states and dipole relaxation times together with the absolute values of the permittivity could indicate a combined trap state/dipole relaxation with a trapped monopole associated with an electrical dipole, or alternately to a Maxwell-Wagner space charge polarization scenario which would also correlate the processes, but should yield smaller permittivity values. Specifically, for one trap state a splitting of relaxation times is suggested while Mn doping could indicate that multipole defects involving Ti could play a role in CCTO.
ACKNOWLEDGMENTS
This work is supported by the Natural Science Foundation of China (Grant Nos. 10774040 and 10911120055), the Program for New Century Excellent Talents in University of China (Grant No. NCET-08-0674), and the Humboldt Foundation of Germany.