Introduction
Thermoanalytical instruments such as thermogravimetry (TG) and pyrolysis gas chromatography (pyGC) are frequently used in petroleum geoscience (Peters Reference Peters1986), biofuels research (White et al. Reference White, Catallo and Legendre2011), and soil science (Plante et al. Reference Plante, Fernández and Leifeld2009) to monitor the thermal reactivity of organic carbon (OC) contained within environmental samples. Additionally, petroleum geochemists have long coupled thermal analysis methods with isotope ratio measurements in order to investigate the origins and maturity of thermogenic hydrocarbons, leading to the development of techniques such as pyGC-isotope ratio mass spectrometry (IRMS; Galimov Reference Galimov1988; Berner and Faber Reference Berner and Faber1996; Cramer Reference Cramer2004). However, despite their potential to probe the relationship between OC molecular composition, isotope composition, and thermal reactivity, coupled thermal-isotope methods have found limited use in other fields of organic geochemistry. Still, preliminary studies analyzing environmental samples indicate that TG coupled with IRMS can yield meaningful trends in stable-carbon isotope (12C, 13C) composition with temperature (Lopez-Capel et al. Reference Lopez-Capel, Abbott, Thomas and Manning2006; Lopez-Capel et al. Reference Lopez-Capel, Krull, Bol and Manning2008). Furthermore, Szidat et al. (Reference Szidat, Jenk, Gäggeler, Synal, Hajdas, Bonani and Saurer2004) and Currie and Kessler (Reference Currie and Kessler2005) successfully separated and determined the radiocarbon (14C) content of organic and elemental (“black”) carbon fractions in aerosols using a stepped-temperature approach, confirming the possibility that thermal-isotope techniques can be used in tandem with 14C analysis.
Recently, a novel instrument has been developed at the National Ocean Sciences Accelerator Mass Spectrometry (NOSAMS) facility to determine both the stable and 14C isotope composition of evolved gases from environmental samples with increasing temperature (Rosenheim et al. Reference Rosenheim, Day, Domack, Schrum, Benthien and Hayes2008). This method, termed Ramped PyrOx or RPO, is increasingly being utilized in a host of environments in order to understand the relationship between carbon source, 14C content, and thermal reactivity (e.g. Rosenheim and Galy Reference Rosenheim and Galy2012; Plante et al. Reference Plante, Beaupré, Roberts and Baisden2013; Rosenheim et al. Reference Rosenheim, Roe, Roberts, Kolker, Allison and Johannesson2013b; Schreiner et al. Reference Schreiner, Bianchi and Rosenheim2014; Bianchi et al. Reference Bianchi, Galy, Rosenheim, Shields, Cui and Van Metre2015). However, a complete understanding of isotope fractionation within the RPO instrument is currently lacking, hindering our ability to accurately interpret evolved-gas 13C composition as a carbon source tracer. Additionally, RPO analysis shows promise for improving age-model constraints on carbonate-free sediments (Rosenheim et al. Reference Rosenheim, Domack, Santoro and Gunter2013a; Subt et al. Reference Subt, Fangman, Wellner and Rosenheim2016), although this application requires that contaminant (“blank”) carbon contributions and 14C mass balance are well constrained. Therefore, the aim of this study is to investigate the blank carbon contribution, isotope mass balance, and kinetic fractionation within the RPO instrument located at NOSAMS.
ANALYTICAL SETUP
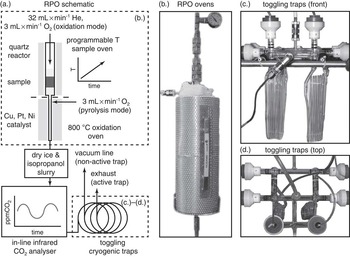
The NOSAMS RPO instrumental design is originally described in Rosenheim et al. (Reference Rosenheim, Day, Domack, Schrum, Benthien and Hayes2008) and has since been modified to lower contaminant carbon inputs by replacing all plumbing with copper tubing, improve gas flow rates, and improve temperature ramp stability (Plante et al. Reference Plante, Beaupré, Roberts and Baisden2013). In this setup, ultra-high purity (UHP) He gas flows at 32 mL×min–1 into a precombusted (850°C, 5 hr) quartz reactor sitting in a two-stage oven containing sample material to be pyrolyzed/oxidized (Figure 1 a,b). He gas is combined with 3 mL×min–1 UHP O2 either (1) prior to entering the quartz reactor (“oxidation mode”) or (2) downstream of sample material but upstream of a Cu, Pt, and Ni wire catalyst via a reactor side-arm (“pyrolysis mode”). An optimized, combined flow rate of 35 mL×min–1 was chosen to minimize transfer time within the system while still allowing sufficient contact time with the wire catalyst and complete cryogenic trapping of CO2. During analysis, the lower oven containing the catalyst is held at 800°C to facilitate oxidation of reduced carbon-containing gases to CO2, while the upper oven containing the sample is ramped at a user-defined rate with ≈5% precision [typically (5±0.2) °C×min–1]. We note that care must be taken when analyzing HCl-fumigated soil/sediment samples (e.g. Plante et al. Reference Plante, Beaupré, Roberts and Baisden2013) as well as marine sediments and dissolved OC, as residual chloride has been observed to interact with and melt the catalysis wire, thus blocking gas flow within the reactor.
The NOSAMS RPO instrumental setup: (a.) schematic diagram, (b.) photo of the ovens, and (c.)–(d.) photos of the toggling trap apparatus. Dashed boxes in panel (a.) indicate the regions shown in panels (b.)–(d.).

After exiting the ovens, water vapor is removed using a dry ice and isopropanol slurry. Gases are then passed into an in-line Sable Systems® CA-10 infrared gas analyzer (IRGA) where CO2 concentration (in parts per million by volume, ppm CO2) is measured photometrically at 1-s resolution with ≈5 ppm CO2 precision in order to generate a plot of temperature versus CO2 concentration (termed a thermogram). Finally, gases are transferred to a toggling trap apparatus (Figure 1 a,c,d) in which CO2 is frozen using liquid N2 while He and O2 are vented to the atmosphere. At user-defined temperatures, the collecting trap is toggled and CO2 for each temperature window (termed a fraction) is transferred to a vacuum line, quantified manometrically, and sealed into a precombusted (525°C, 1 hr) 6 mm Pyrex® tube containing 100 mg CuO and 10 mg Ag pellets. Following each analysis, tubes are recombusted (525°C, 1 hr) to remove sulfur-containing contaminant gases and CO2 carbon isotopes are measured following standard NOSAMS procedures (McNichol et al. Reference McNichol, Gagnon, Jones and Osborne1992, Reference McNichol, Jones, Hutton and Gagnon1994a; Pearson et al. Reference Pearson, McNichol, Schneider, von Reden and Zheng1998). Between each analysis, CO2 concentration measurements are calibrated using a 2-point calibration curve by plumbing (1) UHP He, and (2) UHP He containing a known CO2 concentration directly through the IRGA.
RESULTS AND DISCUSSION
NOSAMS RPO Blank Correction
In order to estimate the RPO blank carbon mass and isotope composition, we directly trapped and analyzed CO2 evolved from empty, precombusted reactor inserts over the typical analytical temperature range (150–1000°C). Although blank carbon contribution is often determined by monitoring deflections from accepted standard reference material (SRM) isotope compositions (i.e. isotope dilution and “modern-dead” methods; Pearson et al. Reference Pearson, McNichol, Schneider, von Reden and Zheng1998; Santos et al. Reference Santos, Southon, Griffin, Beaupré and Druffel2007; Fernandez et al. Reference Fernandez, Santos, Williams, Pendergraft, Vetter and Rosenheim2014; Shah Walter et al. Reference Shah Walter, Gagnon, Roberts, McNichol, Lardie Gaylord and Klein2015), the direct measurement method employed here is better-suited for the RPO instrument for the following reasons:
-
1. Deflections from accepted SRM isotope values are only informative over the narrow temperature range in which the material decomposes, rather than over the course of an entire analysis;
-
2. For stable isotopes, it is possible that kinetic fractionation could overprint isotope deflections due to blank carbon contribution (e.g. Cramer Reference Cramer2004; Dieckmann Reference Dieckmann2005); and
-
3. Isotope deflection methods are unable to separate blank carbon contributed within the quartz reactor (i.e. time-dependent blank carbon; Fernandez et al. Reference Fernandez, Santos, Williams, Pendergraft, Vetter and Rosenheim2014) from that contributed when switching the toggling trap apparatus (i.e. time-independent blank carbon; Fernandez et al. Reference Fernandez, Santos, Williams, Pendergraft, Vetter and Rosenheim2014).
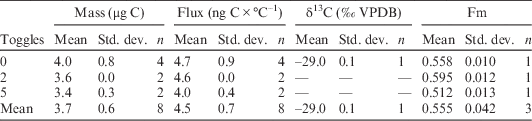
To address point (3), we calculated the blank carbon mass and 14C content when the traps were toggled 0, 2, and 5 times at evenly spaced intervals during CO2 collection between 150 and 1000°C (leading to 1, 3, and 6 collected fractions, respectively). For 2- and 5-toggle experiments, individual fractions were recombined within the vacuum line before transferring to a 6 mm Pyrex tube to keep subsequent steps identical across all experimental conditions. Each experiment was performed in duplicate and the CO2 mass from each analysis was quantified separately before pairs were combined for ultra-small 14C analysis (Shah Walter et al. Reference Shah Walter, Gagnon, Roberts, McNichol, Lardie Gaylord and Klein2015). Results are corrected for the 13C/12C ratio as measured on the AMS (Santos et al. Reference Santos, Southon, Griffin, Beaupré and Druffel2007) and are reported in Fm notation following Stuiver and Polach (Reference Stuiver and Polach1977). We note that Fm reported here is identical to the “14aN” notation of Mook and van der Plicht (Reference Mook and van der Plicht1999) as well as the “F14C” notation of Reimer et al. (Reference Reimer, Brown and Reimer2004). The 0-toggle experiment was repeated in duplicate for 13C analysis using a dual-inlet IRMS as described in McNichol et al. (Reference McNichol, Jones, Hutton and Gagnon1994a), and 13C/12C ratios are reported in δ13C notation (‰ relative to Vienna Pee Dee Belemnite, or VPDB).
Resulting blank carbon mass is independent of the number of toggles throughout the analysis (Table 1), averaging (3.7±0.6) μg C (n=8) and indicating that the act of toggling the traps contributes a negligible amount of time-independent blank carbon. This is further supported by the near-identical Fm values across experimental conditions (Table 1). We therefore combine measurements from all experiments and calculate an average blank carbon Fm value of 0.555±0.042 (n=3). Because both mass and Fm values are nearly identical across all experiments, we apply the measured 0-toggle blank carbon δ13C value of (–29.0±0.1) ‰ VPDB (Table 1) regardless of the number of toggles.
NOSAMS RPO blank carbon mass, flux, and isotope composition. For measurements with n=1, reported std. dev. is instrumental uncertainty. For measurements with n=2, reported std. dev. is ½ of the range between values.

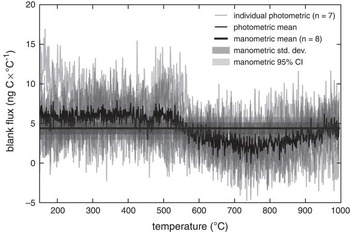
Blank carbon mass calculated here is significantly lower and less variable than that determined for a similar RPO system [c.f. (12.9±7.0) μg C; Fernandez et al. Reference Fernandez, Santos, Williams, Pendergraft, Vetter and Rosenheim2014], likely due to recent valve and plumbing upgrades on the NOSAMS instrument (Plante et al. Reference Plante, Beaupré, Roberts and Baisden2013). Additionally, photometric measurements suggest that time-dependent blank carbon contribution is not concentrated within any particular temperature range—that is, there exist no distinct peaks within the blank thermograms (Figure 2). Although the mean blank flux appears to drop slightly from (5.8±0.7) ng C×°C–1 when T<550°C to (3.1±1.0) ng C×°C–1 when T≥550°C, it can nonetheless be reasonably described as constant throughout the analysis within the 95% confidence interval of the manometric measurements (Figure 2).
RPO blank carbon flux for a ramp rate of 5°C×min–1 as determined photometrically and manometrically. For photometric measurements, absolute CO2 concentrations were normalized such that the mean value for each analysis is equal to the manometric mean, as small differences in IRGA baseline calibration between analyses leads to large changes in calculated blank flux.

Dividing the manometric blank carbon mass by the experimental temperature range results in a blank carbon flux of (4.5±0.7) ng C×°C–1 (assuming a 5°C×min–1 ramp rate; Table 1). We therefore correct the mass of carbon in each RPO fraction for blank contribution according to
 $$m_{s} {\equals}{\rm }m_{m} {\minus}{\rm }\phi _{b} \rm \rDelta T$$
where m s is the true sample carbon mass, m m is the measured carbon mass, ϕ b is the blank carbon flux (in units of mass×°C–1), and ∆T is the temperature range over which the CO2 was collected. Here, we proceed using the manometric average ϕ b value of (4.5±0.7) ng C×°C–1. However, we note that temperature-specific ϕ b values listed above could offer slight improvements in blank-corrected mass accuracy, although these results will typically be statistically identical to those using the manometric average value. Additionally, we propagate uncertainty for this correction according to
 $$\sigma _{{m_{s} }} {\equals}{\rm }\sqrt {\left( {\sigma _{{m_{m} }} } \right)^{2} {\plus}{\rm }\left( {\sigma _{{\phi _{b} }} \rm \rDelta T} \right)^{2} } $$
where σ is the standard deviation associated with each subscripted measurement. This assumes that ∆T is known perfectly (i.e. σ∆T≡0.0) and that the uncertainty in m m and ϕ b are uncorrelated, which is reasonable given that m s ≈m m >>∆Tϕ b . Similarly, we treat the measured CO2 isotope composition as a weighted average of sample carbon and blank carbon, and correct for blank contribution following
 $${\rm }^{\rm x} \hskip-1pt{\rm R}_{s} {\equals}{{m_{m} {\rm }^{\rm x} \hskip-1pt{\rm R}_{m} {\rm }{\minus}{\rm }\phi _{b} {\rm \rDelta T}{\rm }^{\rm x} \hskip-1pt{\rm R}_{b} } \over {m_{s} }}$$
where xR i is the xC/12C isotope ratio of component i [x=13, 14; i=(s)ample, (m)easured, (b)lank], with 13R i expressed in δ13C notation (‰ VPDB) and 14R i expressed in Fm notation. Lastly, we propagate uncertainty associated with isotope corrections. Because m s ≈m m , we cancel these where appropriate to avoid large covariance terms, leading to
 $$\sigma _{{{\rm }^{\rm x} \hskip-1pt{\rm R}_{s} }} \,\cong\,{\rm }\sqrt {\left( {\sigma _{{{\rm }^{\rm x} \hskip-1pt{\rm R}_{m} }} } \right)^{2} {\plus}{\rm }\left( {{{{\rm \rDelta T}{\rm }^{\rm x} \hskip-1pt{\rm R}_{b} } \over {m_{s} }}\sigma _{{\phi _{b} }} } \right)^{2} {\plus}{\rm }\left( {{{\phi _{b} {\rm \rDelta T}} \over {m_{s} }}\sigma _{{{\rm }^{\rm x} \hskip-1pt{\rm R}_{b} }} } \right)^{2} {\plus}{\rm }\left( {{{\phi _{b} {\rm \rDelta T}{\rm }^{\rm x} \hskip-1pt{\rm R}_{b} } \over {m_{s}^{2} }}\sigma _{{m_{s} }} } \right)^{2} } $$
For typical RPO fraction CO2 masses (≈100 μg C) and ∆T (≈100°C) encountered during sample analyses, blank carbon correction shifts δ13C values by –0.02‰ (for δ13C=–35‰ VPDB) to +0.15‰ (for δ13C=+5‰ VPDB) and Fm values by –0.002 (for Fm=0.01) to +0.002 (for Fm=1.0), within the typical analytical uncertainty of these measurements. While 14C content of graphite targets containing as little as 6 μg C has been accurately analyzed at NOSAMS (Shah Walter et al. Reference Shah Walter, Gagnon, Roberts, McNichol, Lardie Gaylord and Klein2015), we recommend a minimum RPO fraction mass of 25 μg C in order to keep blank carbon corrections below 0.5‰ for δ13C and 0.01 for Fm (assuming ∆T=100°C). A spreadsheet for performing all blank correction calculations is included in the supplementary material (Table S1).
Isotope Mass Balance
If sample carbon is completely converted to CO2 by the end of an analysis and is efficiently transferred to the vacuum line, the mass-weighted mean CO2 isotope composition of blank-corrected RPO fractions should match independently measured bulk values within analytical uncertainty. To test this, we compare RPO mass-weighted mean compositions with bulk measurements for a range of sample types (SRMs, dissolved organic carbon, fluvial/marine total suspended sediments, soils, and lacustrine/marine sediments). Bulk δ13C values were obtained either using an elemental analyzer coupled to a continuous-flow IRMS following Whiteside et al. (Reference Whiteside, Eglinton, Olsen, Cornet, McDonald and Huber2011) or on a dual-inlet IRMS after conversion to CO2 by closed-tube combustion as described in McNichol et al. (Reference McNichol, Jones, Hutton and Gagnon1994a). Bulk Fm was measured at NOSAMS following standard preparation methods for each sample type (McNichol et al. Reference McNichol, Osborne, Gagnon, Fry and Jones1994b) and uncertainty for each bulk measurement is taken as the measured analytical uncertainty. We calculate RPO mass-weighted mean isotope compositions (
 $\overline{{ ^{\rm x} \hskip-1pt{\rm R}_{s} }} $
) following
 $$\overline{{{\rm }^{\rm x} \hskip-1pt{\rm R}_{s} }} {\equals}\mathop \sum\limits_{j{\equals}1}^n f_{j} {\rm }^{\rm x} \hskip-1pt{\rm R}_{{s,{\rm }j}} $$
where n is the total number of CO2 fractions collected throughout the analysis, f j is the contribution of fraction j to the total mass of CO2 such that Σ j f j ≡1.0, and xRs,j is the blank-corrected xC/12C isotope ratio of fraction j. Additionally, assuming that f j is known perfectly (i.e. since Σ j f j must equal 1.0 by definition), we estimate the mass-weighted mean isotope uncertainty according to
 $$\sigma {\rm }_{{\overline{{{\rm }^{\rm x} \hskip-1pt{\rm R}_{s} }} }} \,\cong\,{\rm }\sqrt {\mathop \sum\limits_{j{\equals}1}^n \left( {f_{j} \sigma _{{{\rm }^{\rm x} \hskip-1pt{\rm R}_{{s,j}} }} } \right)^{2} } $$
To test the ability of RPO mass-weighted mean isotope values to predict measured bulk values, we performed orthogonal distance regression (ODR), including uncertainty in both x and y variables, using the SciPy package in Python v3.5. and a weighting factor for each sample that is inversely proportional to the uncertainty in each measurement (Boggs and Rogers Reference Boggs and Rogers1990; Oliphant Reference Oliphant2007). All data presented here are either taken from the literature (Rosenheim and Galy Reference Rosenheim and Galy2012; Rosenheim et al. Reference Rosenheim, Domack, Santoro and Gunter2013a) or are originally presented in this study.
Stable Isotope Mass Balance
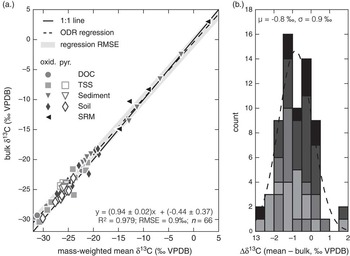
On average, the RPO mass-weighted mean isotope composition is depleted in 13C by (0.8±0.9) ‰ relative to bulk measurements (n=66) independent of RPO analytical conditions (Figure 3), as has been described previously (Rosenheim and Galy Reference Rosenheim and Galy2012; Rosenheim et al. Reference Rosenheim, Domack, Santoro and Gunter2013a). To test if residual 13C-enriched carbon remaining after RPO analysis could cause this depletion, Rosenheim and Galy (Reference Rosenheim and Galy2012) requantified the carbon content of total suspended sediment samples after ramping to 1000°C and determined that only ≈0.003% of initial carbon remained. Therefore, for the samples tested therein, Rosenheim and Galy (Reference Rosenheim and Galy2012) concluded that low yield could not explain the observed bias. We tested additional potential sources of this depletion by performing a series of experiments using a CO2:He calibration gas mixture with known isotope composition [465.5 ppm CO2 in He, δ13C=(–14.9±0.04) ‰ VPDB] as follows:
-
1. Plumbing calibration gas directly into the toggling traps (bypassing the ovens of the RPO system) over a range of flow rates: 15, 35, and 50 mL×min–1;
-
2. Freezing CO2 from the calibration gas for a range of integration times for each of the flow rates in experiment (1): 1, 5, and 10 min; and
-
3. Plumbing calibration gas through an empty, precombusted reactor insert and collecting CO2 between 150 and 1000°C, toggling every 170°C for a total of 5 fractions (flow rate=35 mL×min–1, ramp rate=5°C×min–1).
(a.) Cross-plot of RPO mass-weighted mean versus independently measured bulk δ13C values for all samples in this study in which δ13C data exist and (b.) the same data presented as a histogram of deviations from bulk values (∆δ13C=δ13Cmean–δ13Cbulk). Sample abbreviations are as follows: DOC, dissolved organic carbon; TSS, total suspended sediments; SRM, standard reference material.

The results of experiments (1) and (2) reveal that, for all flow rates and integration times, the collected CO2 δ13C value [(–15.0±0.1) ‰ VPDB, n=9] is statistically identical to the accepted value, indicating that dynamic cryogenic trapping within the toggling traps imparts no isotope fractionation. Furthermore, oven temperature does not appear to affect 13C composition, as δ13C values from all fractions in experiment (3) are statistically identical with a mean value of (–15.2±0.04) ‰ VPDB (n=5). Although this is 0.3‰ depleted relative to the accepted value, this bias is smaller than that observed in most samples within our sample set (i.e. up to 3‰, Figure 3b), suggesting that any fractionation imparted during transport through the hot oven alone cannot cause observed 13C depletion.
However, we note that the mass-weighted mean versus bulk δ13C difference is more pronounced in decarbonated samples containing exclusively OC (mean–bulk: μ=–1.0‰; ±1σ=0.9‰; n=60) as compared either to samples containing mixtures of carbonate and OC or pure carbonate SRMs (mean–bulk: μ=–0.1‰; ±1σ=0.5‰; n=6). We therefore hypothesize that isotope fractionation during OC degradation within the RPO oven could cause 13C depletion, potentially due to incomplete oxidation to CO2 while reduced carbon-containing gases are in contact with the catalyst wire (Figure 1a). This mechanism is consistent with the results of experiment (3) indicating a lack of temperature dependence on isotope fractionation. We therefore recommend that δ13C values of each RPO fraction j within a particular sample can be fractionation-corrected according to the difference between mass-weighted mean and bulk measurements of that sample
 $$\delta ^{{{\rm 13}}} {\rm C}_{{s,{\rm }j,{\rm corrected}}} {\equals}\delta ^{{{\rm 13}}} {\rm C}_{{s,j}} {\plus}\left( {\delta ^{{{\rm 13}}} {\rm C}_{{{\rm bulk}}} {\minus}{\rm }\overline{{\delta ^{{{\rm 13}}} {\rm C}_{s} }} } \right)$$
Furthermore, assuming that the covariance between δ13C
s,j
for each fraction j and the mass-weighted mean value
 $\left( {\overline{{\delta ^{{13}} {\rm C}_{s} }} } \right)$
is small compared to all other variance terms, we propagate uncertainty associated with fractionation correction according to
 $$\sigma {\rm }_{{\delta ^{{{\rm 13}}} {\rm C}_{{s,{\rm }j,{\rm corrected}}} }} \!\cong\!{\rm }\sqrt {\sigma _{{\delta ^{{{\rm 13}}} {\rm C}_{{s,j}} }}^{2} {\plus}{\rm }\sigma _{{\delta ^{{{\rm 13}}} {\rm C}_{{{\rm bulk}}} }}^{2} {\plus}{\rm }\sigma _{{\overline{{\delta ^{{{\rm 13}}} {\rm C}_{s} }} }}^{2} } $$
14C Mass Balance
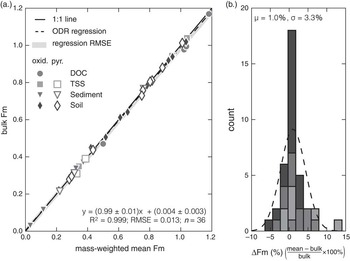
In contrast to δ13C, mass-weighted mean Fm values typically agree with bulk Fm values within analytical uncertainty across all sample types and analytical conditions (mean–bulk: μ=0.005; ±1σ=0.014; n=36; Figure 4). This can be easily explained because Fm is by definition corrected for the 13C/12C ratio as measured on the AMS (Stuiver and Polach Reference Stuiver and Polach1977; Santos et al. Reference Santos, Southon, Griffin, Beaupré and Druffel2007) such that any mass-dependent fractionation occurring in the RPO instrument is accounted for. It is additionally useful to compare relative deviations between bulk and RPO mean values, as 14C content of samples is highly variable. For the samples analyzed here, this equates to an average mean–bulk relative difference of 1.0% with a standard deviation of 3.3% (n=36), independent of absolute 14C content of the sample (Figure 4b). This agreement between the mass-weighted mean Fm and bulk Fm values further precludes the possibility that a significant amount of isotopically unique carbon remains unreacted after ramping to 1000°C, and is strong evidence that 14C mass balance during RPO analysis is robust over the entire range of Fm values found in nature.
(a.) Cross-plot of RPO mass-weighted mean versus independently measured bulk Fm values for all samples in this study in which Fm data exist and (b.) the same data presented as a histogram of relative deviations from bulk values, in percent
 $\left[ {\rDelta {\rm Fm }\left\,( \,\%\, \right){\equals}{{{\rm Fm}_{{{\rm mean}}} {\minus}{\rm Fm}_{{{\rm bulk}}} } \over {{\rm Fm}_{{{\rm bulk}}} }}{\rm {\times}100\,\%\,}} \right]$
. Sample abbreviations are as follows: DOC, dissolved organic carbon; TSS, total suspended sediments.

Kinetic Fractionation
Finally, we evaluate the kinetic isotope effect (KIE) due to mass-dependent differences in pyrolysis/oxidation rates between each isotope during temperature ramping. If the amplitude of the KIE is significant relative to natural compositional differences, then changes in δ13C values between RPO fractions within a single sample can reflect instrumental fractionation rather than differences in carbon source isotope composition. Quantifying fractionation due to the KIE is therefore critical in order to interpret 13C composition as a carbon source tracer. To do so, we measured δ13C values of evolved CO2 from two carbonate SRMs in high-resolution fashion by toggling every ≈20°C: (1) travertine calcite (IAEA C2; Rozanski et al. Reference Rozanski, Stichler, Gonfiantini, Scott, Beukens, Kromer and van der Plicht1992), and (2) Icelandic spar [in-house standard; long-term average δ13C=(3.00±0.03) ‰ VPDB]. Because carbonates are chemically and isotopically homogenous, any resulting δ13C variability should follow a predictable, Rayleigh-like fractionation line that depends only on the difference in activation energy (E) between the decomposition of 13C- and 12C-containing molecules (13–12 ∆E=13 E–12 E; Kwart Reference Kwart1982). We describe the carbonate decomposition rate constant at any temperature [k(T)] by an Arrhenius equation (here written for 12C)
 $${\rm }^{{{\rm 12}}} k{\rm (T)}{\equals}{\rm }^{{{\rm 12}}} k_{0} {\rm exp}\left( {{\minus}{{{\rm }^{{12}} \!E} \over {R{\rm T}}}} \right)$$
where 12 k 0 is the Arrhenius pre-exponential factor for 12C and R is the ideal gas constant. Following Kwart (Reference Kwart1982), the KIE at any temperature [KIE(T)] is defined as the ratio of 12C and 13C rate constants at that temperature
 $${\rm KIE}({\rm T}){\equals}{{{\rm }^{{{\rm 12}}} k{\rm (T)}} \over {{\rm }^{{{\rm 13}}} k{\rm (T)}}}{\equals}\left( {{{{\rm }^{{{\rm 12}}} k_{0} } \over {{\rm }^{{{\rm 13}}} k_{0} }}} \right){\rm exp}\left( {{{{\rm }^{{13{\minus}12}} {\rm \rDelta} E} \over {R{\rm T}}}} \right)$$
Equation 10 fundamentally states that, for a given 13-12 ∆E, 12 k 0, and 13 k 0, KIE(T) decreases with increasing T, indicating that kinetic fractionation within the RPO instrument will be largest for lower temperature components. Furthermore, we can reasonably assume that entropic differences between 13C- and 12C-containing molecules are negligible within the carbonate crystal lattice (c.f. Tang et al. Reference Tang, Perry, Jenden and Schoell2000). This assumption implies that 12 k(T)=13 k(T) as T approaches infinity and requires that 12 k 0=13 k 0=k 0 (Cramer Reference Cramer2004). Additionally, for each temperature we compute the 13C composition of the remaining carbonate that has not yet decomposed [13Rcarb(T)] as
 $$ ^{{{\rm 13}}} {\rm R}_{{{\rm carb}}} {\rm (T)}{\equals}\overline{{ ^{{{\rm 13}}} {\rm R}_{s} }} {\rm exp}\left( {{{ ^{{{\rm 12}}} {\rm I(T) -} ^{{{\rm 13}}} {\rm I(T)}} \over \beta }} \right)$$
where β is the oven ramp rate,
 $\overline{{ ^{{{\rm 13}}} {\rm R}_{s} }} $
is the mass-weighted mean 13C content of the sample calculated by Equation 5, and 12I(T) and 13I(T) are the temperature integrals for 12C- and 13C-containing molecules according to Braun and Burnham (Reference Braun and Burnham1987) (here written for 12C)
 $${\rm }^{{12}} {\rm I(T)}\,\cong\,{{R{\rm T}^{2} } \over {{\rm }^{{12}} \!E}}\,^{{12}} \!k\left( {\rm T} \right){\equals}{{k_{0} R{\rm T}^{2} } \over {{\rm }^{{12}} \!E}}{\rm exp}\left( \!{{\minus}{{{\rm }^{{12}} \!E} \over {R{\rm T}}}} \right)$$
Finally, following Cramer (Reference Cramer2004), we calculate the predicted 13C composition of instantaneously evolved CO2 at any temperature [
 $ ^{{{\rm 13}}} {\rm R}_{{{\rm CO}_{2} }} {\rm (T)}$
]
 $${\rm }^{{{\rm 13}}} {\rm R}_{{{\rm CO}_{2} }} {\rm (T)}{\equals}{{{\rm }^{{{\rm 13}}} {\rm R}_{{{\rm carb}}} {\rm (T)}} \over {{\rm KIE(T)}}}{\equals}{}^{{13}}{\rm R}_{{{\rm carb}}} {\rm (T)exp}\left( {-{{{\rm }^{{13{\minus}12}} {\rm \rDelta} E} \over {R{\rm T}}}} \right)$$
Calculating
 $ {}^{{^{{{\rm 13}}} }}\hskip-1pt{\rm R}_{{{\rm CO}_{2} }} {\rm (T)}$
requires two inputs in addition to 13–12
∆E: k
0 and 12
E. Here we prescribe k
0
a priori and estimate 12
E for each SRM by minimizing the root mean squared error (RMSE) between predicted first-order decay rates and observed thermograms using a Nelder-Mead algorithm in the SciPy package for Python v3.5. (Table 2; Nelder and Mead Reference Nelder and Mead1965; Oliphant Reference Oliphant2007). We note that
 $ ^{{{\rm 13}}} \hskip-1pt{\rm R}_{{{\rm CO}_{2} }} {\rm (T)}$
is insensitive to our choice of k
0 (Dieckmann Reference Dieckmann2005; White et al. Reference White, Catallo and Legendre2011). For example, assuming a large 13–12
∆E value of 100 J×mol–1 for a peak at 700°C, changing k
0 from 1010 s–1 to 1020 s–1 increases δ13C of the first 1% of evolved CO2 by only 1‰ and the first 50% of evolved CO2 by only 0.2‰. We therefore reasonably choose k
0=1015 s–1 based on a compilation of literature values [see White et al. (Reference White, Catallo and Legendre2011) for review]. We then calculate 13–12
∆E that best predicts the 13C composition of all CO2 fractions for each SRM by minimizing the measured versus predicted RMSE (Nelder and Mead Reference Nelder and Mead1965; Oliphant Reference Oliphant2007). To accurately compare instantaneous 13C content predicted by Equation 13 to measured RPO fractions (which integrate over time), we use the CO2-mass-weighted average temperature for each fraction.
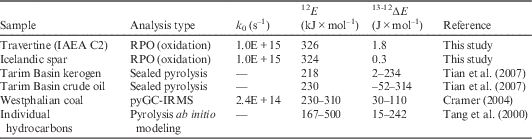
Comparison of k 0, 12 E, and 13–12 ∆E values for carbonate SRMs in this study with those calculated using various thermoanalytical techniques on petroleum products.

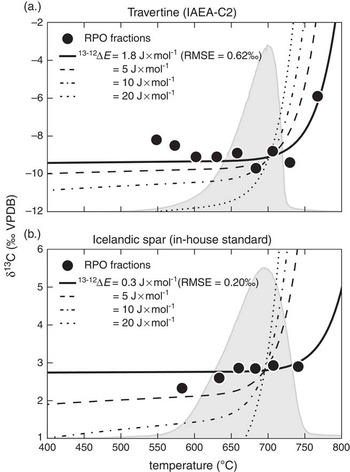
Measured 13C composition for both SRMs is consistent with a 13–12 ∆E value between 0.3 and 1.8 J×mol–1 (Table 2; Figure 5), significantly smaller than literature values for petroleum products using various non-isothermal pyrolysis instruments (Table 2). Therefore, for the SRMs analyzed here, predicted CO2 δ13C increases by <1‰ until >>99% of initial carbon has been decomposed (Figure 5). However, we note that, on one hand, calculated 13–12 ∆E using carbonate SRMs is likely a minimum estimate for environmental samples, as this carbon is already present in a +IV oxidation state, while oxidation of OC could increase 13–12 ∆E. On the other hand, it has been shown that samples with high molecular diversity—as is expected in environmental OC mixtures—exhibit less apparent kinetic isotope fractionation than do single compounds such as the carbonates analyzed here (Cramer Reference Cramer2004). Overall, we recommend that a 13–12 ∆E range of 0.3–1.8 J×mol–1 is valid for any component within an RPO analysis, and we consequently predict that kinetic isotope fractionation cannot exceed 1.8‰ during pyrolysis/oxidation of the first 99% of any sample eluting between 150 and 1000ºC. In reality, 13C enrichment at >>99% combustion will never be observed during RPO analysis, as each fraction typically contains 10–20% of total carbon. We therefore conclude that δ13C variability greater than 1–2‰ between RPO fractions must reflect differences in source carbon isotope composition.
RPO fraction δ13C values for two carbonate SRMs [(a.) travertine and (b.) Icelandic spar] plotted with the predicted δ13C value at each temperature using best-fit 13–12∆E values from Equation 13 (solid black line). For reference, predicted δ13C values for various 13–12∆E values are plotted as dashed and dotted lines, while shaded gray regions represent normalized thermograms (unitless). Each RPO fraction is plotted at its CO2-mass-weighted mean temperature.

Furthermore, if kinetic fractionation were driving observed 13C variability, δ13C values of evolved CO2 from all samples should increase monotonically with temperature along a trend that depends only on 13–12 ∆E, which is clearly not observed. Rather, the δ13C spread (i.e. max–min) across RPO fractions is highly variable between samples, reaching values as high as 28.8‰ in carbonate-containing lacustrine sediments and as low as 0.3‰ in decarbonated soils. For three carbonate-containing sediments analyzed here, we additionally measured the δ13C value of total inorganic carbon following standard methods (McNichol et al. Reference McNichol, Osborne, Gagnon, Fry and Jones1994b) to compare with blank and mass-balance corrected RPO results. For all samples, high-temperature RPO δ13C values agree with those of total inorganic carbon within 1‰, further indicating that RPO δ13C values accurately reflect source carbon composition.
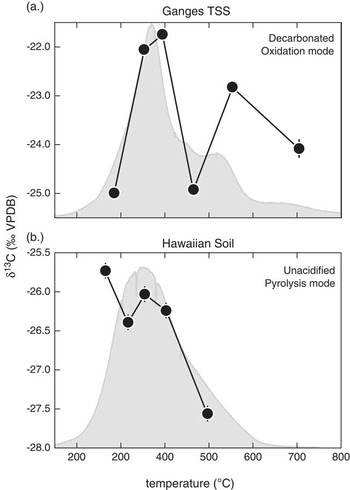
Lastly, decreasing δ13C values have been observed with increasing temperature in select samples such as decarbonated Ganges River total suspended sediments and Hawaiian soils (Figure 6), opposite of trends that would depict kinetic fractionation. Rather, this agrees with the interpretation that labile C3 OC in these environments is replaced by 13C-enriched, C4-derived material (Chadwick et al. Reference Chadwick, Kelly, Hotchkiss and Vitousek2007; Galy et al. Reference Galy, France-Lanord and Lartiges2008), and is further evidence that measured δ13C trends reflect differences in carbon source isotope composition. Combined, the RPO δ13C trends from environmental samples analyzed here agree with SRM-based fractionation predictions indicating that kinetic fractionation is small (i.e. less than 1–2‰) in the RPO instrument at NOSAMS.
RPO fraction δ13C values for two environmental samples: (a.) decarbonated Ganges River TSS (Galy et al. Reference Galy, France-Lanord and Lartiges2008) and (b.) Hawaiian soil (Chadwick et al. Reference Chadwick, Kelly, Hotchkiss and Vitousek2007). δ13C values do not show a monotonic increase with temperature, precluding the possibility that δ13C variability in these samples reflects kinetic fractionation. For reference, shaded gray regions represent normalized thermograms (unitless). Each RPO fraction is plotted at its CO2-mass-weighted mean temperature.

Conclusion
We describe the blank carbon composition, isotope mass balance, and kinetic isotope fractionation within the NOSAMS RPO instrument. Blank carbon mass is significantly smaller than that reported on a similar system (Fernandez et al. Reference Fernandez, Santos, Williams, Pendergraft, Vetter and Rosenheim2014) and can be described as a constant flux of (4.5±0.7) ng C×°C–1 (for a 5°C×min–1 ramp rate) with an Fm value of 0.555±0.042 and a δ13C value of (–29.0±0.1) ‰. We find no evidence for significant time-independent blank contribution, likely due to recent valve and plumbing upgrades within the instrument (Plante et al. Reference Plante, Beaupré, Roberts and Baisden2013).
Isotope mass balance on a suite of environmental samples indicates that independently measured bulk Fm is accurately reconstructed using the RPO fraction mass-weighted mean. In contrast, RPO-predicted weighted-average δ13C values are slightly depleted relative to measured bulk δ13C values, especially for decarbonated samples containing exclusively OC. We eliminate the possibility that this depletion is due to low carbon yield or fractionation within the toggling traps. Rather, we hypothesize that this is caused by incomplete oxidation of reduced gases to CO2 within the oxidation oven and suggest that δ13C of each RPO fraction for a given sample can be mass-balance corrected using the difference between measured bulk and mass-weighted mean values of that sample.
High-resolution δ13C measurements on two carbonate SRMs suggest that kinetic isotope fractionation cannot exceed 1.8‰ in the RPO instrument. This agrees with intra-sample δ13C trends of the environmental samples analyzed for this study, which display a large range in δ13C spread between fractions and are consistent with independently measured carbon source composition. Additionally, selected samples display δ13C trends with temperature opposite of that predicted by kinetic fractionation. These results are strong evidence that RPO kinetic fractionation is small and that blank and mass-balance corrected δ13C values of each CO2 fraction reflect carbon source isotope composition to within 1–2‰.
Acknowledgments
We thank Carl Johnson and the NOSAMS sample-prep lab staff for laboratory assistance. Instrumental improvements to the RPO system were largely the work of Steven Beaupré. Author J D H was partly supported by the NSF Graduate Research Fellowship Program under grant number 2012126152; author V V G was partly supported by the US National Science Foundation (grants OCE-0851015 and OCE-0928582), the WHOI Coastal Ocean Institute (grant 27040213) and an Independent Study Award (grant 27005306) from WHOI; authors G S and P K Z were supported by the WHOI Postdoctoral Scholar Program with funding provided by NOSAMS (OCE-1239667). This manuscript benefited from the constructive comments of two anonymous reviewers and associate editor Dr A J T Jull.
Supplementary material
To view supplementary material for this article, please visit https://doi.org/10.1017/RDC.2017.3