Introduction
For high-yielding dairy cows, it is important to achieve high dry matter (DM) and energy intake rapidly after calving to meet the high requirements. If the intake increases slowly, the cow needs to mobilize excessive amounts of body reserves to attain and maintain high production. This enhances the metabolic stress in the cow and the risk of metabolic disorders (Reist et al., Reference Reist, Erdin, von Euw, Tschuemperlin, Leuenberger, Delavaud, Chilliard, Hammon, Kuenzi and Blum2003; Ingvartsen, Reference Ingvartsen2006). Therefore the feeding of cows during the first weeks of lactation must be directed to maximize the energy intake so as to decrease the extent of negative energy balance.
In Finland, dairy cows are typically fed grass silage ad libitum and the density of the cows’ diet after parturition is increased by increasing the concentrate allowance. An increased intake of concentrate with a rapid rate of increase has shown to decrease the silage intake (Faverdin et al., Reference Faverdin, Dulphy, Coulon, Vérité, Garel, Rouel and Marquis1991). The substitution rate (decrease in silage DM intake (DMI) per increase in concentrate DMI) between roughages and concentrates is affected by the state of lactation as well as the concentrate composition (Faverdin et al., Reference Faverdin, Dulphy, Coulon, Vérité, Garel, Rouel and Marquis1991). Faverdin et al. (Reference Faverdin, Dulphy, Coulon, Vérité, Garel, Rouel and Marquis1991) measured a mean substitution rate of 0.61 between silage and concentrate in mid-lactation for grass silage-based diets. The substitution rate during the first weeks of lactation has been documented only in a few papers and the results have been variable (Kokkonen et al., Reference Kokkonen, Tesfa, Tuori, Hissa, Jukola and Syrjälä-Qvist2000; Ingvartsen et al., Reference Ingvartsen, Aaes and Andersen2001).
A fast rate of increase in the concentrate allowance to a high level may disturb rumen function and cause a decrease in DM and energy intake. Diets containing fibrous by-products supported higher ruminal pH than diets with starch-rich concentrates (Ørskov and Oltjen, Reference Ørskov and Oltjen1967; Martin et al., Reference Martin, Chamberlain, Robertson and Hirst1994). Therefore feeding fibrous concentrates may increase the intake of grass silage, and thus energy, as shown in the study of Ala-Seppälä et al. (Reference Ala-Seppälä, Huhtanen and Näsi1988). However, to our knowledge there is no study focusing on the effect of concentrate composition with different rates of increase in concentrate allowance during the first weeks of lactation on substitution rate and cows’ performance.
The aim of this study was to evaluate the effect of the rate of increase in concentrate allowance of two different concentrates after calving and their interactions on the performance of high-yielding dairy cows during the first 100 days of lactation.
Material and methods
Animals, feed and experimental design
In all, 64 Finnish Ayrshire cows, 21 primiparous and 43 multiparous, were blocked by parity (primiparous or multiparous) and assigned randomly to one of the four treatments by taking account of the due date of calving. The factors were the rate of increase in the concentrate allowance (IR) after calving (S = slow; 24 days and F = fast; 12 days) and two pelleted concentrate mixes (A and B) formulated with similar crude protein (CP) and metabolizable energy (ME) concentrations but differing starch and NDF concentrations using different ingredients. The experiment started at calving and continued for the first 100 lactation days. The average weight of the experimental animals after calving was 611 (s.d. 63) kg for the primiparous and 661 (s.d. 69) kg for the multiparous cows.
Concentrate A (Raisio Feed Ltd, Raisio, Finland) contained (g/kg) barley (350), wheat (350), soybean meal (120), rapeseed meal (97), wheat syrup (50) and mineral and vitamin mix (33), and concentrate B (Raisio Feed Ltd) contained barley (350), molassed sugar beet pulp (200), rapeseed meal (100), rapeseed cake (100), maize draff (100), wheat syrup (50), bran mix (32) and mineral and vitamin mix (31). All cows were fed the same grass silage. The grass silage was prepared from first-cut timothy (Phleum pratense) and meadow fescue (Festuca pratensis) sward wilted for 1 to 2 h. A formic acid-based additive (5 l/t) was used in ensiling.
During the last 3 weeks before parturition, all cows received grass silage ad libitum and an increasing amount of the experimental concentrates. At parturition, the concentrate allowance had reached 4 kg/day for multiparous and 3 kg/day for primiparous cows. After calving, the concentrate allowance of the multiparous cows was raised in equal daily steps to 17 kg/day and of the primiparous cows to 13.5 kg/day over 12 days (F rate) or 24 days (S rate). Thus, the daily increase in concentrate allowance after calving was 0.54 and 0.44 kg/day for S treatments and 1.08 and 0.88 kg/day for F treatments for the multiparous and primiparous cows, respectively. The cows had free access to grass silage after calving.
The cows were housed in a two-compartment freestall barn. Cows fed diet A were placed in one compartment and cows fed diet B in the other. All cows were fitted with transponder collars that allowed identification in the milking parlour and at the forage and concentrate feeders. Each cow had an individual feeding manger with free access to grass silage through computerized gates (RIC System; Insentec, Marknesse, The Netherlands). Grass silage feeding was performed by a feeding robot (TR Feeding Robot; Pellonpaja Ltd, Ylihärmä, Finland) four times a day at 0645, 1315, 1615 and 1830 h. To ensure ad libitum grass silage feeding, at least 5% daily refusals were required. In all, 30% of the concentrate allowance was given in the milking parlour and 70% from the computerized concentrate feeders (Pellonpaja Ltd). The concentrate given from computerized concentrate feeders was offered in equal portions during five feeding periods starting at 0335, 0700, 1130, 1600 and 1930 h.
Measurements, sampling and analysis
The amount of grass silage offered was recorded automatically and orts were recorded manually each day. Concentrate intakes were recorded automatically every day. A sample of the grass silage was taken twice a week. These sub-samples were combined over a 2-week period and were stored at −20°C until analysis. Thawed samples were analysed for DM, ash, CP, NDF, volatile fatty acids (VFA), lactic acid, water-soluble carbohydrates, ammonia-N and in vitro organic matter (OM) digestibility. Concentrate samples were collected twice a week and combined to give a 4-week sample for analysis. The concentrate samples were analysed for DM, ash, CP, ether extract (EE), NDF and starch. The analyses of grass silage and concentrate samples were performed using procedures previously described by Mäntysaari et al. (Reference Mäntysaari, Khalili, Sariola and Rantanen2007) except that starch was analysed according to Salo and Salmi (Reference Salo and Salmi1968).
The cows were milked twice a day at 0630 and 1600 h in a 2 × 6 auto-tandem milking parlour. The milk yield was weighed and recorded automatically during each milking. Milk samples for milk protein, fat and lactose analyses were collected every 2 weeks from two consecutive milkings. The analyses were done using a Milko-Scan 605 analyser (Foss, Hillerød, Denmark). Constituent concentrations were calculated as a weighted mean of morning and evening milk yields. Milk samples for urea analysis were collected every fourth week from two consecutive milkings of seven cows per treatment and were pooled according to milk yield. The milk urea concentration was measured as ammonia following urease hydrolysis (McCullough, Reference McCullough1967). The BW of each cow was recorded automatically after each milking. The body condition scores (BCS) were measured on a scale of 1 to 5 (1 = thin to 5 = fat) with intervals of 0.25 as described by Edmonson et al. (Reference Edmonson, Lean, Weaver, Farver and Webster1989). The BCS were recorded at calving and every second week thereafter.
Calculations and statistical analysis
The ME content of the silage was based on the content of digestible OM in DM (ME (in MJ) = 0.16 × DOM in DM) (MAFF, 1975; MAFF, 1984). The ME content of the concentrates was calculated according to MAFF (MAFF, 1975 and 1984). The digestibility coefficients of the nutrients in the concentrates were taken from the Finnish feed tables (MTT, 2004). The amino acids absorbed from the small intestine (AAT) were calculated according to the Finnish feed tables (MTT, 2004). The apparent efficiency of ME utilization for milk production (kl) was calculated ignoring live weight change. Milk energy content was calculated according to Sjaunja et al. (1990). In energy balance (=ME intake – ME for maintenance – ME for milk) estimations, ME required for maintenance and milk was calculated according to MTT (2004).
Individual weekly averages were calculated from the daily intake, production and BW measurements. The weekly average intake and production data were analysed using the MIXED procedure of SAS® (Littell et al., Reference Littell, Milliken, Stoup and Wolfinger1996). The restricted maximum likelihood (REML) method was used to estimate the variance component, and the type of within-subject covariance matrix used was first-order autoregressive [AR(1)]. The model used was

where IRi represents the rate of increase in the concentrate allowance (S or F), Cj the concentrate (A or B), Pl parity, Sijklm the random effect for the experimental cow and Wn the week of lactation. Term bI is the linear effect of pedigree index (Ik) of the cow appropriate for milk yield, fat or protein concentration or yield (Faba Breeding, Finland). The results were calculated from the whole experimental data and from the data for the first 4 weeks of lactation. The biweekly BCS were also analysed using model (1) without the effect of bIIk and with the exception that Wn represents a 2-week period. In the statistical analysis, significance was declared when P < 0.05. A tendency was declared when P < 0.10.
Results
Feeds and feed intake
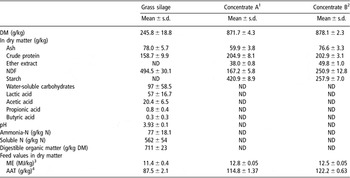
Concentrate A was a wheat and barley grain-based feed with soybean and rapeseed meal as protein sources. Concentrate B included barley grain and fibrous by-products, mainly sugar beet pulp, and the protein sources were rapeseed meal and cake. The chemical composition and calculated feed values of the concentrates are presented in Table 1. Concentrate A and B had similar CP and ME concentrations. Between the concentrates, there was a clear difference in carbohydrate fractions. Relative to concentrate B, concentrate A had higher starch (421 v. 258 g/kg DM) and lower (167 v. 251 g/kg DM) NDF concentrations (Table 1).
Chemical composition and calculated energy and protein values for grass silage and concentrate mixes (mean ± s.d.)

DM = dry matter; ME = metabolizable energy; ND = not determined.
1A mix (g/kg) of barley (350), wheat (350), soybean meal (120), rapeseed meal (97), wheat syrup (50) and mineral and vitamin mix (33).
2A mix (g/kg) of barley (350), molassed sugar beet pulp (200), rapeseed meal (100), rapeseed cake (100), maize draff (100), wheat syrup (50), bran mix (32) and mineral and vitamin mix (31).
4Amino acids absorbed from small intestine (MTT, 2004).
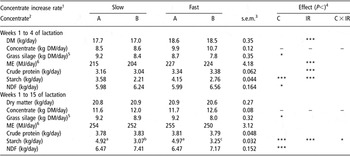
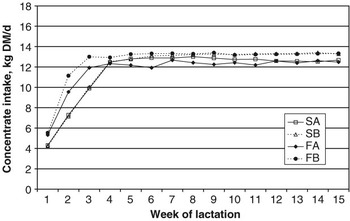
The average DMI of the cows during the experiment was not affected by IR or concentrate composition, but during the first 4 weeks of lactation the DMI was higher for F than for S treatments (Table 2). Statistical differences in the concentrate intake were not analysed because the concentrate intake was fixed at 17 kg/day and 13.5 kg/day for multiparous and primiparous cows, respectively. Figure 1 shows that during the first weeks of lactation for an S rate of increase, there was no difference between concentrates in the development of concentrate intake. However, with the F rate of increase the cows offered concentrate A were not able to increase the concentrate intake as fast as the cows offered concentrate B.
Feed intake of the cows dependent on concentrate type and increase in daily allowance

DM = dry matter; ME = metabolizable energy.
1After calving the concentrate allowance of multiparous cows was increased to 17 kg/day and of primiparous cows to 13.5 kg/day in 24 (=slow) or 12 (=fast) days.
2A = a mix (g/kg) of barley (350), wheat (350), soybean meal (120), rapeseed meal (97), wheat syrup (50) and mineral and vitamin mix (33). B = a mix (g/kg) of barley (350), molassed sugar beet pulp (200), rapeseed meal (100), rapeseed cake (100), maize draff (100), wheat syrup (50), bran mix (32) and mineral and vitamin mix (31).
3s.e.m. = standard error of the mean.
4C = concentrate; IR = rate of increase of concentrate allowance.
*P < 0.05, **P < 0.01, ***P < 0.001. Different superscripts within rows are used to specify significant differences if there is a significant C × IR effect (P < 0.05).
5Significant (P < 0.05) interaction C × IR × week of lactation.
Concentrate dry matter intake (DMI) of cows with fast (F) or slow (S) increasing rate of concentrate allowance after calving using concentrates high (A) or low (B) in starch.

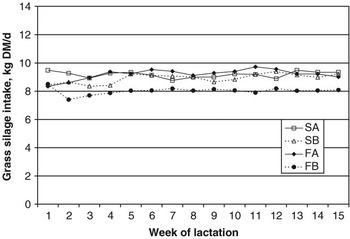
For grass silage intake there was a significant (P < 0.05) interaction between IR, concentrate and week of lactation (Table 2). This was caused by the different silage intake profile for the FB treatment than for the other treatments (Figure 2). On FB treatment, the grass silage intake dropped on the second week of lactation compared with the other treatments and stayed lower throughout the experiment. There were no significant differences in silage intake between the other treatments.
Grass silage dry matter intake (DMI) of cows with fast (F) or slow (S) increasing rate of concentrate allowance after calving using concentrates high (A) or low (B) in starch.

Across the whole experimental period there were no differences in the average energy or CP intake between treatments, but as expected the intake of energy as well as of CP and other nutrients increased faster and was higher during the first 4 weeks of lactation for F than for S treatments (Table 2). The difference in the carbohydrate composition between concentrates caused higher (P < 0.001) intake of NDF, AAT and EE and lower (P < 0.001) intake of starch with concentrate B than A.
Milk production and composition
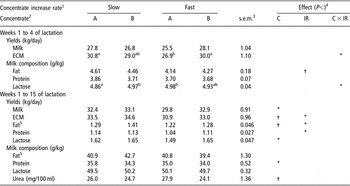
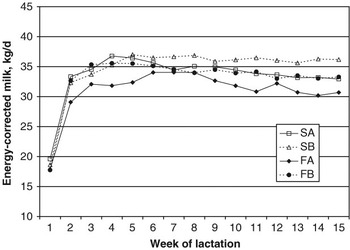
The milk yield during the first 4 weeks of lactation or during the whole experiment was not affected by IR (Table 3). The concentrate composition did not affect milk yield during weeks 1 to 4 of lactation, but for the whole experiment the milk yield was higher (P < 0.05) when the cows were fed concentrate B compared with A. For energy-corrected milk (ECM) yield, there was a significant interaction between IR and concentrate composition during weeks 1 to 4 of lactation. The concentrate composition did not affect the ECM yield on the S rate of increase but on the F rate of increase the ECM yield was significantly lower for FA than for FB treatment. Across the whole experimental period, the ECM as well as the protein yields were higher for S compared with F treatments (Table 3). Concentrate B tended to increase the ECM yield during week 1 to 15 of lactation when compared with A (Figure 3), but concentrate type had no effect on protein yield (Table 3). There was a significant interaction between IR, concentrate type and week of lactation for milk fat yield. This was caused by the lower milk fat yield for FA than for other treatments in the beginning of lactation. Later in lactation the milk fat yield was higher on FB compared with other treatments.
Milk yield and milk composition of cows dependent on concentrate type and increase in daily allowance

ECM = energy-corrected milk.
1After calving the concentrate allowance of multiparous cows was increased to 17 kg/day and of primiparous cows to 13.5 kg/day in 24 (=slow) or 12 (=fast) days.
2A = a mix (g/kg) of barley (350), wheat (350), soybean meal (120), rapeseed meal (97), wheat syrup (50) and mineral and vitamin mix (33). B = a mix (g/kg) of barley (350), molassed sugar beet pulp (200), rapeseed meal (100), rapeseed cake (100), maize draff (100), wheat syrup (50), bran mix (32) and mineral and vitamin mix (31).
3s.e.m. = standard error of the mean.
4C = concentrate; IR = rate of increase of concentrate allowance.
†P < 0.10, *P < 0.05, **P < 0.01, ***P < 0.001. Different superscripts within rows are used to specify significant differences if there is a significant C × IR effect (P < 0.05).
5Significant (P < 0.05) interaction C × IR × week of lactation.
Energy-corrected milk yield of cows with fast (F) or slow (S) increasing rate of concentrate allowance after calving using concentrates high (A) or low (B) in starch.

The concentrate composition or IR had no effect on milk protein concentration during the first weeks of lactation (Table 3). The milk fat content was not affected by the concentrate composition, but tended (P = 0.067) to be higher for treatment S during weeks 1 to 4 of lactation. With the F rate of increase in early lactation, milk lactose concentration was not different between concentrates, but with the S rate of increase milk lactose concentration was higher when cows were fed concentrate B than A. Across the whole experimental period, the milk protein concentration was lower (P < 0.05) when concentrate B was fed. For the milk fat concentration during the whole experiment there was a significant interaction between IR, concentrate and week of lactation. This interaction showed that the milk fat concentration was higher for S than for F treatments in early lactation with a greater difference between S and F when concentrate B was fed instead of A. Later in lactation, this difference between IR was noticed only when concentrate A was fed. The milk urea was slightly (P < 0.08) higher when cows were fed concentrate A rather than B.
Energy utilization and development of body weight and condition
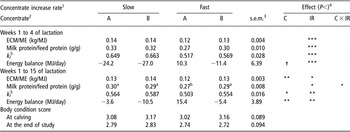
There was no difference in BCS between treatments at parturition or at the end of the study (Table 4). The concentrate composition and IR had no significant effect on BW change during weeks 1 to 4 of lactation or when measured across the whole experimental period. The rapid increase in concentrate allowance increased the energy balance at the beginning of lactation and during the whole experiment (Table 4). Consistent with this, the apparent efficiency of ME utilization for milk production (kl) was higher for S than for F treatments, especially during the first weeks of lactation. The concentrate composition had no effect on average energy balance during the first weeks of lactation, but during the whole experiment the energy balance was higher with concentrate A than B.
Feed utilization, energy balance and body condition score of cows dependent on concentrate type and increase in daily allowance

ECM = energy-corrected milk; ME = metabolizable energy.
1After calving the concentrate allowance of multiparous cows was increased to 17 kg/day and of primiparous cows to 13.5 kg/day in 24 (=slow) or 12 (=fast) days.
2A = a mix (g/kg) of barley (350), wheat (350), soybean meal (120), rapeseed meal (97), wheat syrup (50) and mineral and vitamin mix (33). B = a mix (g/kg) of barley (350), molassed sugar beet pulp (200), rapeseed meal (100), rapeseed cake (100), maize draff (100), wheat syrup (50), bran mix (32) and mineral and vitamin mix (31).
3s.e.m. = standard error of the mean.
4C = concentrate; IR = rate of increase of concentrate allowance.
†P < 0.10, *P < 0.05, **P < 0.01, ***P < 0.001. Different superscripts within rows are used to specify significant differences if there is a significant C × IR effect (P < 0.05).
5Ignoring live weight gain.
Discussion
Feed intake
Weeks 1 to 4 of lactation
The higher DM, energy and protein intake for F compared with S treatment during weeks 1 to 4 of lactation was caused by the higher concentrate intake of the cows on F treatments. With the S rate of increase, the concentrate intake increased as planned with no difference between concentrates (Figure 1). With the F rate of increase, the cows were not able to increase the daily concentrate intake as fast as they were allowed and there was also a difference in the development of concentrate intake between concentrates. The cows on F treatment had a more rapid increase in intake of concentrate B than A (Figure 1). The difference in concentrate intake between cows fed the FB or FA diet was not large during the first week of lactation; FB: 6.01 (s.d. 1.84) v. FA: 5.82 (s.d. 1.88) kg DM/day. The difference, however, increased during the lactation weeks 2 and 3. On lactation weeks 2 and 3, the concentrate intakes of the cows fed the FB diet were 11.6 (s.d. 2.35) and 13.5 (s.d. 1.77) kg DM/day and of the cows fed the FA diet were 10.2 (s.d. 2.96) and 12.4 (s.d. 2.42) kg DM/day, respectively. The concentrates A and B differed from each other mostly in the type of carbohydrate and slightly in the source of protein. Concentrate B had more soluble fibre and less starch than concentrate A. The microbial fermentation in the rumen with concentrates high in starch compared with fibrous concentrates has been reported to cause depression in the rumen pH (Ørskov and Oltjen, Reference Ørskov and Oltjen1967; Martin et al., Reference Martin, Chamberlain, Robertson and Hirst1994). Therefore it might be that the fast rates of increase with concentrate A caused changes in rumen fermentation, which led to a decreased concentrate DMI to avoid development of ruminal problems. Based on these findings, the results indicate that the concentrate composition is an important factor when aiming to reach a high concentrate intake with a fast rate of increase during the first weeks of lactation.
The higher concentrate intake during the first weeks of lactation for F compared with the S treatment caused a small decrease in the silage intake. The substitution rate between silage and concentrate during the first 4 weeks of lactation was 0.35 for A diets and 0.29 for B diets. These values are low compared with the substitution rates calculated from the data measured later in lactation (Faverdin et al., Reference Faverdin, Dulphy, Coulon, Vérité, Garel, Rouel and Marquis1991). Consistent with our results, Faverdin et al. (Reference Faverdin, Dulphy, Coulon, Vérité, Garel, Rouel and Marquis1991) obtained higher substitution rate with a starch-rich concentrate (0.61) than with a fibre-rich concentrate (0.49). In their study, the amount of concentrate varied between 3.5 and 10.2 kg/day. In early lactation studies there have been considerable variation in the measured substitution rate (Kokkonen et al, Reference Kokkonen, Tesfa, Tuori, Hissa, Jukola and Syrjälä-Qvist2000; Ingvartsen et al., Reference Ingvartsen, Aaes and Andersen2001). In a study by Kokkonen et al. (Reference Kokkonen, Tesfa, Tuori, Hissa, Jukola and Syrjälä-Qvist2000), the substitution rate varied from 0.88 to 0.03 for multiparous cows, and for primiparous cows even the silage intake increased with increased concentrate intake during days 1 to 42 of lactation. Ingvartsen et al. (Reference Ingvartsen, Aaes and Andersen2001) measured a very high substitution rate (0.94) during the first weeks of lactation when the rate of increase in concentrate allowance changed from 0.3 to 0.5 kg/day. However, in their study the concentrate was high in fat and energy compared with the concentrates used in the present study and it was offered only twice a day. These differences may explain the different results. In agreement with our results, in the study of Kokkonen et al. (Reference Kokkonen, Tesfa, Tuori and Syrjälä-Qvist2004) the substitution rate was low (0.2 and 0.3) for cows fed pre partum diets containing 20% or 40% concentrate and having a fast or slow rate of increase in the concentrate allowance during the first weeks of lactation. In their study the increase of concentrate was 0.5 kg/day during the first 10 days and 0.3 kg/day thereafter for the slow rate of increase, and for the fast rate of increase it was 2 kg/day for 2 days after parturition, followed by 1 kg/day for the next 2 days and 0.5 kg/day thereafter. The final concentrate allowance was 15 kg/day. It could be that the low substitution rate during the first weeks of lactation in our study was affected by the energy status of the cows. Faverdin et al. (Reference Faverdin, Dulphy, Coulon, Vérité, Garel, Rouel and Marquis1991) showed a clear positive correlation between substitution rate and energy balance.
Weeks 1 to 15 of lactation
The concentrate composition or IR had no effect on the average DM, energy or protein intake during the first 100 days of lactation, but there were differences between treatments in silage DMI. For the S treatment, no difference in silage DMI between concentrates was noticed, but for the F treatment the silage intake was lower with the more fibrous concentrate B than A. Contrary to our results, Ala-Seppälä et al. (Reference Ala-Seppälä, Huhtanen and Näsi1988), Huhtanen et al. (Reference Huhtanen, Ala-Seppälä and Näsi1988) and Aston et al. (Reference Aston, Thomas, Daley and Sutton1994) measured increased silage intake when starchy concentrates were replaced by more fibrous concentrates. In these earlier studies the concentrate was given twice a day, whereas in our study the concentrate was given from computerized concentrate feeders during five feeding periods. Thus, it is likely that the effect of concentrate composition (starchy v. fibrous) on rumen fermentation and pH in the present study was less than in a previous study (Kaufmann, Reference Kaufmann1976; Keady and Mayne, Reference Keady and Mayne2001). It has been shown that diet NDF content is negatively correlated with DMI (Allen, Reference Allen2000). In the present study it is not likely that the higher NDF content of the FB diet was responsible for the decreased silage DMI since in the SB diet with equally high NDF content, the silage DMI was not markedly lower than in the A diets. The EE intake was higher with B than with A concentrate, which also might have a negative effect on the digestion of structural fibre (Palmquist and Jenkins, Reference Palmquist and Jenkins1980) and therefore lead to decreased silage intake. However, in the current study the amount of fat in the diet and the difference in the fat content between treatments was quite small (FA 38.7 v. FB 45.4 g/kg DM). Avila et al. (Reference Avila, DePeters, Perez-Monti, Taylor and Zinn2000) found no change in fibre digestion when diet fat content rose from 40 to 65 g/kg DM.
Milk yield and milk composition
Weeks 1 to 4 of lactation
The higher concentrate intake during the first weeks of lactation on the F treatments did not improve the milk yield compared with S treatments even though the calculated energy and protein intakes were higher for F treatments. Instead there was a significant interaction between the IR and the concentrate composition on ECM yield during the first 4 weeks of lactation. With the slow rate of increase, no difference in ECM yield between cows fed A or B concentrate was measured but with the fast rate of increase the cows fed the B diet produced more milk than the cows fed the A diet (30.0 v. 26.9 kg/day). This was associated with a higher concentrate intake in FB than in the FA diet. However, the higher concentrate intake for the FB diet led to no change in the total energy or protein intakes because of the lower silage DMI; therefore it can be assumed that the difference in ECM yield is not related to the energy and protein intakes of the cows. It is more likely a result of changes in rumen fermentation (Gordon et al., Reference Gordon, Porter, Mayne, Unsworth and Kilpatrick1995). During the first 4 weeks the starch intake was 2.76 kg/day for FB and 4.15 kg/day for FA. The high intake of starch when the FA diet was fed might have changed the proportion of individual VFAs in the rumen compared with other treatments (Keady and Mayne, Reference Keady and Mayne2001). This might have changed the partitioning of ME more to tissue and less to milk as was shown in the study of Gordon et al. (Reference Gordon, Porter, Mayne, Unsworth and Kilpatrick1995) with increasing starch intake. In agreement with this hypothesis the calculated kl value was lower for FA treatment compared with other treatments during the first weeks of lactation.
Although there were no significant differences in the development of BCS, the calculated energy balance and apparent efficiency of ME utilization for milk production indicated that it was possible to decrease the mobilization of body reserves by a faster rate of increase in concentrate allowance during the first weeks of lactation. Consistent with these calculations there was a tendency (P = 0.067) towards a higher milk fat concentration during the first 4 weeks of lactation for S compared with F treatments. This indicates higher body fat mobilization for S than for F treatments, since at the beginning of lactation mobilization of fat reserves produces a large source of fatty acids for milk fat synthesis (Bell, Reference Bell1995).
Weeks 1 to 15 of lactation
Despite the longer period of negative energy balance at the beginning of lactation for the S treatment group, the average milk production during the first 100 days of lactation was not affected by IR. The average ECM, fat and protein yields during the first 100 days of lactation were even higher with the slow than with the fast rate of increase in the concentrate allowance. This difference was, however, mostly due to the lower milk yield of cows fed the FA diet. Consistent with our results, Ingvartsen et al. (Reference Ingvartsen, Aaes and Andersen2001) also measured no difference in the milk yield of cows having different rates of increase in concentrate allowance in early lactation. In their study the final daily allowance of the concentrate was 8.8 kg and the daily increase was 0.3 kg with the slow (26 days) and 0.5 kg with the fast (15 days) rate of increase.
The cows fed concentrate B compared with concentrate A had a higher milk yield and tended (P = 0.09) to have a higher ECM yield during the whole experiment. The difference between concentrates was seen more with a fast increase than with a slow increase in concentrate allowance. In agreement with our results, Ala-Seppälä et al. (Reference Ala-Seppälä, Huhtanen and Näsi1988) and Mäntysaari et al. (Reference Mäntysaari, Khalili, Sariola and Rantanen2007) measured higher milk yields with fibrous than with starchy concentrate. On the contrary, Keady et al. (Reference Keady, Mayne, Fitzpatrick and Marsden1999), Keady et al. (Reference Keady and Mayne1998) and Sloan et al. (Reference Sloan, Rowlinson and Armstrong1988) measured no difference in milk yields with decreasing amounts of starch in the concentrate. In the current study, the higher milk yield for B than for A treatment cannot be explained by differences in DMI or energy intake, because no differences in DMI or calculated ME intake were observed. As in the beginning of the lactation, the increase in milk yield of the cows fed B diets compared with A diets may be associated with changes in the proportion of individual VFA produced in the rumen. In the study of Keady and Mayne (Reference Keady and Mayne2001), the proportion of acetate decreased and propionate increased in the rumen VFA when the level of starch in the concentrate was decreased. An increased supply of propionate increases hepatic gluconeogenesis and can lead to increases in lactose synthesis and milk production. In the present study, the apparent efficiency of ME utilization for milk production across the whole experimental period was higher for B than for A diets (0.574 v. 0.537; P < 0.05), indicating that cows fed the B diet allocated proportionally more ME to milk.
The difference in milk production between A and B treatments might be partly supported by the differences in the protein source and AAT intake between the concentrates. In some studies it has been shown that an increased intake of rapeseed meal can increase the plasma concentration of histidine (Rinne et al., Reference Rinne, Jaakkola, Varvikko and Huhtanen1999; Shingfield et al., Reference Shingfield, Vanhatalo and Huhtanen2003), which has been identified as the first limiting amino acid on grass silage-based diets (Vanhatalo et al., Reference Vanhatalo, Huhtanen, Toivonen and Varvikko1999). In the study of Vanhatalo et al. (Reference Vanhatalo, Huhtanen, Toivonen and Varvikko1999), an increased intake of histidine resulted in an enhancement of both milk and milk protein yields. In our study, however, the milk protein yield was not significantly affected by the concentrate. In the present study, both concentrates included rapeseed protein, in concentrate A 245 g/kg CP and in concentrate B 371 g/kg CP was from rapeseed meal or cake. Thus, it is obvious that the concentrate protein source made only a minor or no contribution to the differences in milk production on A and B treatments.
The milk protein content was lower for treatment B than for A across the whole experimental period. Consistent with our results, lower milk protein concentration was reported in other studies (Keady et al., Reference Keady and Mayne1998 and 1999; Mäntysaari et al., Reference Mäntysaari, Khalili, Sariola and Rantanen2007) when a starchy concentrate was replaced with a more fibrous concentrate with higher fat content. In the study of Keady et al. (Reference Keady, Mayne, Fitzpatrick and Marsden1999), the higher milk protein content with increased concentration of starch in the concentrate was reported to be due to the improved microbial protein synthesis. In the present study, the response of 0.58 g milk protein concentration per kg increase in starch for F treatments was of the same magnitude as in the studies of Keady et al. (Reference Keady, Mayne and Marsden1998 and Reference Keady, Mayne, Fitzpatrick and Marsden1999). For S treatments the response was higher, i.e. 0.81 g milk protein per kg increase in starch intake.
Conclusions
A fast rate of increase in concentrate allowance after calving increased the energy and nutrient intake of the cows during the first weeks of lactation compared with a slow rate of increase. Since the milk production was not markedly affected by the rate of increase, the energy balance in early lactation was improved for F treatments. This, however, had no positive effect on the milk production of the cows during the whole 100-day experiment. Instead, across the whole experimental period ECM yield was higher for S than for F treatment and tended to be higher with concentrate B than with A.
Acknowledgements
The authors thank the staff of Minkiö Research Farm for excellent care of the experimental animals. The study was partly supported financially by the Finnish Ministry of Agriculture and Raisio Feed Ltd.