



Introduction
There are many applications of kilovoltage X-rays in radiotherapy, including the treatment of basal or squamous cell carcinomas of the skin and the palliative irradiation of bone metastases.Reference Bratherton1, Reference McLelland and Chu2 Kilovoltage therapy beams have been conventionally separated into low-energy or superficial X-rays and medium-energy or orthovoltage X-rays.Reference Klevenhagen, Aukett, Harrison, Moretti, Nahum and Rosser3 Superficial X-rays are used to treat tumours on the skin, where the intended treatment region is within the first 5 mm beneath the skin surface. The decrease in dose with depth is much less for X-rays (than for electrons); therefore, structures under the treated volume receive a higher dose. For anatomical sites such as hands, legs and thighs this is not critical. However, when cartilage is the underlying tissue, a sharp decrease of electron beams is preferred. Superficial therapy using potentials of 50–160 kV with typical filtration provides beams with half-value layers (HVLs) in the range of 1–8 mm Al.
The HVL or 1st HVL describes the penetrative ability of clinical beams and is usually expressed as the thickness of material required to reduce the dose rate measured by the dosemeter to half of its original value. As clinical beams are not monoenergetic, the increasing thickness of the absorbing material will remove the lower energies preferentially, and consequently the beam will become more penetrating (or harder). As a result, the attenuation will not follow a exponential relationship, and the thickness required to reduce the dose rate to a quarter of its original value (2nd HVL) will be greater than twice the amount required to reduce it to 50%. Superficial X-ray beam characteristics are suitable for treatment of sites up to 5 mm depth in terms of delivery of 90% of the surface dose.
During the last 2 decades, there has been growing interest in using Monte Carlo (MC) simulation for modelling different low- and medium-energy X-ray units.Reference Hill, Healy, Holloway, Kuncic, Thwaites and Baldock4 Verhaegen et al.Reference Verhaegen, Nahum, Van de Putte and Namito5 used the EGS4/BEAM and the MCNP4B code systems to simulate a constant potential Philips MCN421 X-ray unit (PHILIPS, Hamburg, Germany). The primary electron beam, the focal spot size, the bremsstrahlung target, the exit window and the collimator and added filtration were modelled according to the manufacturer’s specifications. They compared, measured and calculated photon fluence spectra and HVL values. Their results showed that both EGS4/BEAM and MCNP4B, in their default versions, inadequately handle the production of characteristic X-rays. This was found to have only a minor influence on the calculated dosimetric quantities. In addition, simulations with MCNP4B required the use of several variance-reduction techniques (VRTs) in order to obtain results within reasonable calculation times.
Bhat et al.Reference Bhat, Pattison, Bibbo and Caon6 measured off-axis X-ray spectra from a constant potential X-ray generator with a high-purity germanium spectrometer. The measured spectra were compared with off-axis X-ray spectra calculated using the MC EGS4 code system. In this study, the EGS4 code system was found to produce off-axis bremsstrahlung X-ray spectra, which agreed well with the spectra measured at three emerging angles. The study concluded that the EGS4 code system was able to produce X-ray spectra for a combination of target materials.
Mercier et al.Reference Mercier, Kopp, McDavid, Dove, Lancaster and Tucker7 discussed modifications to MCNP4b2 and benchmarking of a new MCNP-DMP version, specifically suitable for applications in diagnostic radiology. An iterative procedure has been used to derive bremsstrahlung cross-sections and electron impact ionisation cross-sections in tungsten for the production of K X-rays from accurately measured X-ray spectra. The characteristic X-rays arise from transitions between different atomic shells. A K X-ray arises from a transition to the K shell from an outer shell and so on. Using these new data, MC-calculated spectra were compared with measured spectra for an X-ray unit of completely different design, and excellent agreement was obtained demonstrating the importance of the improvements made in the basic data.
Ay et al.Reference Ay, Shahriari, Sarkar, Adib and Zaidi8 used the general-purpose MC N-particle radiation transport computer code (MCNP4C) for the simulation of X-ray spectra in diagnostic radiology and mammography. Both bremsstrahlung and characteristic X-ray production were considered in this work. They simulated various target/filter combinations to investigate the effect of tube voltage, target material and filter thickness on X-ray spectra in the diagnostic radiology and mammography energy ranges. The simulated X-ray spectra were compared with experimental measurements and spectra calculated by IPEM report number 78.Reference Cranley, Gilmore, Fogarty and Desponds9 Their results showed good agreement between the simulated X-ray and comparison spectra, although there are systematic differences between the simulated and reference spectra, especially in the K-characteristic X-ray intensity. Nevertheless, no statistically significant differences have been observed between IPEM spectra and simulated spectra.
Mainegra-Hing and KawrakowReference Mainegra-Hing and Kawrakow10 used BEAMnrc for modelling the Comet MXR-320 X-ray system (COMET, Connecticut, USA). They mainly investigated and compared a new VRT called directional bremsstrahlung splitting (DBS), when applied to the simulation of X-ray machines, with a previous technique known as uniform bremsstrahlung splitting (UBS). In order to verify the ability of BEAMnrc to model the X-ray tube, a comparison of calculated and measured HVLs for the Comet MXR-320 X-ray tube (COMET, Connecticut, USA) was studied. The study showed that simulations performed with DBS are five or six orders of magnitude more efficient at 50 or 135 kV tube potential compared with simulations without DBS and are 60 times more efficient compared with UBS. The agreement between simulated and measured HVLs at different constant tube potentials was found to be better than 2·3%.
Knöös et al.Reference Knöös, Munck Af Rosenschold and Wieslander11 performed simulations with the EGSnrc code package of an orthovoltage X-ray machine. The BEAMnrc code was used to transport electrons, produce X-ray photons in the target and transport these through the treatment machine down to the exit level of the applicator. Further transport in water-based or computed tomography-based phantoms was facilitated by the DOSXYZnrc code. Calculated depth dose and profile curves have been compared against measurements and show good agreement except at shallow depths. They concluded that the MC model tested in their study can be used for various dosimetric studies as well as for generating a library of typical treatment cases that can serve as both educational material and guidance in clinical practice.
Chica et al.Reference Chica, Anguiano and Lallena12 benchmarked the MC code PENELOPE for X-ray beams with energies between 30 and 300 keV. The results of different simulations performed with PENELOPE were compared with those obtained with a semi-empirical computational model and with experimental measurements. HVL indices obtained from the attenuation curves for Al and Cu and depth dose curves in water have been considered for this comparison. A good agreement has been reached on what guarantees the feasibility of the code.
The main purpose of this study was to investigate whether it was possible to reproduce measured data for a superficial X-ray unit with simulations using the MC BEAMnrc code version V4 2·4·0.Reference Rogers, Faddegon, Ding, Ma, Wei and Mackie13, Reference Rogers, Walters and Kawrakow14 A detailed description of the basic components of the therapy unit was examined, and this allowed us to calculate their contribution to the energy spectrum of the particles that reached the scoring region. Comparison between MC simulations and experimental measurements was carried out to validate the simulation.
Materials and methods
The XSTRAHL 150 X-ray unit
The superficial X-ray unit modelled in this study is the XSTRAHL 150 (Xstrahl Limited, Camberley, UK), a kilovoltage therapy unit that encompasses low- (50–80 kV) and medium-energy (80–150 kV) X-ray beams. The components of the unit include a microprocessor-based control console, a high-tension generator, a water cooling system, a metal ceramic X-ray tube, a set of filters and a set of applicators. Table 1 summarises the tube specifications of the XSTRAHL 150 unit.
XSTRAHL 150 X-ray tube specifications
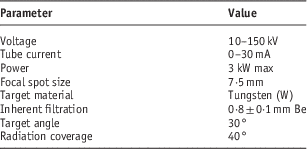
Additional filtration can be introduced to modify beam quality. The XSTRAHL 150 unit uses an encoding system to detect treatment filters within the filter storage unit. Each system can have up to nine filters, eight clinical filters and one ‘warm-up’ filter. The warm-up filter is constructed of 2 mm of lead. The eight clinical filters can be constructed from a maximum of three materials and up to a maximum physical thickness of 4 mm. Each filter has a unique place in the filter storage unit due to mechanical shaping of the storage unit and the filter holders. The filter selection must be confirmed before treatment delivery. In our department, we currently use eight clinical filters. The ninth filter, which is designed for warm-up of the X-ray tube, was not included in this study. Table 2 shows the characteristics of the eight clinical filters used in this study, in addition to the ‘warm-up’ filter.
Filter characteristics used in the XSTRAHL 150 X-ray unitFootnote a
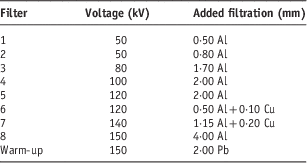
a The filters are manufactured to customer specifications.
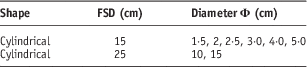
Beam sizes are established by stainless-steel applicators, with a clear Perspex-viewing end, fixed at the tube head. Eight clinical applicators are provided with the XSTRAHL 150 unit. The standard range of applicators supplied with the XSTRAHL 150 unit to our department is given in Table 3.
Applicator characteristics
BEAMnrc modelling of the XSTRAHL 150 X-ray unit
The computer modelling of the XSTRAHL 150 X-ray unit reported here was performed by the BEAMnrcReference Rogers, Faddegon, Ding, Ma, Wei and Mackie13, Reference Rogers, Walters and Kawrakow14 user code from the EGSnrc MC simulation system of photon and electron transport.Reference Kawrakow15, Reference Kawrakow, Mainegra-Hing, Rogers, Tessier and Walters16 BEAMnrc was designed primarily for modelling electron and photon beams from radiotherapy linear accelerators (linacs), but it can also be used to simulate photon beams from Cobalt-60 and kilovoltage X-ray units. BEAMnrc has several advantages that make it attractive for simulating kilovoltage X-ray units. These include the following: the accurate low-energy physics in the code, the multitude of VRTs available in BEAMnrc, the BEAMnrc’s adoption of the most accurate photon and charged particle cross-sections. In addition, BEAMnrc has many component modules (CMs) that can be used to accurately represent the various components of a kilovoltage X-ray unit. These CMs are re-usable and are all completely independent. They communicate with the rest of the system in well-specified ways. A CM can be considered as a block that has a ‘front’ surface and a ‘back’ surface. The X-ray unit can be built with many such blocks. Very often, there is a gap between two blocks. This gap is automatically filled with air by the BEAMnrc main routine, which is consistent with the case of a real X-ray unit.
The main CMs used in this study are XTUBE, SLABS and PYRAMIDS. The XTUBE component is used for the simulation of the X-ray tube target. It is the first CM in the geometry. The distance to the reference plane is zero. The SLABS component is used for the simulation of multiple planes of arbitrary thickness and material. SLABS has square symmetry about the central axis. In this study, SLABS was used to simulate the exit window and the filter assembly of the X-ray unit. The PYRAMIDS CM is used to model pyramid-shaped structures comprising one or more layers in the path of the X-ray beam. Each layer has three distinct regions: the central region (the pyramid), the surrounding region (the walls of the pyramid) and the outer region (beyond the outer edges of the layer). The central and outer regions default to air, but can also be filled with a user-defined medium (assumed the same for the central and outer regions within a layer). In this study, PYRAMIDS was used for modelling the applicators of the X-ray unit. This CM has a square outer boundary centred on the beam axis. All simulations were carried out on an ASUS laptop incorporating an Intel® CoreTM i7-2670QN processor with 2·10 GHz speed and 16 GB DDR3 RAM.
The current simulation was a three-step process. In the first step, simulations were carried out for the source, source housing, the exit Be window and the added filter. A total of 5×10⁸ monoenergetic electrons were transported in the target down to an energy of 1 keV. This number of incident electrons is necessary to produce photons with a maximum uncertainty <2%. The photon transport cut-off energy was 1 keV. In a real situation, there is a voltage ripple, which is <2% for a high-frequency generator. However, in our simulations, we have considered a constant energy for the emitted electrons and the voltage ripple was not considered because of its small magnitude. The electrons will interact with the anode target material and emit X-rays. The emitted X-ray beam is then subjected to the X-ray tube window (inherent filtration) and additional filtration. The results of the simulation were stored as a phase-space (PHSP) file, containing information about the position, direction and energy of each particle crossing the additional filtration. The PHSP file was scored over a diameter of 10 cm and contains about 50×106 particles from which X-ray beam spectra data were derived using the BEAMdp code within BEAMnrc. The scoring area of the PHSP file depends on the geometry of the simulated X-ray unit and can be changed by the user. In this study, the 10 cm scoring area was sufficient to collect the simulated particles with a good uncertainty of <2%. Figure 1 shows the geometry of the experimental setup used for MC simulation of X-ray spectra and other parameters investigated in this study.
Schematic representation of the tube geometry (not to scale) used in the Monte Carlo simulation. The thickness of the additional filtration depends on the type of the simulated filter, which is given in Table 2. Similarly, the dimensions of the clinical applicator depend on the simulated applicator, which are given in Table 3.

In step II, simulation was performed using the PHSP file generated in step I at the top of the clinical applicator. Step II had to be repeated for each new field size. Typically, for a 10×10 cm2 field simulation, 150×106 histories are processed. This computation resulted in the generation of a PHSP file at the top of the water/slab phantoms.
In step III, the PHSP file from the previous step was given as input to the DOSXYZnrc programme,Reference Walters, Kawrakow and Rogers17 which continues the transport of PHSP particles into the phantom defined as three-dimensional (3D) voxels of size 2·5×2·5×5·0 mm3. The 5-mm grid size was in the direction of depth. Typically, this process computed 90×106 histories. From the 3D dose matrix generated by DOSXYZnrc, percentage depth dose (PDD) and beam profile data were derived.
To enhance the efficiency of the calculations in our simulations and to reduce the computational time associated with simulations, two VRTs available in the EGSnrc/BEAMnrc code were used.Reference Mainegra-Hing and Kawrakow10, Reference Ali and Rogers18 These VRTs are bremsstrahlung cross-section enhancement and DBS. Both techniques are known to increase the efficiency of energy transition from the electron current to X-ray photons. When applying these two techniques, it usually takes about 1 minute on the Intel® CoreTM i7-2670QN processor to simulate the XSTRAHL 150 X-ray tube to an average uncertainty of 2% on photon fluence. Longer simulation times (5–10 minutes) yield better and more uniform statistical fluctuations.
For all simulations performed, binding effects and Doppler broadening are taken into account in the simulation of Compton scattering. Electron impact ionisation (EII) and the relaxation cascade of inner-shell vacancies created during photoabsorption, which leads to the emission of characteristic X-rays, are turned on. NIST and XCOM tabulation of cross-sections were also used. An example of an input file used for the simulation of the X-ray tube is given in Appendix 1.
SpekCalc software
X-ray spectra were also calculated using SpekCalc software.Reference Poludniowski, Landry, DeBlois, Evans and Verhaegen19 SpekCalc was created using REALbasic (REAL Software Inc., Texas, USA). The Graphical User Interface (GUI) of the software allows the user to calculate, display and save the X-ray spectra emitted from a tungsten anode X-ray tube. The user selects the tube potential in kV, the anode angle and the amount of filtration. Several beam qualifiers are provided, such as the 1st and 2nd HVL, in millimeter of both Al and Cu. The mean energy of the spectrum, E mean, and the effective energy, E eff, in kiloelectron volt, are also shown. In addition, the estimated bremsstrahlung and characteristic contributions to the tube output (μGy/mAs at 1 m) are displayed. Filtration can be selected in millimeter for seven materials: Al, Cu, W, Sn, Be, water and air. The range of potentials that can be modelled is wide, such as tube potential of 40–300 kV and anode angles of 6–30°, making the utility useful to both the diagnostic imaging and superficial/orthovoltage radiotherapy fields.
Experimental measurements
The experimental procedure described in this study include the following: experimental measurements of different X-ray spectra, beam 1st and 2nd HVL measurements, PDD measurements and beam profile measurements. It is important to mention here that we have used different ionisation chambers for different energies during the experimental measurements of the beam 1st and 2nd HVLs and PDD. The choice of the ionisation chamber depends on the energy of the incident X-ray beam. The chamber window thickness should be sufficient to allow full buildup of the secondary electron spectrum. Several international codes of practice for radiation dosimetry, such as the IPEMP code of practice,Reference Klevenhagen, Aukett, Harrison, Moretti, Nahum and Rosser3 the AAPM TG-61Reference Ma, Coffey and DeWerd20 and the IAEA TRS 398,21 recommend the use of a plane-parallel ionisation chamber for low-energy X-ray dosimetry and a Farmer-type cylindrical chamber for medium-energy X-rays.
Measurements of X-ray spectra
Measurements of X-ray spectra were recorded using the GEM10-70/CFG-SV-70/DWR-30 Coaxial HPGe Detector System (ORTEC, Oak Ridge, USA) situated 1 m from the X-ray source. The electronic system of the spectrometer included a preamplifier, cryostat, liquid nitrogen dewar and 3·66 m cable pack. This type of detector presents high detection efficiency because of the thickness of the crystal and excellent charge transport property because of its high purity. The corrections to primary X-ray transmission, secondary X-ray escape, K-fluorescent X-rays and Compton-scattered X-rays from the crystal are usually carried out using the stripping method,Reference Matsumoto, Yamamoto, Honda, Taniguchi and Kanamori22 which was also applied in this work. In order to take the measurements, the detector was positioned at a distance of 1 m from the X-ray source, and to reduce the pulse pileup effect the X-ray beam was collimated in the centre of the detector using a lead cylinder, situated around the detector with an aperture of 2 mm. The pileup effect occurs when two or more events occur so close in time, or simultaneously, and the detection system understands that they constitute a single event, with an effective energy that is different from the energy of a single isolated event. In this case, the measured event rate is lower than the true value and the shape of the energy spectrum is distorted from the true energy spectrum. The program system HEPROReference Matzke23 was used to obtain the photon fluence spectra from the pulse-height spectra measured, taking into account the variation of the detector efficiency with the energy of the detected photons.
HVL measurements
Beam HVL was measured in accordance with the AAPM TG-61 protocolReference Ma, Coffey and DeWerd20 using a horizontal beam axis geometry. For kilovoltage beams, it is accepted practice to express beam quality in terms of the HVL. This describes the ability of the beam to penetrate tissue and is directly linked to the most clinically important characteristic of the beam. For clinical beams, an indication of kV and HVL is recommended as a specification of beam quality. The attenuator was positioned at a distance of 49 cm from the focus, and the ionisation chamber was positioned at a distance of 51 cm from the attenuator. The attenuator material was made of aluminium sheets of high purity (99·9%) with variable thicknesses ranging from 0·1 to 5·0 mm. A collimating aperture of 1·5 cm diameter, using a 2-mm-thick piece of lead, was positioned in the middle, between the focus and the ionisation chamber. A parallel-plate PTW chamber type 23342 connected to a PTW 10001 UNIDOS electrometer (PTW, Freiburg, Germany) was used for the air-kerma measurement. Both 1st HVL and 2nd HVL were measured, and the homogeneity coefficient (HC=1st HVL/2nd HVL) was calculated. To guarantee narrow-beam geometry, the smallest applicator (Φ=1·5 cm) was used. The correct alignment of the source, the collimating aperture and the chamber was checked with a therapy verification film. There was no scattering material within 1 m from the chamber. HVL measurements were repeated for medium-energy filters using a PTW M30013 Farmer-type cylindrical chamber (PTW).
PDD measurements
PDD measurements were recorded for each filter applicator combination. PDD normalisation was performed at the depth of maximum dose. For low-energy X-ray beams, measurements were taken using the PTW M23342 chamber and a polymethyl methacrylate (PMMA) slab phantom. The dimensions of the PMMA phantom are 15×15×12 cm3, with slab thicknesses of 1, 5 and 10 mm as used. Measurements were recorded from the surface to a depth with a PDD value of about 10–15% in steps of 1, 2 or 5 mm (smaller steps in the higher dose gradient zone). For medium-energy X-ray beams, measurements were recorded using a PTW M30013 Farmer-type chamber, a PTW TW31002 flexible cylindrical chamber and a water phantom. The dimensions of the water phantom were 40×40×45 cm3. Measurements were recorded from 5 mm depth to ~15 cm depth (PDD value of about 10–15%) in 5 or 10 mm steps (smaller steps in the higher dose gradient zone).
Beam profiles measurements
Beam profiles were measured for each applicator and filter using wrapped Kodak X-Omatic films connected to the end of the applicator and supported on a thick block of pressed wood. The beam profiles were obtained using a transmission densitometer (DT 1505) in the anode cathode axis direction (cross-plane scans, labelled AB) and in the perpendicular direction (in-plane scans, labelled GT) normalising at the central-axis point. Results were expressed by means of a graphical representation of the BEAMnrc-simulated and experimentally measured beam profiles. The graphical depiction gave a visual indication of the intensity across the field with the intensity normalised at the beam centre for each field size.
In an ideal dose profile, beam profiles are flat between 0 and 100% at the central axis of the radiation field. Any target present within the central region of the radiation field will receive a constant dose from the target centre to the edge of the target. In a real dose profile, beam profiles are flat between 0 and 80% at the central axis. Only targets present within the central region of the 0 to 80% will receive a uniform dose. Therefore, uniformity was assessed over 80% of the geometrical field width. A parameter called Flatness was defined as:
 $${\rm Flatness}={{\rm OD_{{max}} {\minus}OD_{{min}} } \over {\rm OD_{{max}} {\plus}OD_{{min}} }} {\times}\left( {100} \right)$$
where ODmax and ODmin are the maximum and minimum optical densities within 80% of the field size, respectively. Graphical profiles were used in assessing the profile changes as the graphs conveyed a large amount of visual information.
Results and discussion
Comparison of X-ray spectra
Figures 2–5 show the comparisons of BEAMnrc-simulated X-ray spectra with the spectra produced using SpekCalc software and experimentally measured spectra for filters 2, 3, 6 and 7, respectively. The uncertainty achieved in the figures by simulating 5×10⁸ electrons is ∼1%. For the qualitative comparison between the calculated and measured spectra, the obtained spectrum for each of the methods was normalised to the total number of photons in the spectrum and then divided by photon energy to give the number of photons per energy interval, which is 1 keVReference Ay, Shahriari, Sarkar, Adib and Zaidi8.
Comparison of X-ray spectra generated using the BEAMnrc simulation, the SpekCalc model, with experimentally measured spectrum for 50 kV tube voltage and 0·8 mm Al added filtration.
Comparison of X-ray spectra generated using the BEAMnrc simulation, the SpekCalc model, with experimentally measured spectrum for 80 kV tube voltage and 1·7 mm Al added filtration.
Comparison of X-ray spectra generated using the BEAMnrc simulation, the SpekCalc model, with experimentally measured spectrum for 120 kV tube voltage and 0·5 mm Al+0·1 mm Cu added filtration.
Comparison of X-ray spectra generated using the BEAMnrc simulation, the SpekCalc model, with experimentally measured spectrum for 140 kV tube voltage and 1·15 mm Al+0·2 mm Cu added filtration.
It can be seen from Figures 2–5 that there were good agreements between the BEAMnrc-simulated spectra, spectra produced by the SpekCalc software and experimentally measured spectra. This agreement can be attributed to the implementation of the EII process subroutine into the latest version of the BEAMnrc code used in our study. This version of the code has the ability to explicitly simulate the creation of inner-shell vacancies by electron or positron impact for all K- and L-shells with binding energies above 1 keV. This option can be turned on by setting the parameter EII found in GUI of the BEAMnrc code to ‘ON’ state. It has been shown by Verhaegen et al.Reference Verhaegen, Nahum, Van de Putte and Namito5 that the older version of the EGS4 code used in their study had failed to predict peak heights of characteristic X-rays due to the absence of the EII implementation in the code.
Comparison of beam qualities
The values of the 1st and 2nd HVL as well as the HC for each filter are shown in Table 4 for both experimental measurements and MC calculations. Filters 1, 2, 3 and 4 belonged to low-energy kilovoltage X-ray beams and filters 5, 6, 7 and 8 to medium-energy kilovoltage X-ray beams. For filters 5, 6, 7 and 8, for which the HVL was measured with two different chambers, the measured HVL was the same within the uncertainty of the measurement. Comparisons show that measured values and MC-calculated values are in good agreement. The maximum difference between BEAMnrc and measurement was 3·6%, whereas the minimum difference was 2·3% for the eight filters examined. The good agreement between the HVLs calculated from the measured or MC-calculated spectra is not surprising in view of the good agreement between the photon spectra (Figures 2–5). The MC calculations yield slightly lower HVLs because of the MC spectra being slightly less intense than the measured ones.
Values of the 1st, 2nd half-value layer (HVL) and homogeneity coefficient (HC) for each filter obtained by experimental measurements and Monte Carlo (MC) calculations
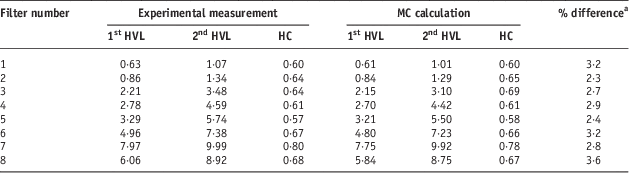
a % difference={(1stHVLmeasurement − 1stHVLcalculation)/1stHVLmeasurement}%.
Comparison of PDD curves
Figures 6–9 show examples of PDD curves obtained from experimental measurements and BEAMnrc calculations. Percentage differences between measured and simulated PDD values were obtained using the well-known relative percentage difference equation. The value of the reading at the surface for medium-energy X-rays was determined by a polynomial extrapolation of the measured depth ionisation distribution, with a polynomial regression coefficient better than 0·9999 in all cases. For all comparisons, the simulated PDDs agreed with measurements within 2% at all points.
Measured and simulated percentage depth dose curves for filter 2 (50 kV, 0·8 mm Al).
Measured and simulated percentage depth dose curves for filter 3 (80 kV, 1·7 mm Al).
Measured and simulated percentage depth dose curves for filter 6 (120 kV, 0·5 mm Al+0·1 mm Cu).
Measured and simulated percentage depth dose curves for filter 7 (140 kV, 1·15 mm Al+0·2 mm Cu).
Comparison of beam profiles
Figures 10–12 show examples of beam profiles obtained from experimental measurements and BEAMnrc calculations. For the 15-cm-diameter applicator, the shape of the beam profile (Figure 10) demonstrated a good agreement between simulated and measured uniformity of the beam. In the cross-plane direction, the intensity fall from the right side to the left side is likely due to the heel effect for both simulated and measured beam profiles. The same effect is true for the in-plane scans. For the smaller 5-cm field size, the profiles in Figure 11 also show the heel effect and agreement in uniformity. Similar observations were noticed for the 2 cm applicator (Figure 12). The heel effect becomes more evident when the field size increases. The dependence of this effect with kilovoltage is expected because the same tube is used over a wide range of voltages.Reference Klevenhagen and Thwaites24 This dependence, although the X-ray tubes were different, was also reported for the Therapax DXT 300 by Aukett et al.Reference Aukett, Thomas, Seaby and Gittins25 and Gerig et al.Reference Gerig, Soubra and Salhani26 and for the Gulmay D3300 by Evans et al.Reference Evans, Moloney and Mountford27 Both simulated and measured field sizes for the applicators with diameters ranging from 1 to 5 cm agreed within 5%. For the 10- and 15-cm-diameter applicators, the agreement between simulations and measurements was 3%.
Comparison of measured (solid line) and simulated (dashed line) beam profile for a 15-cm-diameter applicator for filter 2 (50 kV, 0·8 mm Al).
Comparison of measured (solid line) and simulated (dashed line) beam profile for a 5-cm-diameter applicator for filter 2 (50 kV, 0·8 mm Al).
Comparison of measured (solid line) and simulated (dashed line) beam profile for a 2-cm-diameter applicator for filter 2 (50 kV, 0·8 mm Al).
Conclusion
This study used the BEAMnrc MC code for simulating a superficial X-ray unit. Several beam characteristics were modelled and compared with experimental measurements. No high differences between simulated X-ray spectra and measured spectra were noted. Good agreement was obtained between MC-calculated HVLs and experimental HVLs for all beam qualities and was <3·6%. Measurements of PDD datasets for each tube kV and filter combination and each applicator are strongly recommended, because in some cases the information cannot be found in the literature. As we could not take measurements at the surface for medium-energy X-ray qualities, the value of the reading at the surface was obtained by using a mathematical extrapolation of measured data at other depths. Although the simulation of the complete X-ray unit is time-consuming, the generated data in this work provide detailed information about particles’ interaction in different kilovoltage and filter combinations. This information is useful for X-ray tube design and development of new target/filter combinations in order to improve beam quality in superficial radiotherapy. The data presented here may provide a base for comparison and a reference for other or potential new users of the XSTRAHL 150 X-ray unit.
Acknowledgements
None.
Conflicts of Interest
None.
Appendix 1
The following example describes a tungsten target, 1-mm thick, mounted on a copper holder. The target is angled at 30° with respect to the z-axis. It spans 3·7 cm in the z direction. The medium in front of the target is air. ECUT and PCUT for all regions are set to 0·521 and 0·01, respectively.



