INTRODUCTION
The New Zealand aquaculture sector has set a target to achieve annual sales of NZD $1 billion by 2025 (Carter, Reference Carter2012), more than doubling current revenues. Alongside adding value to existing aquaculture species (e.g. salmon, Pacific oysters, Greenshell™ mussels), another strategic priority to accomplish this goal is to identify new shellfish species with commercial potential and develop techniques for their production (Carter, Reference Carter2012). Geoducks are a high value species, currently selling for up to USD $200–300 per kg in Asian restaurants (Shamshak & King, Reference Shamshak and King2015). The endemic geoduck clam Panopea zelandica (Quoy & Gaimard, 1835) has been chosen as an emerging species for aquaculture within this strategy (King, Reference King2010). Panopea zelandica populations have been found in both North and South islands of New Zealand (Breen et al., Reference Breen, Gabriel and Tyson1991; Gribben et al., Reference Gribben, Helson and Millar2004). However, the wild fishery is unlikely to fulfil potential market demands sustainably (see review in Gribben & Heasman, Reference Gribben and Heasman2015). Thus, geoducks have become an object of significant aquaculture research and development.
The success of any shellfish aquaculture depends on the availability of seed/spat to stock farms. For many bivalves, such as mussels and oysters, intensive recruitment of wild juveniles onto spat-catching ropes or frames can result in a relatively efficient way to obtain wild seed to supply the farms (Buestel et al., Reference Buestel, Ropert, Prou and Goulletquer2009; Alfaro et al., Reference Alfaro, McArdle and Jeffs2010). However, geoduck spat do not attach or cement to substrates but bury in sand. This attribute makes it practically impossible to collect wild geoduck spat; hence, the geoduck aquaculture industry must rely on hatchery-based spat production.
Successful embryo development is critical for reliable spat production. The yield of embryos can be substantially affected by the ratio of sperm:egg during fertilization (Dong et al., Reference Dong, Yao, Lin and Zhu2012). For example, low sperm:egg ratios can reduce the probability of gamete contact, while high ratios can increase the risk of polyspermy (Gribben et al., Reference Gribben, Millar and Jeffs2014). Polyspermy can then cause dissolution of egg membranes and abnormal embryo development (Stephano & Gould, Reference Stephano and Gould1988; Clotteau & Dubé, Reference Clotteau and Dubé1993; Encena et al., Reference Encena, Capinpin and Bayona1998). Abnormal embryos either terminate prior to the shell development or result in deformed D-larvae, which cannot survive to the pediveliger stage. Hence, it is important to determine the optimal sperm:egg ratio so that polyspermy can be avoided without compromising fertilization ratios. This optimal ratio varies among different bivalve species. For example, a sperm:egg ratio of 10,000:1 is optimal for the cockle Clinocardium nuttallii (Liu et al., Reference Liu, Alabi and Pearce2008), whereas 1000:1 is optimal for the oysters Crassostrea virginica and Crassostrea gigas (Alliegro & Wright, Reference Alliegro and Wright1985; Stephano & Gould, Reference Stephano and Gould1988), and a ratio of ≤200:1 is ideal for the blood clam Tegillarca granosa (Dong et al., Reference Dong, Yao, Lin and Zhu2012).
Although the hatchery production of Pacific geoduck (Panopea generosa) spat is commercially well-established in the USA and Canada, limited information on optimal sperm:egg ratios has been released. In a study to investigate the production of triploid P. generosa, Vadopalas & Davis (Reference Vadopalas and Davis2004) successfully used a sperm:egg ratio of 40:1. More recently, in New Zealand, Gribben et al. (Reference Gribben, Millar and Jeffs2014) conducted a comprehensive study to investigate the fertilization kinetics of P. zelandica, and recommended a broad sperm:egg ratio of 5,000–50,000:1 for hatchery production with fresh gametes (<30 min old), a starting egg density of 20 eggs ml−1, and a sperm-egg contact time of 5–10 min. Under these conditions, greater sperm densities resulted in high percentages of polyspermy and poor fertilization success. While the fertilization kinetics model provided highly valuable information, the suggested gamete age and sperm-egg contact time by Gribben et al. (Reference Gribben, Millar and Jeffs2014) may not be feasible for commercial hatchery operations. It is well-established that gamete age and sperm-egg contact time considerably affects fertilization success and the optimal sperm:egg ratio (Stephano & Gould, Reference Stephano and Gould1988; Levitan, Reference Levitan2006). A more practical commercial scenario would be to cold-store gametes for up to 2 h, enabling a sufficient number of eggs to be used (Adams et al., Reference Adams, Smith, Roberts, Janke, Kaspar, Tervit, Pugh, Webb and King2004), and then to provide sperm-egg contact times of >30 min in order to evaluate fertilization success as is routine with other bivalve species (Helm et al., Reference Helm, Bourne and Lovatelli2004). Thus, there is a need to determine the optimal P. zelandica sperm:egg ratio for commercial fertilization purposes.
Fundamental biological knowledge of embryonic and larval development can be an important source for phylogenetic theories and for the hatchery culture of bivalves. Bivalve embryogenesis has two notable features that relate to organ development and shell formation of early larvae (Kin et al., Reference Kin, Kakoi and Wada2009). The cleavage pattern feature determines the normal development of embryos, and consequently the normal development of organs, such as the velum, mouth, apical tuft and stomach in D-larvae (Hashimoto et al., Reference Hashimoto, Kurita, Murakami and Wada2015). The normal shape and integrity of larval shells is dependent on the successful cleavage and development of the shell-founding cell during the zygote and morula stages, the invagination, evagination and expansion of the shell field during the gastrula stage, and the secretion of shell matrices and calcification during the trochophore stage (Kin et al., Reference Kin, Kakoi and Wada2009). Surprisingly, there are very few studies on embryonic development for any geoduck species. Most studies on geoduck embryos have only focused on the effects of temperature and salinity on the success of embryogenesis (i.e. D-larval yield), but not on the embryonic development itself. A detailed embryogenesis description of this unique genus of soft-sediment bivalves will contribute to the analysis of evolution. However, comparative embryology might need a more thorough examination on several species. Panopea zelandica embryogenesis, particularly the timing of developmental stages and characterization of key phenotypes, would be extremely valuable for future advancements and optimization of hatchery technologies. Specifically, without information on optimal sperm:egg ratios and embryonic development, the deformities we have observed in geoduck larvae may not be well understood and the yield of larvae and spat may not be reliably optimized. Thus, the aims of the current study are to describe the normal embryonic development and determine the optimal sperm:egg ratio under hatchery conditions in P. zelandica. This information will not only assist in the development of hatchery protocols for this species, but also other related bivalve species.
MATERIALS AND METHODS
Broodstock conditioning and gamete collection
Panopea zelandica broodstock (105–130 mm shell length, 500–800 g live weight) were collected from Golden Bay (South Island, New Zealand) and conditioned in flow-through 1 µm-filtered seawater at 15°C with microalgae (Tisochrysis lutea and Chaetoceros muelleri, 1:1 cell counts) for 3 months (after Le et al., Reference Le, Alfaro and King2014). Geoduck broodstock were induced to spawn by injecting 1–2 ml of 2 mM serotonin solution into their mantle. After their sex was revealed by initial gamete release, males and females were separated into different containers. Gametes were collected within 30 min of release, then rinsed through a 100 µm sieve to remove particulate matter. Eggs were caught on a 40 µm mesh screen and re-suspended in 500 ml seawater. Sperm and egg solutions were then stored at 4°C for up to 2 and 1 h, respectively. Before fertilization, gametes were examined for quality and quantity. All gametes were in good quality according to the characterization of egg shape and sperm motility as in Baker & Tyler (Reference Baker and Tyler2001). Sperm and egg concentrations were determined from three replicate counts of 20-μl and 200-μl aliquots, respectively. Sperm aliquots were diluted 1000×, transferred to a hemocytometer, and cells were counted under a light microscope (Olympus BX41, America Inc., New York, USA) at 400× magnification. Egg densities were counted under 200x magnification under an inverted light microscope (Olympus CKX41, America Inc., New York, USA).
Embryonic development
About 1 million eggs were fertilized in a 10 l bucket with a sperm:egg ratio of 500:1, screened (22 µm) and washed with fresh 1 µm-filtered seawater. Approximately 500,000 embryos were transferred to a beaker containing 5 l of 1 µm-filtered seawater and 4 µmol EDTA. The temperature of the incubation seawater was maintained at 15°C in a thermostat-controlled incubator. Triplicate 1 ml samples of suspended embryos were pipetted from the 5 l beaker every 10 min for the first 2 h, then every 30 min for the next 4 h, and every 2 h thereafter until the D-veliger larval stage. Samples were fixed in Davidson's solution and stored at 4°C until visual assessment. Embryos were observed using a light microscope and a scanning electron microscope (SEM, Hitachi SU-70 Skottky). The cleavage pattern was described following the standard terms in Hashimoto et al. (Reference Hashimoto, Kurita, Murakami and Wada2015).
Scanning electron microscopy
Preserved embryos were washed with phosphate buffer (138 mM NaCl, 2.7 mM KCl, 10 mM Na2HPO4, 1.8 mM KH2PO4; pH = 7.4) for 5 min, then rinsed for 1 min with deionized water. Embryos were then dehydrated through an ascending series of analytical grade ethanol 50, 60, 70, 80, 90 and 100% for 15 min intervals each (Turner & Boyle, Reference Turner and Boyle1974). After dehydration, samples were soaked in 98% chloroform for 30 s, and then dried for 12 h in a desiccator. To dry samples in a vaporous condition, a chloroform-soaked filter paper was also placed in the desiccator as suggested by Wassnig & Southgate (Reference Wassnig and Southgate2012). Dried samples were placed on adhesive carbon discs and mounted on aluminium stubs. Samples were sputter coated with carbon for 40 s using an ion sputter coater (Hitachi E-1045), then imaged via SEM at 5.0 kV.
Sperm:egg ratio optimization trial
Approximately 3000 eggs from one female were fertilized and incubated at 15°C in each of fifteen 50 ml Falcon™ tubes containing 30 ml of 1 µm filtered seawater and 4 µmol EDTA. Sperm aliquots from two males were pipetted into the Falcon tubes to provide sperm:egg ratios of 50:1, 100:1, 500:1, 1000:1 and 10,000:1 (3 replicates for each ratio). After a 40 min contact time, embryos and any unfertilized eggs were filtered and washed on a 22 µm mesh screen to remove excess sperm. Samples were incubated in 50 ml Falcon™ tubes containing fresh 1 µm filtered seawater with 4 µmol EDTA. After 3 and 18 h post-fertilization (hpf), embryos were carefully resuspended and 1 ml of each 30 ml embryo suspension was fixed in Davidson's solution and stored at 4°C for subsequent visual assessment. A total sample of 2230 and 3890 embryos were assessed in the 3 and 18 hpf groups, respectively. The embryonic development was assessed visually at 400x magnification using the inverted light microscope. Embryos that showed signs of irregular cleavage, incomplete blastula development and discolouration were recorded as ‘abnormal’ (Lewis & Galloway, Reference Lewis and Galloway2009). Unfertilized eggs were also categorized as ‘abnormal’ for the calculations. The proportion of normally developed embryos was determined by expressing the number of normal embryos as a percentage of the number of eggs initially present.
Statistical analysis
The ratios of normal embryos were arcsine-transformed (Sokal & Rohlf, Reference Sokal and Rohlf1995) to achieve homogeneity of variance and normality. The effect of sperm:egg ratios on the normal embryo yield were analysed by one-way analysis of variance (ANOVA), followed by Tukey pairwise comparison at the significance level α = 0.05 using the statistical software Minitab v. 17. All data are expressed as mean ± SD.
RESULTS
Embryonic development
Newly released eggs were pear-shaped and then became more spherical (with a diameter of 75–80 µm) immediately post-spawning. The first polar body became evident after 15–20 min post-fertilization (Figures 1A & 2A). The second polar body was typically observed about 35 min later (50–55 min post-fertilization; Figure 1B). The first cleavage started with polar lobe formation occurring at 1.5 hpf from the vegetal region, resulting in two unequal cells (small cell: AB, and large cell: CD; Figures 1C & 2B). The polar body was located in the plane of cleavage. The second cleavage appeared at 2.5 hpf. Polar lobe formation occurred again, producing three smaller cells of similar size, referred to as the A, B and C blastomeres and one larger blastomere (D; Figures 1D & 2D). The third cleavage occurred at 4 hpf. The third cleavage was uneven, creating the first quartet of smaller apical micromeres (1a–1d; Figures 1E & 2E). The fourth cleavage occurred at 5 hpf, producing 16-cell embryos with the second micromere quartet (1a2–1d2; Figure 2F). The fifth cleavage appeared at 6 hpf, producing 32-cell embryos, or morulae, with the third micromere quartet (Figures 1F & 2G, H). The blastula appeared at ~ 8 hpf and showed a symmetric division pattern. The bilaterally symmetric cell division yielded XL and XR regions and a presumptive shell field (Figures 1H–I & 2I–L). Occasional cilia were apparent surrounding the anterior circular margin, forming the early prototroch. Two cellular depressions started at the late blastula within the vegetal side. The shell field depression in the dorsal region was recognizable as a crescent-shaped orifice in the blastomere X region. The other depression within the ventral region represented the blastopore. The early gastrula appeared at 12 hpf. The shell field and blastopore depressions at this stage were deeper than at the blastula stage (Figure 2M, N). The prototrochal pad developed and correlated well with the general timing at which embryos began rotating, following circular trajectories within the water column. Gastrulation appeared at 18 hpf, by which time overall shape was no longer spherical. The dorsal region was distinguishable by an open orifice, which expanded under and posterior to the developing prototrochal pad (Figure 2O). The new shell material (pellicle) appeared as a wrinkle and accumulated at either side of the orifice. A mid-stage trochophore appeared at around 35 hpf. The trochophores were ovoid with a broad animal region and narrower vegetal region (Figure 2P). The well-developed prototroch was characterized as a crown of motile cilia (Figure 1J) and divided the trochophore into two regions (Figure 2P). The posterior region contained the blastopore on the ventral side and the shell field on the dorsal side. The anterior region contained the apical plate on which the cilia elongated and thickened to form an apical tuft that acts as a sensory organ (Figure 2P–R). The cilia developed on the posterior area of embryos and formed the presumptive telotroch (Figure 2S). Late-stage trochophores appeared at 39 hpf. The shell field spread out to form a flat and smooth periostracum on the posterior-dorsal region (Figure 2T). The periostracum then expanded and folded into right and left segments covering the trochophore (Figure 2U). Early D-stage veligers appeared at 45 hpf with the soft body enclosed by two valves and the appearance of the velum (Figure 2V, X). Mineralization began along the hinge, and then continued along the shell edge while the centre of the valve remained uncalcified. A summary of the timing of development stages is given in Table 1.
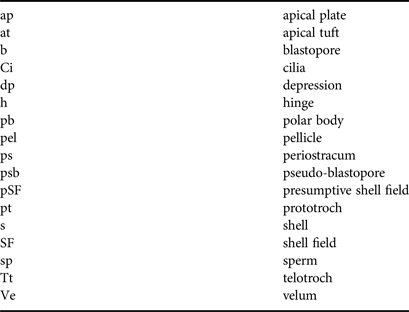
Light microscopy images of P. zelandica embryonic development. (A)–(E) initial cell divisions; (F) morula; (G) blastula; (H)–(I) gastrula and (J) trochophore. Abbreviations are summarized in Table 2.

SEM images of P. zelandica embryonic development. (A) fertilized egg; (B) 2 cell stage; (C) 3 cell; (D) 4 cell; (E) 8 cell; (F) 16 cell; (G) 32 cell; (H) morula; (I)–(J) early blastula; (K)–(L) late blastula; (M)–(N) early gastrula; (O) gastrula; (P)–(S) trochophore; (T)–(V) late trochophore and (W)–(X) early D-veliger. Abbreviations summarized in Table 2 and the results text.

The approximate post-fertilization developmental time sequence for geoduck embryos. Panopea zelandica data are derived from the current study and compared to P. japonica raised at different temperatures by Lee & Rho (Reference Lee and Rho1997).


Sperm:egg ratio
The original aim of this study was to determine the optimal sperm:egg ratio; unfortunately, only one female geoduck spawned. Hence, the result in this study cannot be generalized to the entire geoduck population. The sperm:egg ratio significantly affected the percentage of normally developed embryos at 3 hpf (one-way ANOVA, df = 14, F = 6.62, P = 0.007) and at 18 hpf (one-way ANOVA, df = 14, F = 27.99, P < 0.001; Figure 3). The highest normal embryo percentage was achieved at a sperm:egg ratio of 50:1 as confirmed by both the 3 hpf and 18 hpf sampling events. The percentage of normal embryos after 3 hpf with a sperm:egg ratio of 50:1 was significantly higher than those obtained from 500:1 and 10,000:1 ratios. However, there was no significant difference in the quantity of normal embryos obtained after 3 hpf between sperm:egg ratios of 50:1 and 100:1. Moreover, at 18 hpf, significantly higher numbers of normal embryos were obtained at a sperm:egg ratio of 50:1 compared with those obtained at ratios of 1000:1 and 10,000:1 (Figure 3). However, there was no significant difference in normal embryo development after 18 hpf among sperm:egg ratios from 50:1 to 500:1. Although the power of the statistical analysis might not be strong, overall, there was a decreasing trend in the quantities of normally developed embryos as the sperm:egg ratio increased.
Proportion of apparently normal embryos, expressed as a percentage of initial egg numbers, 3 and 18 hpf using different sperm:egg ratio treatments. Bars represent mean ± SD, N = 3; significant differences are identified by distinct letters (P < 0.05).

DISCUSSION
Embryonic development
The developmental time of P. zelandica embryos to D-veliger larvae was <65 h at 15°C and <48 h at 17°C in our commercial batches (unpublished data). These developmental periods were similar to those determined for P. japonica by Lee & Rho (Reference Lee and Rho1997), who incubated embryos at 14 and 17°C (Table 1). However, the incubation period for P. japonica embryos could be shortened to 27 h at 19°C (Nam et al., Reference Nam, Lee, Kim, Kim and Kim2014). While it may be beneficial for geoduck hatcheries to maximize the developmental rate, the thermal threshold for normal development should not be exceeded (Santos & Nascimento, Reference Santos and Nascimento1985). Thus, the development of P. zelandica embryos at higher temperatures may be examined in future research, to improve hatchery efficiency and understanding impacts of climate change.
In the current study, the formation times for the first and second polar bodies at 15°C and 35 ppt were 20–25 and 50–55 min, respectively. The appearance times of the second polar body of P. zelandica observed in this study were similar to those of the geoduck P. generosa at 15°C (Vadopalas & Davis, Reference Vadopalas and Davis2004). This information is important for the triploidy induction in bivalves, when using chemicals to block the second polar body formation (Barber et al., Reference Barber, Mann and Allen1992; Gerard et al., Reference Gerard, Naciri, Peignon, Ledu and Phelipot1994; Vadopalas & Davis, Reference Vadopalas and Davis2004). The present study provides the first record of early shell formation in geoducks. The presumptive shell field depression appeared at the blastomere X of P. zelandica blastula and started to depress at late blastula stage. The shell field depression occurring when the XR and XL were still present may confirm that the differentiation of the shell gland in P. zelandica occurs at the late blastula stage, while there are only a small number of cilia associated with the prototroch, and the embryos are spherical. The commencement of shell field depression in P. zelandica embryos was earlier than in other clams, e.g. Ruditapes decussatus (gastrula stage, Aranda-Burgos et al., Reference Aranda-Burgos, Da Costa, Novoa, Ojea and Martinez-Patino2014) and Spisula solidissima (early trochophore stage, Eyster & Morse, Reference Eyster and Morse1984). The process of shell field depression at the gastrula stage for P. zelandica was similar to that of other clams (e.g. Chione cancellata, Venerupis pullastra, and Ruditapes decussatus) in which the shell field did not undergo invagination (Mouëza et al., Reference Mouëza, Gros and Frenkiel2006; Aranda-Burgos et al., Reference Aranda-Burgos, Da Costa, Novoa, Ojea and Martinez-Patino2014). However, the shell invagination needed to close either completely or partially before the shell could be formed in other bivalves (e.g. the mussel Mytilus galloprovincialis (Kniprath, Reference Kniprath1980), the scallop Pecten maximus (Casse et al., Reference Casse, Devauchelle and Pennec1998), the clam Spisula solidissima (Eyster & Morse, Reference Eyster and Morse1984), and the oysters Saccostrea kegaki (Kin et al., Reference Kin, Kakoi and Wada2009) and C. gigas (Zhang et al., Reference Zhang, Fang, Guo, Li, Luo, Xu, Yang, Zhang, Wang, Qi, Xiong, Que, Xie, Holland, Paps, Zhu, Wu, Chen, Wang, Peng, Meng, Yang, Liu, Wen, Zhang, Huang, Zhu, Feng, Mount, Hedgecock, Xu, Liu, Domazet-Loso, Du, Sun, Zhang, Liu, Cheng, Jiang, Li, Fan, Wang, Fu, Wang, Wang, Zhang, Peng, Li, Li, Wang, Chen, He, Tan, Song, Zheng, Huang, Yang, Du, Chen, Yang, Gaffney, Wang, Luo, She, Ming, Huang, Zhang, Huang, Zhang, Qu, Ni, Miao, Wang, Wang, Steinberg, Wang, Li, Qian, Zhang, Li, Yang, Liu, Wang, Yin and Wang2012). This study also revealed that the shell mineralization only commenced once the periostracum covered the whole embryo, and began along the hinge, then continued along the shell margin, but did not initially include the centre of the valves. This shell mineralization process was similar to M. galloprovincialis (Kniprath, Reference Kniprath1980) and Tridacna squamosa (LaBarbera, Reference LaBarbera1974). Furthermore, we observed that the shell valves preceded the ligament formation in P. zelandica. The same observation has been reported in C. cancellata (Mouëza et al., Reference Mouëza, Gros and Frenkiel2006).
Sperm:egg ratio
The reported values of optimal sperm:egg ratios for fertilization and successful development vary greatly for different bivalve species. The low range of sperm:egg ratio (≤100:1) as found in this study was also optimal for fertilization in the scallop Placopecten magellanicus (Desrosiers et al., Reference Desrosiers, Désilets and Dubé1996) and the clams Spisula solidissima (Clotteau & Dubé, Reference Clotteau and Dubé1993), and Tegillarca granosa (Dong et al., Reference Dong, Yao, Lin and Zhu2012). The medium range of sperm:egg ratio (100–1000:1) has been found to optimize D-veliger larval yields in C. gigas (Song et al., Reference Song, Suquet, Quéau and Lebrun2009) and normal embryo yields in C. gigas (Stephano & Gould, Reference Stephano and Gould1988) and C. virginica (Alliegro & Wright, Reference Alliegro and Wright1985). In addition, a high range of sperm:egg ratio (1000–5000:1) has been found to be optimal for normal D-larvae yield in the oyster Crassostrea rhizophorae (Santos & Nascimento, Reference Santos and Nascimento1985) and the scallop Chlamys asperrima (O'Connor & Heasman, Reference O'Connor and Heasman1995). An even higher range of sperm:egg ratio (≥10,000:1) has been found to be optimal for fertilization in the cockle Clinocardium nuttallii (Liu et al., Reference Liu, Alabi and Pearce2008).
Since the sperm:egg ratio and the fertilzation ratio are usually confounded by other factors (i.e. sperm motility, egg density, oocyte maturation or/and contact time) we discussed here some potential reasons underlining the discrepancy between results on P. zelandica. The fertilization ratio for P. zelandica (81–91% 3 hpf and 88–96% 18 hpf) in the present study is higher than that (max. 70% 9 hpf) reported by Gribben et al. (Reference Gribben, Millar and Jeffs2014). The procedures common to both the present study and Gribben et al. (Reference Gribben, Millar and Jeffs2014) are spawning method and sperm motility evaluation before fertilization. The low range of sperm:egg ratio (≤100:1), which was found to be optimal for normal embryo yields for the New Zealand geoduck P. zelandica in the present study was also used for the Pacific geoduck P. generosa by Vadopalas & Davis (Reference Vadopalas and Davis2004). In contrast, Gribben et al. (Reference Gribben, Millar and Jeffs2014) found the ultra-high range (≥10,000:1) of sperm:egg ratio to be optimal for fertilization of the P. zelandica. The egg density was fixed at 100 eggs ml−1 in the present study, while 20 eggs ml−1 were used by Gribben et al. (Reference Gribben, Millar and Jeffs2014), and Vadopalas & Davis (Reference Vadopalas and Davis2004) did not report the egg density. The egg density may affect the numbers of sperm reaching the egg in marine invertebrates (Gould & Stephano, Reference Gould and Stephano2003). O'Connor & Heasman (Reference O'Connor and Heasman1995) observed that the higher the egg density was the fewer sperm were required to elicit maximum fertilization. Besides, the egg density affected the fertilization ratio in the clam S. solidissima (Clotteau & Dubé, Reference Clotteau and Dubé1993). Similarly, the percentage fertilization in the scallop C. asperrima significantly increased from ~87%– to ~97% while the egg density increased from 1 to 500 eggs ml−1 (O'Connor & Heasman, Reference O'Connor and Heasman1995). In contrast, Levitan et al. (Reference Levitan, Sewell and Chia1991) did not find an effect of egg concentration on fertilization for the sea urchin Strongylocentrotus franciscanus. However, their lowest egg concentration was over 600 eggs ml−1. Over 500 eggs ml−1 did not increase the fertilization ratio in C. asperrima (O'Connor & Heasman, Reference O'Connor and Heasman1995). Hence, the difference in optimal sperm:egg ratios and fertilization ratio results between this study and Gribben et al. (Reference Gribben, Helson and Millar2004) might be due to the differences in the egg density. Further investigation of the effect of egg density on the fertilization ratio for P. zelandica should be conducted.
The sperm-egg contact time in the present study (40 min) was also longer than that (5–10 min) used by Gribben et al. (Reference Gribben, Millar and Jeffs2014). Interestingly, Gribben et al. (Reference Gribben, Millar and Jeffs2014) also observed fertilization at low sperm concentrations if the contact time was increased. Another potential factor influencing the higher normal embryo yield or lower polyspermy in the present study may be the age of eggs prior to fertilization (1.5 h), which was a longer storage period than that (<30 min) used by Gribben et al. (Reference Gribben, Millar and Jeffs2014). It must be noted that P. zelandica eggs obtained in the present study and Gribben et al. (Reference Gribben, Millar and Jeffs2014) were the result of serotonin-induced spawning. Serotonin-spawned eggs have been suggested to be more vulnerable to polyspermy (Misamore et al., Reference Misamore, Silverman and Lynn1996). However, the polyspermic susceptibility of serotonin-spawned eggs can be reduced if incubated for over 1 h (O'Connor & Heasman, Reference O'Connor and Heasman1995). Similarly, the incidence of polyspermy of C. gigas artificially stripped eggs was significantly reduced from 98% to 4% if eggs were incubated 1–1.5 h prior to fertilization (Stephano & Gould, Reference Stephano and Gould1988). This might be due to the maturation of oocytes after incubation in seawater. As oocytes become mature, they develop an effective electrical block to polyspermy (Schlichter & Elinson, Reference Schlichter and Elinson1981). For instance, it took the clam Tivela stultorum oocytes, which were treated with serotonin, up to 40 min to become mature (Alvarado-Alvarez et al., Reference Alvarado-Alvarez, Gould and Stephano1996). Moreover, a decreased conductance, which strengthens the polyspermy block, developed slowly in serotonin treated oocytes (Alvarado-Alvarez et al., Reference Alvarado-Alvarez, Gould and Stephano1996).
In addition to those potential factors mentioned above (i.e. egg density, contact time and egg age), the temperature for storing gametes is a critical factor influencing fertilization practices and success. Gribben et al. (Reference Gribben, Millar and Jeffs2014) found that P. zelandica gametes stored at 15°C for over 30 min had reduced viability. This reduction in viability has also been observed in other bivalves (e.g. Clinocardium nuttallii, Liu et al., Reference Liu, Alabi and Pearce2008) at their spawning temperatures. However, when gametes are stored at lower temperatures the gamete viability can be maintained for up to 1.5–4 h (O'Connor & Heasman, Reference O'Connor and Heasman1995; Liu et al., Reference Liu, Alabi and Pearce2008; Adams et al., Reference Adams, Smith, Roberts, Janke, Kaspar, Tervit, Pugh, Webb and King2004, Reference Adams, Tervit, McGowan, Smith, Roberts, Salinas-Flores, Gale, Webb, Mullen and Critser2009). Similarly, in the present study no negative effects of storing P. zelandica gametes at 4°C were found. Thus, it seems that reducing the temperature may be a factor in resolving inconsistencies between the age of eggs and their susceptibility to polyspermy.
Inevitably, in a commercial operation, eggs need to be pooled until sufficient quantities have been collected to stock an incubation tank, which may take several hours. Thus, cold storage adds flexibility to spawning and fertilization times and prolongs the viability of both sperm and egg. Further research may usefully be focused on the mechanisms underlying the viability of geoduck gametes at low temperatures.
In conclusion, embryo cleavage follows a spiral and unequal pattern while the shell field depresses and expands to create the periostracum. However, the ligament is not formed until the shell field covers the entire embryo. Sperm:egg ratios of 50–500:1 with a 40 min sperm-egg contact time gave the highest normal embryo yield under the experimental conditions. Eggs and sperm can be stored at 4°C to extend their viability up to 1.5 h, making the fertilization practical since geoducks typically continue to spawn for 4 h. In addition, incubating eggs at 4°C for over 1 h may make the eggs less susceptible to polyspermy. An experiment with more female spawned would confirm the finding of sperm:egg ratio in this study. Further research is needed to determine the extent to which cold storage can prolong gamete viability, and whether incubation times exceeding 1 h can reduce the polyspermic susceptibility of eggs, as well as confirming the shell field pattern for P. zelandica.
ACKNOWLEDGEMENTS
This project was funded by the Cawthron Cultured Shellfish Programme (NZ Ministry of Business, Innovation and Employment contracts CAWS0802, CAW1315). Logistical and technical support was provided by the School of Applied Sciences, Auckland University of Technology (AUT). We are grateful to the Aquaculture Biotechnology Group at AUT for fruitful discussions that improved this research. We would like to thank Patrick Conor and Marcel Schaefer from School of Engineering, AUT for SEM guidance and Clara & Richard for editing photos. This project is part of a PhD thesis, which was supported by a New Zealand Aid scholarship awarded to D.V. Le under the supervision of A.C. Alfaro.