1. Introduction
Nanophthalmos and posterior microphthalmos are two subtypes of microphthalmos and extreme phenotypes of extreme hyperopia. Nanophthalmos is characterized by a very short axial length with an overcrowded anterior chamber (Verma & Fitzpatrick, Reference Verma and Fitzpatrick2007; Carricondo et al., Reference Carricondo, Andrade, Prasov, Ayres and Moroi2018). It occurs due to delayed development of the eye in the early stage of embryogenesis. In some cases, the size of the eye is reduced without other ocular defects, whereas in others, small eyes are accompanied by abnormal development of the retina, choroid, and sclera (MacKay et al., Reference MacKay, Shek, Carr, Yanuzzi and Gouras1987; Crespí et al., Reference Crespí, Buil, Bassaganyas, Vela-Segarra, Díaz-Cascajosa, Ayala-Ramírez and Zenteno2008; Albar et al., Reference Albar, Nowilaty and Ghazi2015; Xiao et al., Reference Xiao, Guo, Zhong and Liu2015; Zacharias et al., Reference Zacharias, Susanna, Sundin, Finzi, Susanna and Takahashi2015).
To date, several genes, including TMEM98, MFRP, PRSS56, CRB1, and BEST1, have been identified to be associated with nanophthalmos (Carricondo et al., Reference Carricondo, Andrade, Prasov, Ayres and Moroi2018). Retinal pathologies are reported to be linked to nanophthalmos genes. Patients with MFRP mutations have retinitis pigmentosa (RP; Zacharias et al., Reference Zacharias, Susanna, Sundin, Finzi, Susanna and Takahashi2015), while progressive dysfunction of photoreceptors is one of the primary characteristics of RP. Correspondingly, Mfrp mutation is found in the retinal degeneration 6 mouse with photoreceptor degeneration (Kameya et al., Reference Kameya, Hawes, Chang, Heckenlively, Naggert and Nishina2002). Prss56 gene is also associated with nanophthalmos (Orr et al., Reference Orr, Dube, Zenteno, Jiang, Asselin, Evans, Caqueret, Lakosha, Letourneau, Marcadier, Matsuoka, Macgillivray, Nightingale, Papillon-Cavanagh, Perry, Provost, Ludman, Guernsey and Samuels2011). The axial length of mice with Prss56 mutation is reported to be 4.4% shorter than that of wild-type (WT) littermate controls at 2 months of age (Nair et al., Reference Nair, Hmani-Aifa, Ali, Kearney, Ben Salem, Macalinao, Cosma, Bouassida, Hakim, Benzina, Soto, Soderkvist, Howell, Smith, Ayadi and John2011). Interestingly, an increased temporal expression of Prss56 has been observed in Mfrprd6 mutant mice, suggesting that the two genes may interact with each other inside the same regulatory network, and result in reduced retina-specific transcriptions in photoreceptors as well as their outer segment disorganization (Soundararajan et al., Reference Soundararajan, Won, Stearns, Charette, Hicks, Collin, Naggert, Krebs and Nishina2014). Similarly, clinical studies on the two families demonstrate that mutations in the Crb1 gene are linked to the nanophthalmos–RP–foveoschisis–optic disk drusen syndrome (Zenteno et al., Reference Zenteno, Buentello-Volante, Ayala-Ramirez and Villanueva-Mendoza2011; Paun et al., Reference Paun, Pijl, Siemiatkowska, Collin, Cremers, Hoyng and den Hollander2012). Correspondingly, a single base deletion of the Crb1 gene in retinal degeneration 8 mouse model causes a shortened photoreceptor inner and outer segments (Mehalow et al., Reference Mehalow, Kameya, Smith, Hawes, Denegre, Young, Bechtold, Haider, Tepass, Heckenlively, Chang, Naggert and Nishina2003). Moreover, mice with heterozygous retinal white spots (Rwhs) mutation in TMEM98 show white patches on retinal imaging indicating folds or invaginations of the photoreceptor layers (PRLs; Thaung et al., Reference Thaung, West, Clark, McKie, Morgan, Arnold, Nolan, Peters, Hunter, Brown, Jackson and Cross2002). A193P and H196P knock-in to the TMEM98 locus in mice results in retinal white spots and retinal folds (Cross et al., Reference Cross, McKie, Keighren, West, Thaung, Davey, Soares, Sanchez-Pulido and Jackson2019). In addition, five families with nanophthalmos and retinal dystrophy are reported to be associated with missense mutations in BEST1 (Yardley et al., Reference Yardley, Leroy, Hart-Holden, Lafaut, Loeys, Messiaen, Perveen, Reddy, Bhattacharya, Traboulsi, Baralle, De Laey, Puech, Kestelyn, Moore, Manson and Black2004).
All clinical findings and results from corresponding genetic mutant animal models indicate that nanophthalmos-related genes play a critical role in retinal development. Moreover, these genes are expressed in various retinal cells. TMEM98, BEST1, and MFRP are expressed in retinal pigment epithelium (RPE), and PRSS56 is expressed in Muller cells and CRB1 in photoreceptors. These genes are thought to interact and participate in specific pathways that regulate retinal development.
In addition to the classic nanophthalmos genes, whole-genome sequencing using a de novo mutation strategy identified that myelin regulatory factor (MYRF; OMIM 608329) might be another nanophthalmos gene (Guo et al., Reference Guo, Zhao, Chen, He, Sun, Li, Liu, Zhang, Zhang, Li, Zhang, Ge, Liu, Zhang and Fan2019a,Reference Guo, Zhao, Zhang, Liu, Li, Zhang, Sun, Chen, Zhang and Fanb). Several other studies have shown similar findings (Garnai et al., Reference Garnai, Brinkmeier, Emery, Aleman, Pyle, Veleva-Rotse, Sisk, Rozsa, Ozel, Li, Moroi, Archer, Lin, Sheskey, Wiinikka-Buesser, Eadie, Urquhart, Black, Othman, Boehnke, Sullivan, Skuta, Pawar, Katz, Huryn, Hufnagel, Camper, Richards and Prasov2019; Xiao et al., Reference Xiao, Sun, Ouyang, Li, Jia, Tan, Hejtmancik and Zhang2019). Recently, Garnai et al. (Reference Garnai, Brinkmeier, Emery, Aleman, Pyle, Veleva-Rotse, Sisk, Rozsa, Ozel, Li, Moroi, Archer, Lin, Sheskey, Wiinikka-Buesser, Eadie, Urquhart, Black, Othman, Boehnke, Sullivan, Skuta, Pawar, Katz, Huryn, Hufnagel, Camper, Richards and Prasov2019) developed Myrf conditional knockout (CKO) mice and revealed that MYRF is crucial to retinal development especially RPE. Besides, ciliary zonule defects was found in Myrf mutation mice (Yu et al., Reference Yu, Sun, Yang, Zhao, Su, Zhang, He, Lin, Ge and Fan2021). However, the relationship between MYRF and retinal development is not fully investigated.
Considering the important role of nanophthalmos associated genes in retinal development, we created an Myrf knockdown mutant mice to investigate the cellular and molecular phenotypes of reduced MYRF expression in the retina. The MYRF mRNA expression is most abundant in the neurosensory retina and RPE (BioGPS, http://biogps.org; SAGE, https://cgap.nci.nih.gov/). Therefore, we focused on the retina as our initial target for investigation. Moreover, the retina plays an important role in molecular mechanisms transforming visual signals into axial length regulation, although the exact mechanisms remain unknown (Rymer & Wildsoet, Reference Rymer and Wildsoet2005; Tkatchenko et al., Reference Tkatchenko, Troilo, Benavente-Perez and Tkatchenko2018). In the current study, we focused on the cellular and molecular changes in the retina in an Myrf knockdown mouse model.
2. Methods
2.1. Generation of Myrf+/− mice and breeding
All animal procedures were conducted according to the protocols approved by the Institutional Animal Care and Use Committee in the Zhongshan Ophthalmic Center and strictly complied with the principles regarding the care and use of animals adopted by the American Physiological Society and the Society for Neuroscience. Throughout the experiment, all mice were maintained in an assessment pathogen-free specific pathogen free (SPF) animal facility on a 12-hour light/dark cycle and under temperature (18–29°C) and humidity (40–70%) controlled with food and water available ad libitum.
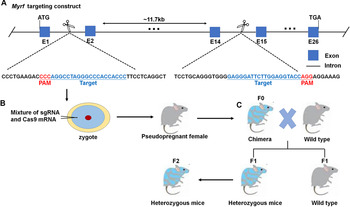
The primary RNA transcript of MYRF in Ensembl is ENSMUST00000189897.1, and the proper target sequence of MYRF single-guide RNA (sgRNA) was acquired from Optimized CRISPR Design (http://crispr.mit.edu). For the generation of Myrf +/− mice, the C57BL/6J mice (3–4 weeks old), supplied by GemPharmatech Co., Ltd. (Nanjing, China), were used as a source of embryos, foster mothers, and subsequent breeding. Briefly, superovulated fertilized eggs were isolated from female C57BL/6J mice treated with 30 IU pregnant mare serum gonadotropin (Sigma-Aldrich, St. Louis, MO) and 100 IU human chorionic gonadotropin (Sigma-Aldrich) at 50-h intervals. Subsequently, the mixture containing Cas9 mRNA (50 ng/μL) and sgRNA (100 ng/μL) was comicroinjected into the cytoplasm of zygotes, and surviving zygotes were transplanted into the oviducts of pseudopregnant female mice to generate live animals. The designed sgRNAs targeted the intron 1 (gRNA 1) and intron 14 (gRNA 3) on mouse chromosome 19. Generation of sgRNA harboring the protospacer-adjacent motif (PAM) sequence and the Cas9 mRNA was performed as described before (Yang et al., Reference Yang, Wang and Jaenisch2014). Founder (F0) mice with targeted MYRF knockdown were validated using polymerase chain reaction (PCR) primers. To establish Myrf +/− mice lines, the founders were intercrossed with WT mice in the C57BL/6 J strain background to produce more F1 heterozygous mice. And then, F2 heterozygotes mice were produced by outcrossing F1 heterozygotes mice to WTs. We failed to produce homozygous knockout mice as the Myrf homozygous knockout mice led to death during embryonic period. Thus, F2 Myrf heterozygous mice were used for following experiment. Generation of Myrf knockdown mice was shown in Fig. 1.
Generation of Myrf knockdown mice using the CRISPR/Cas9 system. (A) Schematic diagram of the MYRF gene encoding deoxyuridine 5′-triphosphate nucleotidohydrolase. Exons are indicated with blue rectangles and marked with E and numbers, whereas introns are indicated with a short black line. Guide RNA target sites and PAM sequence are underlined in blue and red, respectively. (B) Embryonic stem cell was microinjected with sgRNA and Cas9 mRNA, and matured as blastocyst, which was subsequently transferred to pseudopregnant female mice. (C) The chimeras (F0) were cross-bred with WT mice to generate littermate control mice (Myrf +/+) and heterozygous (Myrf +/−) offsprings (F1) containing the targeted locus through germline transmission. F2 Myrf +/− heterozygous mice were generated for the next experiments.

2.2. Genotyping
Total genomic DNA was extracted from mouse tails and then genotyped by PCR analysis. Genomic DNA from mouse tails was dissolved according to the protocol of genomic DNA extraction kit (Tiangen, Beijing, China). The sequences of the forward primer and the reverse primer used for PCR were shown in Table S1. The PCR products were visualized by 2% agarose gel electrophoresis.
2.3. Optomotor response
An optomotor response (OMR)-based visual assessment system was established as described previously (Prusky et al., Reference Prusky, Alam, Beekman and Douglas2004). Before testing, mice were dark-adapted for at least 2 h and then placed on the pedestal for 10 min to adapt to testing environment. The speed of sinusoidal grating rotation maintained at 12 deg/s. A positive optomotor tracking response elicited by randomly rotating clockwise or counterclockwise was defined as a reflexive head movement consistent with the direction and velocity of the stimulus. To measure spatial frequency threshold, representative of visual acuity (VA), sinusoidal gratings were kept at 100% contrast, whereas the spatial frequency was initiated from a relatively low value (0.1 cyc/deg) and increased continuously until the mouse stopped the head-tracking response to stimulus. Highest spatial frequency perceivable represented the VA. The OMR testing was recorded by two experienced observers.
2.4. Electroretinography
Mice were dark-adapted for at least 12 h prior to electroretinogram (ERG) recording using RETI-Scan 21 (Roland GMBH, Harpstedt, German), and following procedures were all performed in a dark room with a dim red light. After anesthetized by intraperitoneal injection with 1% sodium pentobarbital (0.01 ml/g), mice pupils were dilated topically using 1% tropicamide. A gold wire ring electrode was placed on the center of corneas in both eyes with reference electrodes in the forehead, whereas a ground electrode was inserted subcutaneously into the back close to the tail. Scotopic full-field ERGs were obtained under single white-flash stimuli with light intensity of −2.00, −0.52, 0.00, 0.48, and 1.00 log cd s/m2. After 5 min of light adaptation with a bright green background (1.30 log cd/m2), photopic flash intensity of 0.48 log cd s/m2 and flicker stimulus intensity at 0.48 log cd s/m2 with frequencies of 30 Hz were set to evaluate photopic retinal function. Stable waves were recorded three times for each eye. The amplitude of the a-wave was measured from baseline to the cornea-negative peak, whereas that of the b-wave was measured from the cornea-negative peak to the major cornea-positive peak.
2.5. Measurement of retinal thickness by spectral-domain optical coherence tomography
Mice were anesthetized by intraperitoneal injection with 1% sodium pentobarbital (0.01 ml/g) and then positioned in an animal holder. The pupils were dilated topically using 1% tropicamide prior to imaging. Spectral-domain optical coherence tomographic (SD-OCT) images were taken using the Spectral-Domain Ophthalmic Imaging System (Bioptigen, Inc., Durham, NC) with a platform allowing subject orienting and aligning easily. Radial volume scans consisting of 100 B-scans over 1 mm across the optic disk were performed, and the measurements of obtained image were assessed by ImageJ software (National Institutes of Health, Bethesda, MD; Schneider et al., Reference Schneider, Rasband and Eliceiri2012). The thickness of outer nuclear layer (ONL) was measured, respectively, at 4-, 8-, and 12-week postnatal age. The lines defining ONL (from the outer plexiform layer to the external limiting membrane), on both sides 300 μm from the optic disk, were drawn in ImageJ software. All the measurements were performed by experienced investigators in a blind manner.
2.6. Histology
Mice were deep anesthetized by carbon dioxide inhalation followed with cervical dislocation. Their eyes were immediately enucleated and fixed in formaldehyde, acetic acid, alcohol, saline (FAS) fixed liquid (Wuhan Servicebio Technology Co., Ltd., Wuhan, China) for 24 h at 4°C. The eyes were then transferred to ethanol for paraffin embedding after dehydration. Samples were removed and cut into 5-μm-thick sections through the optic nerve head. The sections were stained with hematoxylin and eosin (HE) using standard protocols, and retinal tissue was examined under a light microscope and imaged. A retinal image (30× magnification) across the optic disk was taken for each sample. Eight vertical lines 150, 300, 400, and 600 μm away from the optic disk (four on each side) were drawn between the outer plexiform layer and the outer limiting membrane on each image. And the length of the vertical line was measured as the thickness of the ONL. Moreover, PRL thickness was measured 300 μm away from the optic disk.
2.7. Immunofluorescence
Mice were deep anesthetized by carbon dioxide inhalation followed with cervical dislocation. For retinal sections, the corneas and lenses were removed, and the eye cups were fixed in 4% paraformaldehyde for 30 min followed by dehydration in 30% sucrose overnight, and then 15 μm cryostat sections were cut through the optic nerve. Frozen sections from three animals per groups were used for immunofluorescence staining. First, the samples were hydrated in phosphate buffer saline (PBS) solution at room temperature for 10 min and then incubated with the primary antibodies, including mouse antirhodopsin (MAB5316, 1:800, MilliporeSigma, Burlington, MA) and rabbit anticone arrestin (AB15282, 1:800, MilliporeSigma), at 4°C overnight. After washing with PBS, the samples were incubated with Alexa Fluor 488 conjuncted donkey antirabbit secondary antibody (A21206, 1:800, Invitrogen, Carlsbad, CA) or Alexa Fluor 594 conjuncted donkey antimouse secondary antibody (A21203, 1:800, Invitrogen) for 2 h at room temperature. After washing in PBS and counterstained with 4’,6-diamidino-2-phenylindole (Biofroxx GmbH, Einhausen, Germany), immunofluorescence images were obtained using LSM710 laser scanning confocal microscope (ZEISS, Oberkochen, Germany). For quantification of intensity of retinal rod and cone photoreceptor cells, digital images corresponding to different retinal regions containing the central, middle, and peripheral sections of retinas were overlaid with random boxes of 320 × 320 μm in size. The average cone cell density, rhodopsin immunofluorescence intensity, and PRL thickness of three retinal regions were measured by ImageJ software and recorded as the final result of every retinal section.
2.8. Tissue collection and RNA extraction
Mice were euthanized at postnatal week (PW) 8, and retinal tissues from nine mice per group were harvested directly under a stereoscopic microscope. First, following the creation of a central small hole, the cornea was removed completely by inserting corneal microscissors into the hole and cutting along the limbus in a full circle. Subsequently, the retina was carefully dissociated from the choroid using microforceps, and the retina was separated completely from the eyeball after cutting the connections between the optic disk and the retina. All the retinal tissue samples were obtained under sterile conditions, and immediately frozen in liquid nitrogen until the timing of RNA extraction. Total RNA was extracted with TRlzol reagent (TaKaRa, Dalian, China) following the manufacturer’s instructions. The total RNA quantity and purity were analyzed by NanoPhotometer-N60 (Implen GmbH, Munich, Germany). The total RNA was extracted for both RNA sequencing (RNA-seq; n = 3 mice) and quantitative real-time polymerase chain reaction (RT-PCR; n = 6).
2.9. RNA-seq and bioinformatics analysis
The cDNA library was created in accordance with the protocol for the mRNA-seq sample preparation kit (Illumina, Inc., San Diego, CA). The average insert size for the paired-end libraries was 300 ± 50 bp. Subsequently, we performed the paired-end sequencing on an Illumina Novaseq™ 6000 (LC-Bio Technology Co., Ltd., Hangzhou, China) following the vendor’s recommended protocol. The mapped reads of each sample were assembled using StringTie (version: stringtie-1.3.4d. Linux_x86_64) with default parameters. Next, all transcriptomes from all samples were merged to reconstruct a comprehensive transcriptome using gffcompare software (version: gffcompare-0.9.8. Linux_x86_64). After the final transcriptome was generated, StringTie and ballgown were used to estimate the expression levels of all transcripts, and expression level for mRNAs was evaluated by calculating FPKM (FPKM = [total_exon_fragments/mapped_reads (millions) × exon_length (kB)]). The differentially expressed mRNAs were selected with fold changes ≥2 or fold changes ≤0.5 and P-value <0.05 by R package edgeR (Robinson et al., Reference Robinson, McCarthy and Smyth2010) or DESeq2 (Pertea et al., Reference Pertea, Pertea, Antonescu, Chang, Mendell and Salzberg2015), and then Gene Ontology (GO) enrichment and Kyoto Encyclopedia of Genes and Genomes (KEGG) enrichment to the differentially expressed mRNAs were analyzed.
2.10. Quantitative real-time PCR
According to the manufacturer’s instructions, isolated RNA was reversely transcribed into cDNA using First-Strand cDNA Synthesis Kit (Applied Biological Materials, Inc., Richmond, BC, Canada). RT-PCR was performed using SYBR Green Master Mix (Roche Life Science, Basel, Switzerland) in a Roche LightCycler 384. Primer sequence was shown in Table S1.
2.11. Statistical analysis
All data were presented as means ± standard error of mean. Comparisons of two individual experimental groups were performed by Student’s t-test if the data conform to a normal distribution or the Mann–Whitney U test if the data did not conform to a normal distribution. Comparisons of three or more individual experimental groups were performed by one-way analysis of variance or the Kruskal–Wallis H test according to the distribution of the data. SPSS 20.0 software (SPSS, Chicago, IL) and GraphPad Prism 6 (GraphPad Software, version 6.01, La Jolla, CA) were used for statistical analysis and generation of figures, and P ≤ 0.05 was considered as statistically significant.
3. Results
3.1. Generation of Myrf+/− mice using the CRISPR/Cas9 genetic editing system
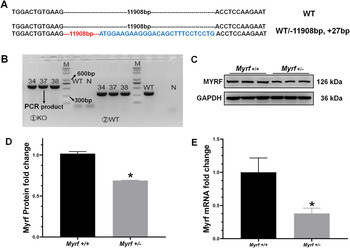
To investigate the MYRF function in mammalian eye development, Myrf +/− mice were generated using CRISPR/Cas9 genetic editing technology. Intron 1 and intron 14 were scanned for sgRNA target sequence and used to perform a deletion between exon 2 and exon 14 (about 11,908-bp deletion). After the sgRNA being cut, the repair process was triggered, and the sequence was variably deleted, resulting in a significant increase in base sequence (about 27-bp insertion; Fig. 2A). Founder 1 (F1) mice including #34, #37, and #38 with targeted MYRF knockdown were validated by PCR primers (Fig. 2B). Moreover, the results of western blots and RT-PCR both supported the knockdown of MYRF in Myrf +/− mice (Fig. 2C–2E). The weight, development, growth, and behavior of Myrf +/− mice appeared grossly normal.
Verification of Myrf knockdown mice strain generated using the CRISPR/Cas9 system. (A) DNA and amino acid sequence of the heterozygous founder mice showing CRISPR events compared with the WT mice. The black dashed line in WT mice represents the omitted 11,908 bp of the nucleotide. The red dashed line in heterozygous founder mice represents the deletion of 11,908 bp of the nucleotide, whereas the sequence in blue represents the inserted nonsense sequence. (B) Surveyor assay was performed on mouse total genomic DNA for the detection of the mutations of the MYRF gene. M = DNA marker, N = negative control. (C and D) Western blots showing a decrease in Myrf protein expression in Myrf +/− mice versus Myrf +/+ mice. n = 3; P = 0.0020. (E) Quantitative RT-PCR showing a decrease in Myrf mRNA expression in Myrf +/− mice versus Myrf +/+ mice. n = 6; P = 0.0217.

3.2. Decreased VA was detected in Myrf+/− mice
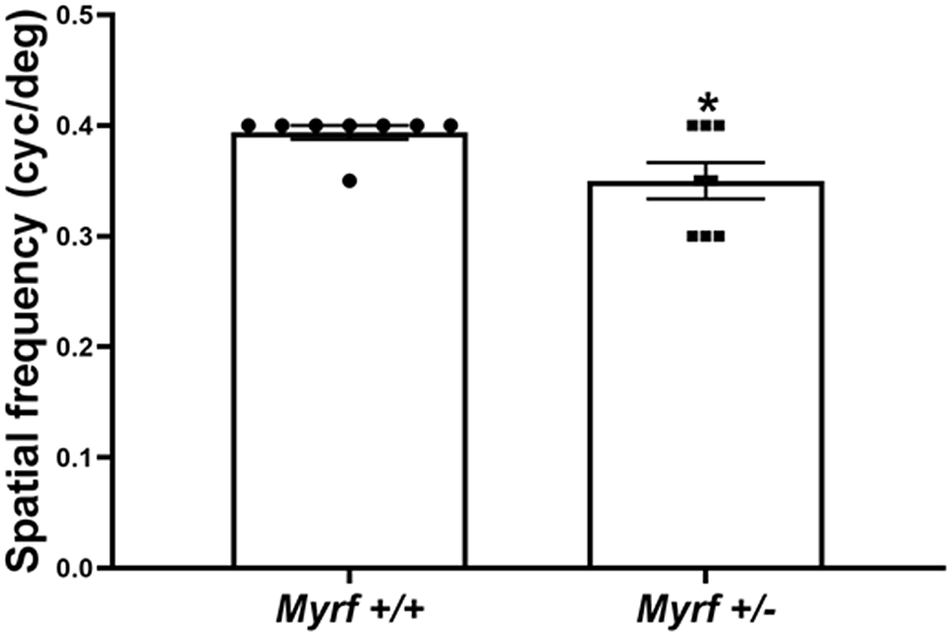
At first, to determine whether there was a change in retinal spatial vision in Myrf +/− mice, the OMR system was used to noninvasively assess VA in mice. A moderate decrease in VA was detected in PW8 Myrf +/− mice. The average VA of PW8 Myrf +/− mice was 0.350 ± 0.043 cyc/deg, whereas the average VA was 0.394 ± 0.017 cyc/deg in PW8 Myrf +/+ controls (P = 0.0256; Fig. 3).
VA is assessed using an OMR system. Spatial frequency (VA) was found reduced in Myrf +/− mice in comparison to that in Myrf +/+ control mice. n = 8 mice; P = 0.0256.

3.3. Reduced amplitude of ERG in Myrf+/− mice
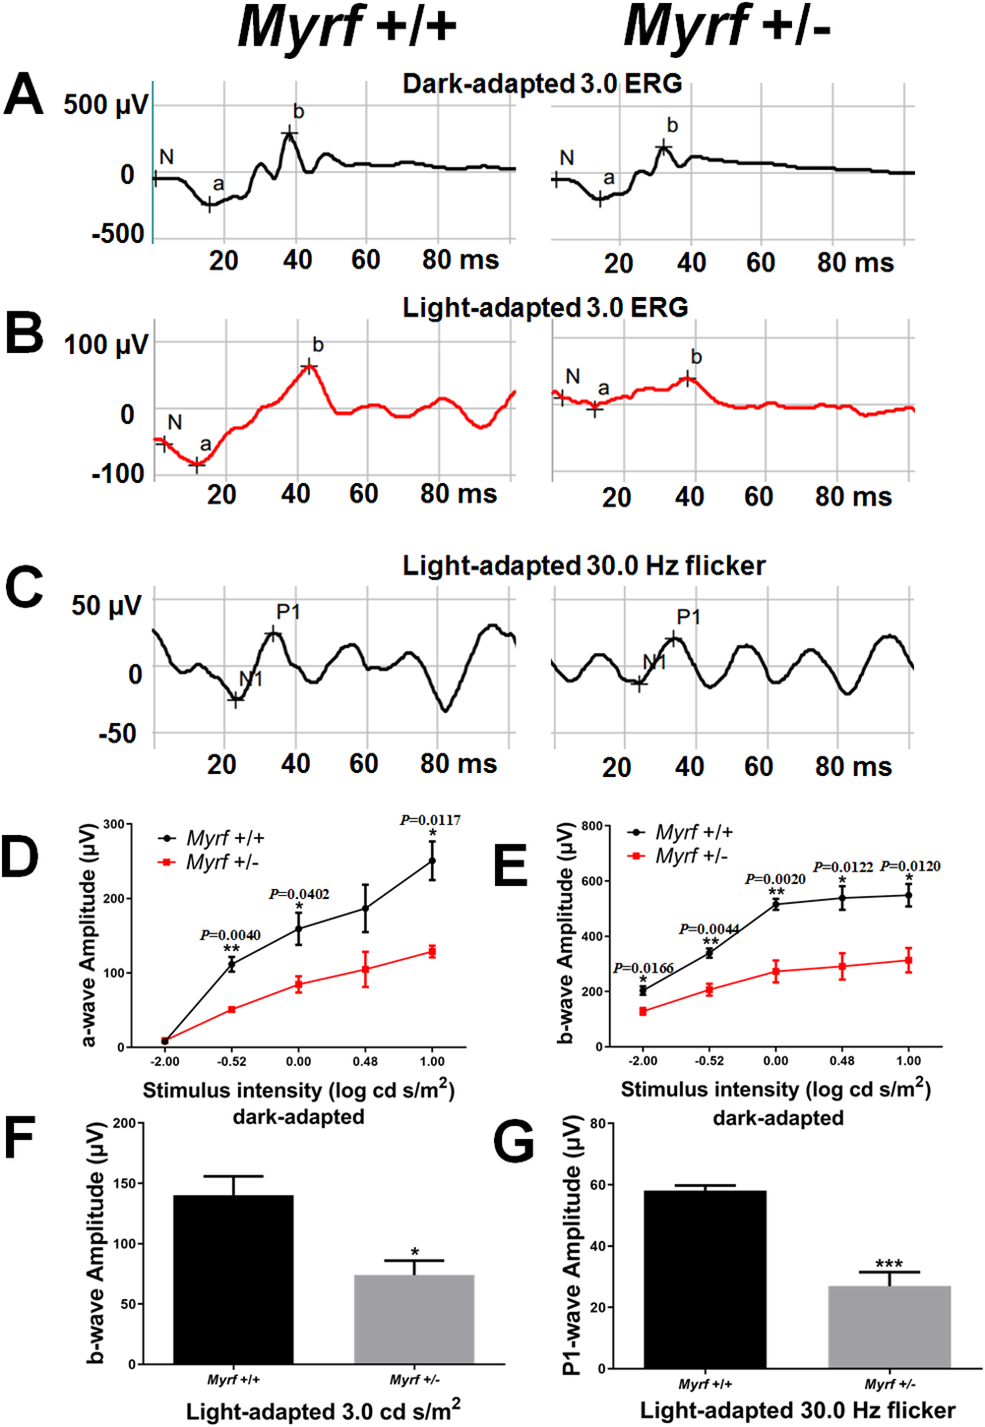
ERG was recorded to investigate the physiological condition of the retinas in Myrf +/− mice at PW8. In the dark-adapted ERG, the amplitudes of both the a-wave and the b-wave in Myrf +/− mice were reduced by approximately 50% compared with the Myrf +/+ control mice (Fig. 4D and 4E). Meanwhile, under light-adapted conditions, a significant reduction in b-wave amplitude with photopic 3.0 ERG was detected in Myrf +/− mice, at an average of 74 ± 20 μV, while the value of Myrf +/+ control mice was 140 ± 31 μV (P = 0.0001; Fig. 4F). Subsequently, amplitude of P1-wave in photopic 30-Hz flicker ERG significantly decreased in Myrf +/− mice with an average of 27 ± 9 μV, and 58 ± 3 μV in Myrf +/+ in control mice (P = 0.0256; Fig. 4G).
A reduction in amplitudes of both dark-adapted and light-adapted ERGs in Myrf+/− mice. (A–C) Representative ERG traces from 8-week-old mice under scotopic (A), photopic (B), or photopic 30-Hz flicker (C) conditions with the noted intensity stimuli. (D) Reduced amplitudes of the a-wave in Myrf+/− mice in dark-adapted conditions (n = 5 mice). The intensity of the stimulus flashes varied from −2.00 to 1.00 log cd s/m2. (E) Reduced amplitudes of the b-wave in Myrf+/− mice in dark-adapted conditions (n = 5 mice). The intensity of the stimulus flashes varied from −2.00 to 1.00 log cd s/m2. (F) Significantly reduced amplitudes of the b-wave in Myrf+/− mice after light-adapted conditions with a stimulus intensity of 0.48 log cd s/m2. n = 5 mice; P = 0.0001. (G) Significantly reduced amplitudes of P1-wave in Myrf+/− mice in light-adapted conditions. The flicker stimulus intensity was set at 0.48 log cd s/m2 with the frequencies of 30 Hz. n = 5 mice; P = 0.0256.

3.4. Moderate reduction of ONL thickness with rod and cone defects in Myrf+/− mice
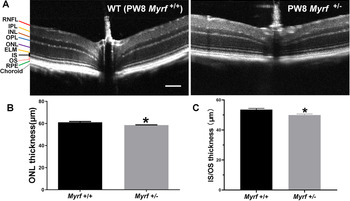
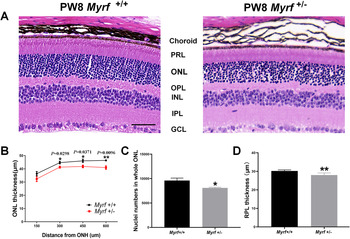
Following our findings that retinal spatial vision and physiological functions were impaired in Myrf +/− mice, we subsequently investigated whether their cellular pathology occurred in the retinas of mice with MYRF knockdown. The retinal cellular structure was examined using both SD-OCT and HE staining. SD-OCT revealed a decrease of ONL thickness in PW8 Myrf +/− mice (58.50 ± 0.43 μm in PW8 Myrf +/− mice and 61.07 ± 1.55 μm in the Myrf +/+ control mice; P = 0.0129; Fig. 5B). We also have measured the thickness of ONL at PW4 and PW12 (Fig. S2B; 58.13 ± 0.73 μm for PW4 Myrf +/− mice and 57.21 ± 2.22 μm for PW12 Myrf +/− mice). Furthermore, histological analysis revealed that the ONL thickness was significantly reduced in PW8 Myrf +/− mice by approximately 4 μm compared to Myrf +/+ control mice (Fig. 6B). Moreover, a significant reduction in ONL was found in histological sections from postnatal (P) 10 to P20 (Fig. S3). At PW8, a reduction in IS/OS thickness (53.55 ± 1.71 μm for Myrf +/− mice and 49.9 ± 1.5 μm for Myrf +/+ mice; P = 0.0127; Fig. 5C), a significant reduction of PRL thickness (30.19 ± 0.53 μm for Myrf +/− mice and 27.99 ± 0.99 μm for Myrf +/+ mice; P = 0.0044; Fig. 6D), as well as a decrease in nuclei numbers in whole ONL (8093 ± 292 for Myrf +/− mice and 9602 ± 1005 for Myrf +/+ mice; P = 0.0204; Fig. 6C) suggested a change in photoreceptors in PW8 Myrf +/− mice.
Morphological changes in Myrf +/− mice retina using SD-OCT. (A) Representative retinal SD-OCT images from Myrf +/+ and Myrf +/− mice, showing decreased thickness in ONL in Myrf +/− mice. Scale bar: 100 μm. RNFL = retinal nerve fiber layer; IPL = inner plexiform layer; INL = inner nuclear layer; OPL = outer plexiform layer; ONL = outer nuclear layer; ELM = external limiting membrane; IS = inner segment; OS = outer segment; RPE = retinal pigment epithelium. SD-OCT images were adjusted with contrast and brightness for display purposes only. The adjustment is performed not prior to quantitative image analysis. (B) A significant reduction in ONL thickness was measured by SD-OCT in Myrf +/− mice (n = 6 mice; P = 0.0129). (C) Quantification of IS/OS thickness showing a significant reduction of IS/OS thickness in Myrf +/− mice compared with Myrf +/+ mice. n = 6 mice; P = 0.0127.

Morphological changes in Myrf +/− mice retina using HE staining. (A) Representative retinal sections of HE staining showing disorganized nuclei. Scale bar: 50 μm. GCL = ganglion cell layer; IPL = inner plexiform layer; INL = inner nuclear layer; OPL = outer plexiform layer; ONL = outer nuclear layer; PRL = photoreceptor layer. (B) The thickness of ONL is significantly reduced in Myrf +/− mice (n = 5 retinal sections). ONH = optic nerve head. (C) Quantification of nuclei numbers in whole ONL. Nuclei numbers are significantly decreased in Myrf +/− mice compared with Myrf +/− mice (n = 5 retinal sections; P = 0.0204). (D) Quantification of PRL thickness showed a significant reduction of PRL thickness in Myrf +/− mice compared to that in Myrf +/+ mice. n = 5 retinal sections; P = 0.0044.

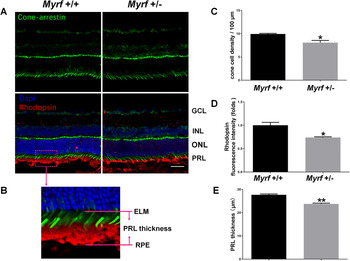
To quantify the loss of photoreceptors, the expression of photoreceptor-specific proteins including rhodopsin (rods) and cone-arrestin (cones) in Myrf+/− mice were examined by immunohistochemistry. The results demonstrated a statistically significant loss of cone cell density and rhodopsin fluorescence intensity in the retina of Myrf +/− mice compared with Myrf +/+ mice at PW8 (P = 0.0195 and P = 0.0155, respectively; Fig. 7A–7D). Moreover, PRL thickness was significantly decreased in Myrf +/− mice compared with Myrf +/+ mice at PW8 (23.76 ± 0.45 μm for Myrf +/− mice and 27.65 ± 0.55 μm for Myrf +/− mice; P = 0.0015; Fig. 7E). Taken together, these findings demonstrate that MYRF is required for the maintenance of both rod and cone photoreceptor cells.
Expression of rhodopsin and cone-arrestin in the photoreceptor cells is downregulated in Myrf +/− mice. (A) Myrf +/+ mice and Myrf +/− mice retina were analyzed by immunohistochemistry using cone-arrestin (green in A) and rhodopsin (red in B) antibodies. Scale bar: 50 μm. GCL = ganglion cell layer; INL = inner nuclear layer; ONL = outer nuclear layer; PRL = photoreceptor layer. (B) The schematic of the PRL thickness measurements. (C) Quantification of cone cell density at every 100-μm diameter retina. Cone cell density was significantly decreased in Myrf +/− mice compared to Myrf +/− mice. n = 3 retinal sections; P = 0.0195. (D) Quantification of rhodopsin fluorescence intensity at every 100-μm diameter retina showed a significantly decrease of rhodopsin fluorescence intensity in Myrf +/− mice compared to that in Myrf +/− mice. n = 3 retinal sections; P = 0.0155. (E) Quantification of PRL thickness showed a significant reduction of PRL thickness in Myrf +/− mice compared to that in Myrf +/+ mice. n = 3 retinal sections; P = 0.0015.

3.5. Changes in the gene expression profile of Myrf+/− mice
To facilitate a deeper understanding of the underlying mechanisms by which Myrf deficiency leads to photoreceptor defects, RNA-seq of the retinas from three Myrf+/− mice and three Myrf+/+ mice at PW8 (the expression patterns of RNA-seq was available at https://www.ncbi.nlm.nih.gov/geo/query/acc.cgi?acc=GSE157806) was performed. A total of 289,172,548 clean reads were generated from all six cDNA libraries using the llumina Novaseq™ 6000 platform. The gene expression profile of Myrf +/− mice retinas were compared with that of Myrf +/+ mice retinas. Fold changes ≥2 or fold changes ≤0.5 and adjusted P-values ≤0.05 indicated significantly differential expression of genes.
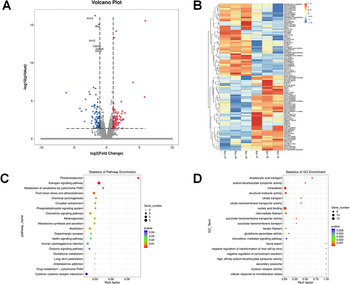
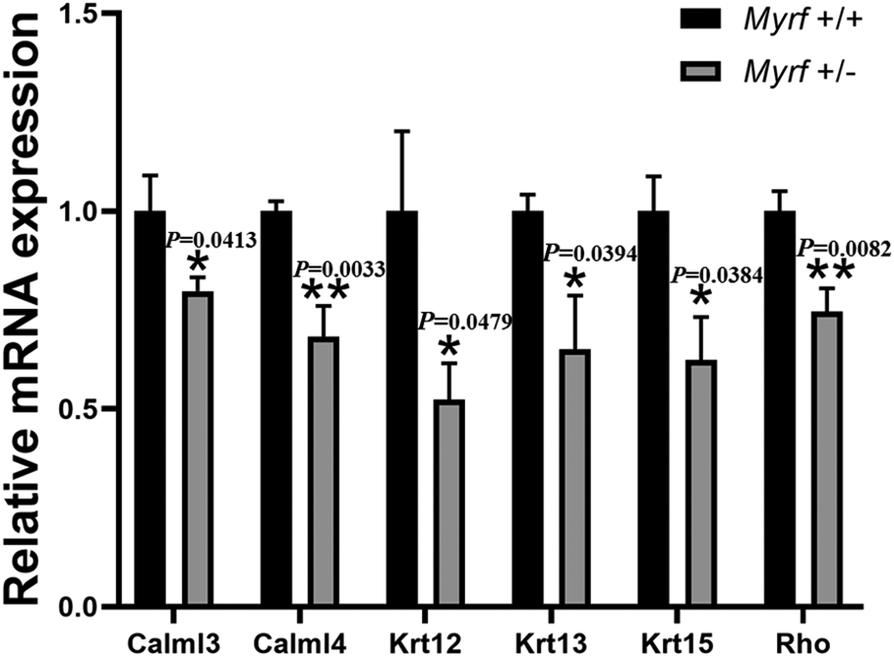
The RNA-seq identified a total of 196 significantly differentially expressed genes (DEGs). Among them, 108 DEGs were expressed at significantly higher levels, whereas 88 were expressed at significantly lower levels in Myrf +/− mice (Fig. 8A). The expression levels of the 108 DEGs identified in mice retinas were plotted as a heat map (Fig. 8B), and KEGG pathway enrichment and GO analyses of the DEGs were performed. The 20 most significant KEGG and GO pathways were selected as shown in Fig. 8C and 8D. KEGG analysis demonstrated that phototransduction and estrogen signaling pathways were relatively important, and RNA-seq results were validated by RT-PCR for the core genes in the two pathways. As expected, the expression of Rho, Calml4, Calml3, Krt12, Krt13, and Krt15 were significantly downregulated (Fig. 9).
GO and pathway enrichment analysis of DEGs in the retina (n = 3 mice). (A) Volcano plot of the DEGs. Significantly downregulated genes are in blue, significantly upregulated genes are in red, and nonsignificant genes are in gray. Black vertical lines highlight fold changes of −2 and 2, whereas black horizontal line represents a P-value of 0.05. (B) Hierarchical clustering of DEGs in the retina of Myrf+/− and Myrf+/+ mice. Red: high relative expression; blue: low relative expression. Fold changes ≥2 or fold changes ≤0.5 and adjusted P-values ≤0.05 for gene expression indicated significantly differential gene expression. (C) The 20 most significant pathways in the KEGG pathway enrichment analyses. P-values represent the level of significance of enrichment. (D) The 20 most significant biological processes in the GO enrichment analyses. P-values represent the level of significance of enrichment.

Quantitative RT-PCR validation of core genes identified in the RNA-seq analysis. The relative mRNA expression (folds) of core genes identified in the RNA-seq analysis were all significantly decreased in Myrf +/− mice compared to that in Myrf +/+ mice (n = 6).

4. Discussion
Previously, we reported MYRF as a candidate gene for nanophthalmos (Guo et al., Reference Guo, Zhao, Chen, He, Sun, Li, Liu, Zhang, Zhang, Li, Zhang, Ge, Liu, Zhang and Fan2019a). Thus, an Myrf knockdown mutant mouse strain was generated and used to investigate the cellular and molecular changes in the retina. In the current study, MYRF was found to be important for retinal development, and MYRF deficiency causes retinal photoreceptor development defects. The decrease of VA and ERG responses, atrophy of ONL, and the reduction of rods and cones in ONL in Myrf knockdown mice suggested that spatial vision and retinal physiological functions were impaired secondary to MYRF gene knockdown and photoreceptor development defects.
Myrf CKO mice (MRF fl/fl; Olig2wt/cre) developed severe tremors and ataxia 11 days postnatal, and subsequently developed seizures and died on the third PW (Emery et al., Reference Emery, Agalliu, Cahoy, Watkins, Dugas, Mulinyawe, Ibrahim, Ligon, Rowitch and Barres2009). These findings have established that MYRF is a critical transcriptional regulator essential for oligodendrocyte maturation and CNS myelination. However, our Myrf knockdown mouse model did not show abnormal behavioral features, such as tremors or ataxia, and no abnormal death occurred. Moreover, the NeuN staining in the hippocampus demonstrated no neuronal loss in Myrf +/− mice, which is a classic pathological change in epilepsy seizures (Fig. S1B). These findings suggested that unlike Myrf Olig2 CKO mice, the CNS of our Myrf +/− mouse model was normal.
On the other hand, we failed to find any RPE defects in Myrf knockdown mice (Fig. S1A). Two possible explanations were considered. First, the specific design and strategy in the development of our Myrf knockdown mouse strain may play an important role in phenotype variation. We hypothesized that the phenotypic discrepancy between various Myrf models was due to differences in the extent of the knockout technique. Our model is a whole-body Myrf heterozygous knockdown mouse stain generated using the latest CRISPR-Cas9 system, whereas the reported model is a conditional Myrf homozygous knockout mice generated using the CRE-LOXP system. Different mouse models targeting different mutation sites in the same gene might result in different disease phenotypes. Retinal spots, progressive photoreceptor degeneration, and a slight short axial length were found in Mfrprd6 mice (Kameya et al., Reference Kameya, Hawes, Chang, Heckenlively, Naggert and Nishina2002; Velez et al., Reference Velez, Tsang, Tsai, Hsu, Gore, Abdelhakim, Mahajan, Silverman, Sparrow, Bassuk and Mahajan2017). However, Mfrp174delG mice had RPE atrophy, more serious photoreceptor loss, but no change in axial length (Fogerty & Besharse, Reference Fogerty and Besharse2011). These varied findings in phenotypes among various Myrf knockout mice strain supported the fact that different phenotypes may result from the same Myrf targeted gene mutation in different mouse models.
Second, the MYRF-related RPE defects were dose-dependent. No RPE defects were identified in heterozygous Myrf CKO mice, whereas RPE pigmentation defect and retinal degeneration were obvious in Myrf homozygous CKO mice (Garnai et al., Reference Garnai, Brinkmeier, Emery, Aleman, Pyle, Veleva-Rotse, Sisk, Rozsa, Ozel, Li, Moroi, Archer, Lin, Sheskey, Wiinikka-Buesser, Eadie, Urquhart, Black, Othman, Boehnke, Sullivan, Skuta, Pawar, Katz, Huryn, Hufnagel, Camper, Richards and Prasov2019). Specific Cre tool was used to delete exon 8 of Myrf in the retina and RPE from embryonic day 10.5 (RxCre) in Myrf CKO mice, whereas CRISPR/Cas9 genetic editing technology was used to perform a deletion between exon 2 and exon 14 of Myrf in the whole body. Considering the incomplete excision of the floxed loci, the actual Cre-mediated excision efficiency in the targeted cell lineage varied and might be responsible for numerous studies reporting the lack of phenotype in the targeted cell types in which Cre expression was detected (Bao et al., Reference Bao, Ma, Schuster, Lin and Yan2013; Sandlesh et al., Reference Sandlesh, Juang, Safina, Higgins and Gurova2018). Therefore, different range and efficiency of Myrf deletion in our Myrf +/− mouse model and Myrf RxCre CKO mouse model might explain why the eye phenotype in Myrf heterozygous CKO mice was less severe compared with Myrf +/− mice. Considering that Myrf homozygous knockout mice die prematurely, we can only investigate the role of MYRF in heterozygous Myrf knockdown mice. These findings imply that Myrf might have a direct impact on retinal photoreceptors, which is not considered a secondary effect due to RPE pathology. However, we cannot rule out the possibility that retinal photoreceptor defects detected might be secondary or parallel to RPE anomaly, particularly at a molecular pathology level, since MYRF is higher expressed in RPE than in the retina and this needs further investigations.
The OMR system is used as a fast and simple behavioral method to quantify spatial vision in mice (Prusky et al., Reference Prusky, Alam, Beekman and Douglas2004; Barabas et al., Reference Barabas, Huang, Chen, Koehler, Howell, John, Tian, Rentería and Krizaj2011). Based on the principle of involuntary compensatory mechanisms for image stabilization during gratings motion, the mouse head movements can reflect its spatial vision (Prusky et al., Reference Prusky, Alam, Beekman and Douglas2004; Kretschmer et al., Reference Kretschmer, Sajgo, Kretschmer and Badea2015). Using the OMR test, the maximum VA was ~0.39 cyc/deg in WT mice and was similar to a previous study (Xiao et al., Reference Xiao, Adil, Chang, Yu, Yang, Utheim, Chen and Cho2019). Meanwhile, in PW8 Myrf +/− mice, VA decreased, indicating an impaired spatial vision. Moreover, both the photopic and scotopic ERG responses declined in PW8 Myrf +/− mice, indicating a loss of both rod and cone photoreceptor functions. Furthermore, slight atrophy of ONL in Myrf +/− mice was detected by SD-OCT imaging and HE staining. HE staining revealed significantly reduced ONL thickness at P10 and P20 (Fig. S3). SD-OCT imaging showed that atrophy of ONL began at PW4 and no progressive degeneration was observed at PW8 and PW12 (Fig. S2). Therefore, these results suggested that the photoreceptor defeats in Myrf +/− mice were developmental defects but not degenerated defects. Immunofluorescence analysis confirmed the decrease in rod and cone photoreceptors in PW8 Myrf +/− mice, supporting the idea that the loss of spatial vision and retinal functions correlates with a decreased number of rod and cone photoreceptors.
RNA-seq was performed to investigate the underlying molecular mechanism associating Myrf deficiency with photoreceptor defects. A total of 196 significantly DEGs between Myrf +/− mice and Myrf +/+ mice were identified. Furthermore, KEGG analysis revealed that alterations in phototransduction and estrogen signaling pathways are important in retinal neuron defects. Among the phototransduction-associated genes that reduced transcription, Rho, Calml4, and Calml3 were significantly downregulated in Myrf +/− mice. Rho downregulation was consistent with decreased rhodopsin protein production and reduced b-wave amplitude of the dark-adapted ERG. Calml4 and Calml3 primarily bind calcium ions to regulate downstream optical signal transduction in rod cells. Moreover, decreased expression of Calml4 and Calml3 is likely related to the impairment of visual function in mice. As members of the calmodulin family, Calml4 and Calml3 also play an important role in the estrogen signaling pathway (O’Neill et al., Reference O’Neill, Blewett, Loria and Greene2008). In addition, we detected that the expression of Krt12, Krt13, and Krt15 was significantly downregulated. Estrogen influences synaptic plasticity and brain development (Simpkins et al., Reference Simpkins, Wen, Perez, Yang and Wang2005; Marin et al., Reference Marin, Guerra, Alonso, Ramirez and Diaz2005), and also contributes to shaping the cytoskeleton and morphology of oligodendrocytes via the Rho/ROCK/cofilin pathway during various stages of the myelination process (Hirahara et al., Reference Hirahara, Matsuda, Liu, Yamada, Kawata and Boggs2013). 17b-Oestradiol (E2) is locally synthesized in the retina, and estrogen receptor α is expressed in the outer synaptic layer (Cascio et al., Reference Cascio, Russo, Drago, Galizzi, Passantino, Guarneri and Guarneri2007). Therefore, it is rational to hypothesize that estrogens also modulate synapses between neurons in the retina. Several studies have demonstrated that naturally occurring estrogens and synthetic analogs are effective neuroprotectants in retinal diseases, including age-related macular degeneration and diabetic retinopathy (Kumar et al., Reference Kumar, Simpkins and Agarwal2008). Similarly, the expression of rhodopsin is dose-dependent with the treatment of waterborne β-estradiol in mosquitofish females, indicating that estrogens might influence the visual perception based on their modulation of sensory systems (Friesen et al., Reference Friesen, Ramsey and Cummings2017). However, the interaction between phototransduction and estrogen signaling pathways needs further investigation.
A limitation of this study is the possibility of off-target effects in CRISPR editing, although we took measures to reduce this effect. Using existing bioinformatics tools, Myrf gene sequence was analyzed and predicted comprehensively, and finally, we have designed the most efficient sgRNAs to prevent the off-targets. Moreover, specifically modified Cas9 mRNA was used for microinjection, and its shear capacity was limited, so that the possibility of off-targets was greatly reduced and with a high success rate. Moreover, the concentration of the Cas9 mRNA and sgRNA injection was determined after several attempts, to minimize the risk of missing the target. Furthermore, F2 Myrf heterozygous mice were used in this study, and off-target CRISPR effects are very likely to be diluted away by repeated outcrossing.
In conclusion, we have successfully created an Myrf knockdown mutant mouse strain using CRISPR-Cas9 technology. The Myrf knockdown mutant mouse strain serves as a new model to investigate the genetic function of MYRF. We have since found that the loss of MYRF leads to retinal photoreceptor development defects, with impairment of spatial vision and retinal electrophysiological functions, suggesting an important role of MYRF in retinal development. Alterations in phototransduction and estrogen signaling pathways might be the underlying molecular mechanisms responsible for retinal photoreceptor development defects in Myrf deficiency.
Supplementary Materials
To view supplementary material for this article, please visit http://dx.doi.org/10.1017/S0952523821000043.
Acknowledgments
The authors thank GemPharmatech Co., Ltd. for their technical support in the CRISPR Design.
Author Contributions
Xiaowei Yu, Nannan Sun, and Xue Yang contributed equally to this work.
Funding Statement
This work was supported by the Guangzhou Science and Technology Plan Project (Grant 201803040020 and 201903010065; Guangzhou, China), Guangdong Natural Science Foundation (Grant 2020A151501168; Guangzhou, China); and Research Funds of the State Key Laboratory of Ophthalmology (Grant PT1001022).
Conflict of Interest
The authors declare that there are no conflicts of interest.