Implications
Beef is characterized by a high and uncontrolled variability of its sensory attributes, especially tenderness, which is one reason for consumer dissatisfaction. There is still no simple, reliable and reproducible technique to predict quality, which is a limitation to the delivery of a consistent quality meat. Thus, identification of markers of quality attributes is of major socio-economic importance. Recently, we reported that expression of DNAJA1 was a negative tenderness marker. This study examines DNAJA1 expression in bovine muscles having different metabolic specificities during development and according to management factors. It should help to increase knowledge of DNAJA1 expression, and to screen for live animals with favourable muscle properties and potentially high-quality meat.
Introduction
Intrinsic attributes of meat quality, especially tenderness, depend on muscle characteristics of live animals and post mortem factors associated with ageing and cooking treatments of meat, which themselves depend on genetic, nutritional and management factors. Thus, it is of interest for rearing or breeding purposes to predict the ability of live animals to produce ‘high-quality’ meat (Cassar-Malek et al., Reference Cassar-Malek, Picard, Bernard and Hocquette2008). In the case of beef, specific attention is paid to tenderness, which is the top priority sensory quality attribute and which depends partly on muscle metabolic properties. Thus, the beef industry is looking for pertinent biological indicators that would identify live animals with desirable quality attributes to direct them towards the most suitable production system. Transcriptomic studies revealed that low expression of the DNAJA1 gene in muscle is associated with elevated beef tenderness (Bernard et al., Reference Bernard, Cassar-Malek, Le Cunff, Dubroeucq, Renand and Hocquette2007). Its high expression would therefore be a marker of toughness (Bernard-Capel et al., Reference Bernard-Capel, Cassar-Malek and Hocquette2009). The gene encodes a heat shock protein 40 (Hsp40). It is a co-chaperone of Hsp70, an Hsp that is constitutively expressed in mammalian skeletal muscles and quickly induced by a heat stress (Oishi et al., Reference Oishi, Taniguchi, Matsumoto, Ishihara, Ohira and Roy2002) or exercise-associated increase with contractile activity (Kayani et al., Reference Kayani, Morton and McArdle2008). However, the reason why DNAJA1 is involved in tenderness is still questionable. The protein exhibits an anti-apoptotic activity (Gotoh et al., Reference Gotoh, Terada, Oyadomari and Mori2004) and high levels in muscles could delay cell death, an early process occurring post-slaughter in muscle (Ouali et al., Reference Ouali, Herrera-Mendez, Coulis, Becila, Boudjellal, Aubry and Sentandreu2006). Pre- and postnatal gene expressions determine the final outcome of muscle composition, growth and differentiation/maturation, and therefore are critical for meat quality (Hocquette et al., Reference Hocquette, Ortigues-Marty, Pethick, Herpin and Fernandez1998; Greenwood and Cafe, Reference Greenwood and Cafe2007). Currently, few data concern endogenous expression and developmental changes as well as regulation of DNAJA1 expression by exogenous factors. Thus, we designed a study in order to obtain a general understanding of how the gene is regulated throughout development. Here, we investigated intracellular levels of this protein and their corresponding transcripts in bovine muscles having different metabolic specificities in animals during development and according to management factors (e.g. dietary factors, growth curve and stress status at slaughter).
Material and methods
Experimental designs
Muscle foetal development
Charolais foetuses were generated by artificial insemination of Charolais cows with the semens of two Charolais bulls as reported earlier (Chaze et al., Reference Chaze, Meunier, Chambon, Jurie and Picard2009). They were collected from cows slaughtered at the Experimental INRA slaughterhouse at pregnancy days 60 (n = 4), 110 (n = 4), 180 (n = 4), 210 (n = 4) and 260 (n = 4). The Semitendinosus (ST) muscle was excised within 15 min, frozen directly in liquid nitrogen and stored at −80°C until analysis.
Dietary treatments
The experiment was conducted with Charolais steers and the experimental design described earlier (Jurie et al., Reference Jurie, Ortigues-Marty, Picard, Micol and Hocquette2006). Animals were offspring of pure-bred Charolais cows and bulls of an INRA experimental herd (Le Pin au Haras, F61), weaned at 32 weeks and then housed in open sheds. Animals were castrated at 9 months of age. Thirty steers were initially allotted to two groups, 12 animals in a maize group and 18 animals in a grass group. For the second grazing season, groups of animals were formed as follows: 24 animals of which 12 from the grass group and 12 from the maize group were housed in open sheds (a maximum of six animals per pen of 40 m2 each, and the remaining six animals fed on grass were kept grazing at pasture. For this study, six animals that were given maize-silage ad libitum, with a minimum of wheat straw and rapeseed meal allotted in the maize-silage group, and the six animals allotted in the pasture-feeding group were considered. All steers were managed at the same growth rate and were slaughtered at 30 months of age at the Experimental INRA slaughterhouse. The Rectus abdominis (RA) and ST muscles, which differ in their contractile and metabolic properties (Talmant et al., Reference Talmant, Monin, Briand, Dadet and Briand1986), were excised from each animal within less than 15 min after slaughter. Muscle samples were snap-frozen in liquid nitrogen and stored at −80°C until analysis.
Growth path
The experiment was conducted with 42 Montbéliard steers as described earlier (Cassar-Malek et al., Reference Cassar-Malek, Hocquette, Jurie, Listrat, Jailler, Bauchart, Briand and Picard2004). A restriction/refeeding path was designed to induce a discontinuous growth. Practically, at 9 months of age, 21 steers were given a restricted amount of diet for 3 months and then slaughtered at 12 months of age (R group; n = 10; dry matter (DM) intake: 5.3 kg/day per animal) or submitted to an additional 4-month ad libitum refeeding period (R/F group; n = 11; DM intake: 9 kg/day per animal) with the same diet (11.0 to 11.1 MJ metabolizable energy per kg DM) before slaughter at 16 months of age. In addition, 21 control steers were allowed to gain continuously between 9 and 12 months of age on the same diet. Animals were then slaughtered (C12 group; n = 10; DM intake: 7.1 kg/day per animal) or even maintained on a continuous feeding protocol up to 16 months of age and then slaughtered (C16 group; n = 11; DM intake: 8.1 kg/day per animal). The Triceps brachii (TB) and ST muscles, which differ in their contractile and metabolic properties (Talmant et al., Reference Talmant, Monin, Briand, Dadet and Briand1986), were excised and treated as described above.
Stress status at slaughter
The experiment was performed with 32 Normand cull cows (48 to 60 months old, mean live weight 642 kg) selected for their live weight, age and body fat score for a 100-day finishing period as described by Gobert et al. (Reference Gobert, Bourguet, Terlouw, Deiss, Berdeaux, Comte, Gruffat, Bauchart and Durand2009). Animals were randomly assigned to three isoenergetic and isonitrogenous rations. All rations were given a straw (30%) and concentrate (70%)-based diet supplemented with lipids (40 g oil/kg DM diet) provided by extruded linseed (n = 6) or by extruded linseeds (1/3) and rapeseeds (2/3; n = 10), or by extruded linseeds associated with antioxidants (vitamin E and plant extracts rich in polyphenols from rosemary, grape, citrus and marigold; 155 IU/kg and 0.7 g/kg DM diet; n = 16) during their finishing period. Two slaughter conditions were used as described in Bourguet et al. (Reference Bourguet, Deiss, Gobert, Durand, Boissy and Terlouw2010). Half of the cows from each feeding group were slaughtered at the Experimental INRA slaughterhouse under limited stress (LS) conditions (7-min transport to the abattoir located at 2 km from the experimental farm). Cows under LS conditions (LS group; n = 16) were accompanied in the lorry by a non-experimental companion to avoid social isolation stress. They were immediately slaughtered after unloading. The other half of the cows from each feeding group were submitted to stress conditions (S group; n = 16). Stress conditions consisted in additional physical exercise and psychological stress. Cows were individually transported towards an unfamiliar farm (15 min transport) and unloaded at the entrance of a labyrinth and taken through three times (28 min accompanied by two purposely noisy experimenters), and finally they were individually transported to the abattoir (15-min transport) where they were immediately slaughtered. The Longissimus thoracis (LT) and ST muscles, which differ in their contractile and metabolic properties (Talmant et al., Reference Talmant, Monin, Briand, Dadet and Briand1986), were excised and treated as described above.
In all experimental designs, experimental procedures and animal holding facilities respected French animal protection, and were approved by the French veterinary services.
Immunodetection of DNAJA1 protein
Extraction of total muscle proteins was performed in a denaturation buffer (8.3 M urea, 2 M thiourea, 1% DTT, 2% CHAPS) as described by Bouley et al. (Reference Bouley, Chambon and Picard2004). Muscle protein concentration was determined by spectrophotometry with the Bradford assay (Bradford, Reference Bradford1976). Total extracted proteins were stored at −20°C before analysis. A monoclonal primary antibody (SPM251; sc-56400, Santa Cruz Biotechnology, Inc., Santa Cruz, CA, USA) was used for DNAJA1 immunodetection.
Western blot analysis
Western blot analysis was performed according to the method of Guillemin et al. (Reference Guillemin, Meunier, Jurie, Cassar-Malek, Hocquette, Leveziel and Picard2009). Briefly, 15 μg of total extracted proteins were separated in a 12% polyacrylamide gel at 120 V, at 4°C for 90 min in the Mini-Protean apparatus (BioRad, Marnes La Coquette, France). Proteins were then transferred to a polyvinylidene fluoride (PVDF) membrane Millipore (Dutscher Dominique SAS, Brumath, France) with Trans-Blot Cell apparatus (BioRad, France) at 210 mA at 4°C for 60 min. The PVDF membrane was incubated in a 10% milk-blocking buffer at 37°C for 20 min to block non-specific binding and thereafter in the primary antibody solution (SPM251, TEBU BIO ref sc-56400, dilution 1/250). The blots were then incubated with a secondary antibody (IgG anti-mouse NX931, GE Healthcare, Aulnay Sous Bois, France) conjugated with horseradish peroxidase (dilution: 1/20000). Enzyme activity was revealed by ECL Western Blotting Kit (Perbio Science France SAS, Brerbières, France). Western blot images were quantified under ImageQuant TL v2003 (GE Healthcare).
Dot Blot analysis
Dot Blot analysis was performed as described by Guillemin et al. (Reference Guillemin, Meunier, Jurie, Cassar-Malek, Hocquette, Leveziel and Picard2009). Briefly, 15 μg of total extracted proteins were deposited on a nitrocellulose membrane with Minifold I Dot Blot apparatus (Shleicher & Schuell Bioscience, Dassel, Germany). All samples were loaded randomly in quadruplicate. A mixed sample consisting of a pool of all samples was used as a standard for data normalization. Dot Blot membranes were air-dried for 5 min, blocked in 10% milk blocking buffer at 37°C for 20 min, and then incubated with the primary antibody (SPM251, TEBU BIO ref sc-56400, dilution 1/250). Secondary fluorescent-conjugated IRDye 800CW antibody (anti-mouse) was supplied by LI-COR Biosciences (Lincoln, Nebraska, USA) and used at 1/20000. Then the membranes were scanned by the scanner Odyssey (LI-COR Biosciences, Lincoln, Nebraska, USA) at 800 nm. Protein abundance for each sample, given in arbitrary units, was normalized according to a mix of different samples, used as a reference. Protein quantification was performed by infrared fluorescence detection. Dot Blot images were quantified under GenePix PRO v6.0 (Axon, Union City, CA, USA).
Detection of DNAJA1 transcripts
DNAJA1 gene expression was performed by quantitative RT-PCR (qPCR) as described by Bernard et al. (Reference Bernard, Cassar-Malek, Le Cunff, Dubroeucq, Renand and Hocquette2007) using the primer pair Fw: AGGGTCGCCTAATCATTGAA and Rev: TCCTCGTATGCTTCTCCATTG. Briefly, total RNA was extracted from muscles using Trizol reagent (LifeTechnologies). RNA was then purified and treated with DNAse using the RNeasy® Mini kit (Qiagen, Courtaboeuf, France) and its integrity checked using Lab Chip Agilent technology (Agilent Technologies, Palo Alto, USA). qPCR was realized using SYBR Green I dye in the StepOne Plus System (Applied BioSystems, Courtaboeuf, France). The reaction was subjected to melting curve analysis to confirm single amplified products. The Real-Time PCR experiment was controlled using the CDH11 gene (FW: GGGTCCCTGAGCTCCTTAGA and Rev: AGATTCCTCAGAACGCCAGA as described by Bernard et al. (Reference Bernard, Cassar-Malek, Renand and Hocquette2009)) and the TBP gene (FW: CCTAAAGACCATTGCACTTCG and Rev: CTTCACTCTTGGCTCCTGTGG) as internal references for the postnatal and foetal periods, respectively. Data were expressed relative to the amount of cDNA, using a standard dilution curve. The quantity (arbitrary units) of transcripts was determined by using a linear relationship between amounts of standards cDNA and their Ct (Cycle threshold).
Enzyme activities
Maximal activity levels of enzymes reflecting the glycolytic (phosphofructokinase, PFK, lactate dehydrogenase, LDH) and oxidative (isocitrate dehydrogenase, ICDH, cytochrome-c oxidase, COX) metabolic pathways were determined by spectrophotometry according to the methods cited by Jurie et al. (Reference Jurie, Ortigues-Marty, Picard, Micol and Hocquette2006). One unit of the enzyme was defined as the amount which catalyses per minute the disappearance of 1 μmol of Nicotinamide Adenine di Nucleotide (NADH) for PFK and LDH, the reduction of 1 μmol of Nicotinamide Adenine di Nucleotide Phosphate (NADP) for ICDH, and the oxidation of 1 μmol of cytochrome-c for COX. Results are expressed in μmol/min per gram of fresh tissue.
Statistical analysis
All statistical analyses were conducted using the GLM procedure of SAS.
For expression of the DNAJA1 protein during muscle foetal development, the effect of foetal age was tested in the model.
For each experimental design (feeding treatments, growth path or stress status), data were analysed in a model that contained the effects of the management factor considered, muscle, animal tested within the management factor and the muscle × management factor interaction. The animal variation was used as the error term for the ‘management factor considered’ effect. The pre-planned contrast was used to evaluate the impact of stress status.
From the data for each experimental design (feeding treatments, growth path or stress status), since no muscle × management factor interaction was detected, only the main effects are reported in the tables. All results were presented as adjusted means with appropriate standard errors of means (s.e.). The adjusted means for DNAJA1 transcripts were adjusted for the CDH11 or TBP level (the statistical model contained the CDH11 or TBP level as a covariate; Hocquette and Brandstetter, Reference Hocquette and Brandstetter2002). When significant effects were detected, differences between adjusted means were further evaluated by the PDIFF option of SAS. A difference between groups was considered significant when P < 0.05.
Results
Expression during development
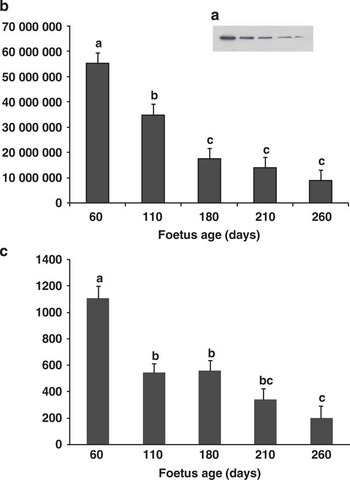
The abundance of the DNAJA1 protein in the ST muscle according to the foetal age is presented in Figure 1 (A and B). Significant changes were observed all through pregnancy (age effect: P < 0.001). Muscle DNAJA1 protein was the highest at day 60, decreased by 1.6-fold between days 60 and 110 (P < 0.01), and by 2-fold between days 110 and 180 (P < 0.01). Then it decreased, although not significantly, between days 180 to 210 and 260. Accordingly, the abundance of DNAJA1 transcripts (Figure 1C) also decreased between days 60 and 260 (P < 0.001).
Expression of DNAJA1 during bovine foetal myogenesis. (A, B) Abundance of the DNAJA1 protein: the protein was detected by Western blot in the ST muscle of foetuses (n = 4) at five key developmental stages (pregnancy days 60, 110, 180, 210 and 260). (A) Representative Western blot showing DNAJA1 expression; (B) Western blots were quantified by densitometric analysis. (C) Abundance of the DNAJA1 transcripts: DNAJA1 transcripts were quantified by qPCR, using a linear relationship between the amount of standard cDNA and the cycle threshold. (B, C) Data are expressed as least squares means ± s.e. (arbitrary units) for DNAJA1 mRNA levels adjusted for TBP levels (the statistical model contained TBP levels as a covariate). a,b,cMean values with different superscript letters are significantly different among ages (P < 0.05).

Influence of management factors
As mentioned earlier, no ‘muscle × management factor’ interaction was detected, and therefore only the main effects (muscle, feeding regimen, growth path and stress status) were considered.
Feeding treatments
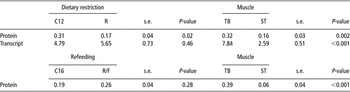
Muscle abundance of the DNAJA1 protein and its transcripts did not significantly differ between feeding treatments (pasture v. maize-silage-based diet, P = 0.13). Protein abundance was 4.2-fold higher (P < 0.001) in RA than in ST muscle (Table 1); however, no difference in the transcript abundance was noted between both muscles.
Influence of feeding treatments (pasture-feeding v. maize-silage) on the abundance of DNAJA1 protein and transcript in RA and ST muscles of Charolais steers

RA = Rectus Abdominis; ST = Semitendinosus.
No ‘muscle × feeding regimen’ interaction was detected. Abundance of the DNAJA1 protein and transcript was analysed by Western blot and qRT-PCR, respectively in the muscles of steers fed on pasture (n = 6) v. on a maize-silage diet (n = 6). Results are presented as least squares means ± s.e. (arbitrary densitometry units) for protein abundance and least squares means ± s.e. (arbitrary units) for DNAJA1 mRNA levels adjusted for CDH11 levels (the statistical model contained CDH11 levels as a covariate).
Growth path
Muscle data from animals in the dietary restriction period and the refeeding period were analysed separately (Table 2). After the dietary restriction period, DNAJA1 protein abundance was reduced by 2-fold in the muscles of restricted compared to control animals (P = 0.02) without any change in the abundance of transcripts (P = 0.43). No significant difference in protein abundance could be detected at 16 months at the end of the compensatory period (P = 0.28). Muscle protein abundance was two times higher in TB than in ST muscle whatever the dietary restriction (P = 0.002) or the refeeding period (P < 0.001; Table 2). Accordingly, the level of DNAJA1 transcripts was higher in TB than in ST muscle at the end of the restriction period (P < 0.001). The level of transcripts in muscles after the refeeding period was not examined.
Influence of the growth path on the abundance of DNAJA1 protein and transcript in TB and ST muscles of Montbéliard young steers

TB = Triceps Brachii; ST = Semitendinosus.
No ‘muscle × growth path’ interaction was detected. Abundance of the DNAJA1 protein and transcript was analysed by Western blot and qRT-PCR, respectively in the muscles of steers. C12 (n = 10) and C16 (n = 11), control steers slaughtered at 12 and 16 months of age, respectively; R (n = 10), restricted steers slaughtered at 12 months of age; R/F (n = 11), restricted/refed steers slaughtered at 16 months of age. Results are presented as least squares means ± s.e. (arbitrary densitometry units) for protein abundance and least squares means ± s.e. (arbitrary units) for DNAJA1 mRNA levels adjusted for CDH11 levels (the statistical model contained CDH11 levels as a covariate).
In order to test in the model the effects of the age and muscle type, we performed a statistical analysis with only the control groups (C12 and C16). Effects of the muscle type (P < 0.001), age (P = 0.05) and the ‘age × muscle’ interaction (P = 0.10) were noted for protein abundance (data not shown in table) with a reduction by 1.6-fold in the control group (0.31 v. 0.19) between 12 and 16 months of age. The decrease was higher in ST than in TB muscle.
Stress status
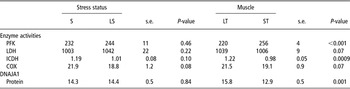
The influence of pre-slaughter stress on muscle metabolism and DNAJA1 protein abundance was investigated. Glycolytic enzyme activities (LDH and PFK) were not different, and oxidative enzyme activities tended to be higher (ICDH P = 0.10 and COX P = 0.08) in muscles of animals submitted to pre-slaughter stress (S) than in animals with LS. No significant difference was observed for muscle DNAJA1 protein abundance according to the stress status (Table 3). Significant differences were only recorded between muscles. Muscle oxidative enzyme activity (ICDH) and DNAJA1 protein abundance were higher by 24.5% and 22.5%, respectively (P < 0.001), in LT than in ST muscle. Conversely, muscle glycolytic enzyme activity (PFK) was 16.4% higher in ST than in LT muscle (P < 0.001; Table 3).
Influence of the stress status on the metabolic enzyme activities and the abundance of DNAJA1 protein in LT and ST muscles of Normand cull cows

LT = Longissimus Thoracis; ST = Semitendinosus; PFK = phosphofructokinase; LDH = lactate dehydrogenase; ICDH = isocitrate dehydrogenase; COX = cytochrome-c oxidase.
No ‘muscle × stress status’ interaction was detected. Activities of metabolic enzymes were assayed in the muscles of the stressed group (S; n = 16) and limited stress group (LS, n = 16) according to Jurie et al. (Reference Jurie, Ortigues-Marty, Picard, Micol and Hocquette2006). Results are presented in μmol/min per g. Abundance of the DNAJA1 protein was analysed by Dot blot in the experimental groups according to Guillemin et al. (Reference Guillemin, Meunier, Jurie, Cassar-Malek, Hocquette, Leveziel and Picard2009). Results are presented as least squares means ± s.e. (arbitrary densitometry units).
Discussion
In this study, we analysed the kinetics of DNAJA1 expression during bovine foetal myogenesis and investigated the impact of management factors during postnatal life. DNAJA1 belongs to the DNAJ proteins (Hsp40s) family consisting of over 40 members in humans, as revealed by a genome-wide analysis. These proteins are involved in cellular protein trafficking (specifically into the mitochondria and endoplasmic reticulum), are positive co-chaperones of HSP70, and have an Hsp activity (Qiu et al., Reference Qiu, Shao, Miao and Wang2006).
Developmental expression of DNAJA1
Little is known about the expression profile of Hsp40s during the development of tissues and this was the first study examining the DNAJA1 gene expression pattern during muscle development. Some DNAJ proteins can be expressed specifically in a tissue alone or some others universally in all tissues. In some cases, a tissue-specific expression was achieved through alternatively spliced transcripts. In mice, nDnaJA1 (a new splicing isoform of DNAJA1) was shown to be highly expressed in the testis and spermatogenic cells, whereas other spliced forms were highly expressed in other tissues (Terada et al., Reference Terada, Yomogida, Imai, Kiyonari, Takeda, Kadomatsu, Yano, Aizawa and Mori2005). In addition, it was more highly abundant in adult than in foetal testes (Terada et al., Reference Terada, Yomogida, Imai, Kiyonari, Takeda, Kadomatsu, Yano, Aizawa and Mori2005). In mice, loss of DNAJA1 led to severe defects in spermatogenesis (Hu et al., Reference Hu, Zhou, Huang, Xu, Lu, Xu, Li and Sha2004), suggesting its critical role for spermatogenesis. DNAJA3, a mitochondrial Hsp40 was found to be differentially expressed during cardiac development and pathological hypertrophy (Hayashi et al., Reference Hayashi, Imanaka-Yoshida, Yoshida, Wood, Fearns, Tatake and Lee2006) and its crucial role for mitochondrial biogenesis was hypothesized.
In this study, we showed for the first time a regulation of the DNAJA1 expression in muscle during foetal myogenesis. Abundance of protein and transcripts was the highest at pregnancy day 60, a stage when muscle fibres mainly belong to the primary generation from which slow fibres originate (Picard et al., Reference Picard, Lefaucheur, Berri and Duclos2002). Then, it markedly decreased especially from day 180 of gestation, a crucial period for determination of the total number of muscle fibres. Finally, muscle DNAJA1 protein abundance was low and stable during the phase of intense contractile and metabolic differentiation of skeletal muscles (Cassar-Malek et al., Reference Cassar-Malek, Picard, Kahl and Hocquette2007). The lowest level of protein and transcripts was detected at the end of the gestation period. Although speculative, changes in DNAJA1 expression could be related to its cellular activities (e.g. chaperone and anti-apoptotic factor). As DNAJ proteins would assist Hsp70 in the folding and compartmentalization of nascent proteins (Vos et al., Reference Vos, Hageman, Carra and Kampinga2008), a high level of DNAJA1 protein could first reflect its role of a molecular co-chaperone limiting the number of misfold proteins in muscles undergoing high protein synthesis during intensive fibre formation and tissue remodelling. The decrease in DNAJA1 expression may be linked to the progressive dilution of the first generation of fibres by the secondary generation of fibres during development (Picard et al., Reference Picard, Lefaucheur, Berri and Duclos2002). Since DNAJA1/Hsp70 played a protective role against apoptosis (Gotoh et al., Reference Gotoh, Terada, Oyadomari and Mori2004), the age-related decrease noted for muscle DNAJA1 protein could also hallmark the acquisition of the resistance phenotype of muscle to apoptosis during the progression of myogenesis (Walsh, Reference Walsh1997).
Thus, this study showed that DNAJA1 expression was regulated throughout foetal myogenesis, a period critical for lifelong programming and for the construction of meat quality through different mechanisms.
Differential expression of DNAJA1 protein according to muscle types
In our series of experiments, we observed the highest DNAJA1 expression in the most oxidative muscles (TB, RA> ST, LT; Jurie et al., Reference Jurie, Ortigues-Marty, Picard, Micol and Hocquette2006; Oury et al., Reference Oury, Dumont, Jurie, Hocquette and Picard2010) both at the protein and transcript levels. In another study conducted in Charolais, abundance of DNAJA1 was negatively correlated with LDH in the ST and LT, and positively correlated with oxidative enzyme activities (e.g. ICDH and citrate synthase, CS) in the ST (N. Guillemin, personal communication). Oxidative muscles are known to have a higher potential for ‘oxidative stress’ than glycolytic muscles. More abundantly expressed Hsp (e.g. Hsp70 and Hsp27) in oxidative than glycolytic muscles (Locke et al., Reference Locke, Noble and Atkinson1991; Hamelin et al., Reference Hamelin, Sayd, Chambon, Bouix, Bibe, Milenkovic, Leveziel, Georges, Clop, Marinova and Laville2006; O'Neill et al., Reference O'Neill, Aubrey, Zeldin, Michel and Noble2006) would play a crucial role in the protection of tissues against oxidative stress. It is therefore not surprising that the abundance of DNAJA1, a key partner of Hsp70, was higher in these muscles. In addition, oxidation and reduction pathways reversely regulated DNAJA1 function in response to cell redox state (Choi et al., Reference Choi, Lee, Kim, Hwang, Lee, Chae, Kim, Chae and Kwon2006).
Dietary regulation of DNAJA1 expression
On the basis of differences between muscle types, changes in DNAJA1 expression may reflect a shift in muscle metabolism and anti-oxidant status. However, the lack of effect of the feeding treatments on the expression of DNAJA1 was unexpected, since in animals on pasture an orientation of muscle metabolism towards the oxidative type was observed (Jurie et al., Reference Jurie, Ortigues-Marty, Picard, Micol and Hocquette2006; Cassar-Malek et al., Reference Cassar-Malek, Jurie, Bernard, Barnola, Micol and Hocquette2009).
However, the lower muscle DNAJA1 abundance at the end of the restriction period probably reflected a higher antioxidant status induced by the feed restriction, although no change in oxidative metabolism was noted in the ICDH, COX and CS activities (Cassar-Malek et al., Reference Cassar-Malek, Hocquette, Jurie, Listrat, Jailler, Bauchart, Briand and Picard2004). Accordingly, Sreekumar et al. (Reference Sreekumar, Unnikrishnan, Fu, Nygren, Short, Schimke, Barazzoni and Nair2002) reported that an energy restriction would induce production of gene transcripts of the free radical scavenger pathway, suggesting a decrease in oxidative stress and downregulated transcript levels of genes involved in stress response/chaperone function (e.g. Hsp70, stress-inducible protein GrpE, DnaJ-like protein (RDJ1) and chaperonin 60). Reversed increase in protein levels during the compensation could be linked to a higher oxidative metabolism (Cassar-Malek et al., Reference Cassar-Malek, Hocquette, Jurie, Listrat, Jailler, Bauchart, Briand and Picard2004). Since no significant change in DNAJA1 transcripts was observed with the growth path, the differential effect of food restriction and then of food compensation on protein and transcript levels is still unclear. It possibly results from subtle changes in translational mechanisms, for example, mRNA stability and/or translational efficiency (Clarke and Abraham, Reference Clarke and Abraham1992).
Relationships with stress and meat quality
Several studies have shown that a variation in meat quality may be explained to a large extent by pre-slaughter emotional stress in pigs (Terlouw et al., Reference Terlouw, Porcher and Fernandez2005) and cattle (Lowe et al., Reference Lowe, Devine, Wells and Lynch2004; Gobert et al., Reference Gobert, Bourguet, Terlouw, Deiss, Berdeaux, Comte, Gruffat, Bauchart and Durand2009). Different studies showed that Hsps were related to beef quality since significant correlations were found between the abundance of either Hsp transcript or protein and tenderness (Bernard et al., Reference Bernard, Cassar-Malek, Le Cunff, Dubroeucq, Renand and Hocquette2007; Kim et al., Reference Kim, Cho, Lee, Park, Lee, Cho, Choy, Yoon, Im and Park2008; Morzel et al., Reference Morzel, Terlouw, Chambon, Micol and Picard2008). Therefore, a key issue addressed by this study was to investigate whether the animals more stressed before slaughter could have a differential DNAJA1 expression correlated to variations in beef quality. Interestingly, we did not find any relation between the stress status of animals at slaughter and the abundance of DNAJA1. This indicated that the level of DNAJA1 protein cannot be considered as an indicator of stress status in bovine muscles, at least in standardized conditions. Since cattle spend various times at the slaughterhouse before being slaughtered, further evaluation of DNAJA1 expression in muscle samples collected at different times of rest following stress exposure could elucidate if the gene does not at all respond to stress.
Lastly, meat tenderness is determined from the contributions of connective tissue, sarcomere length, muscle fibre properties determined pre-rigor and rate of proteolysis during ageing, as well as from contributions from intramuscular fat and post-mortem energy metabolism (Warner et al., Reference Warner, Greenwood, Pethick and Ferguson2010). However, all these factors vary to a great extent between muscle types, which explains why muscle type is the biggest determinant of quality. Thus, the differential expression of heat shock proteins, including DNAJA1, may contribute to the variability of beef quality across cuts. However, if DNAJA1 expression is correlated with tenderness scores intra muscle (Bernard et al., Reference Bernard, Cassar-Malek, Le Cunff, Dubroeucq, Renand and Hocquette2007), they very likely do not account for the differences in tenderness between two broiler muscles (the LT is more tender but with higher DNAJA1 expression than the ST).
Conclusion
In this study, we analysed the influence of factors related to the animal (muscle, age) and its growth curve on DNAJA1 expression. The highest expression of DNAJA1 was detected in the youngest animals and the most oxidative muscles. It varied according to the growth curve but not to feeding treatments. Interestingly, the abundance of the tenderness marker does not appear to be modulated by pre-slaughter stress, a crucial determinant for meat toughness. This should help to predict the animal muscle properties, and hence their aptitude to produce high-quality beef, when still alive, to orientate them into suitable production systems and therefore to guarantee constant meat quality.
Acknowledgements
The authors thank N. Dunoyer, G. Gentes and C. Nore for their skilled collaboration and the technical staff of the experimental slaughterhouse and experimental facilities of INRA at URH and the Pin au Haras. This work has been performed within the EU FP6 Integrated Project ProSafeBeef, contract FOOD-CT-2006-36241. The financing of the work by the European Union is gratefully acknowledged for laboratory analyses. Animals and samples were funded through INRA grants in the context of internal programmes of the Herbivore Research Unit entitled ‘Grass and Meat’ and ANR grant (for the LIPIVIMUS project: ANR-06-PNRA-018).