



1 Introduction
Micro-air vehicles (MAVs) are small unmanned, autonomous or semi-autonomous flying vehicles whose development was made possible by the advent of micro-technologies. They have gathered tremendous interest these two past decades for very diverse applications, going from military operations to Mars exploration or atmospheric probing. Because they operate on the same scale as natural flyers, engineers have tried to take advantage of millions of years of evolution by developing concepts that mimic natural flyers. Flapping wing MAVs (e.g. Wood Reference Wood2008) are probably the most widespread example to date. More recently, attention was paid to the capability of birds to perform extreme manoeuvres (e.g. Provini et al. Reference Provini, Tobalske, Crandell and Abourachid2014, Polet & Rival Reference Polet and Rival2015) such as sharp turns or rapid stops. MAVs would highly benefit from such manoeuvrability skills, for instance in missions where short landings are required.
Short landings imply that the kinetic energy of the vehicle decreases rapidly to a value that preserves vehicle integrity. Some specific perching manoeuvres may be associated with an additional constraint that the change in altitude of the vehicle should not be negative or should remain limited. Perching manoeuvres of birds were analysed by Carruthers, Thomas & Taylor (Reference Carruthers, Thomas and Taylor2007), Berg & Biewener (Reference Berg and Biewener2010), Carruthers et al. (Reference Carruthers, Thomas, Walkers and Taylor2010), Provini et al. (Reference Provini, Tobalske, Crandell and Abourachid2014) and Polet & Rival (Reference Polet and Rival2015), revealing that strong deceleration, sometimes associated with a gain in altitude, could be achieved entirely through aerodynamic means. The results further suggested that the aerodynamic mechanisms in play were unsteady in nature, quasi-steady models being unable to predict the trajectory of the birds.
Strong deceleration resulting from large aerodynamic forces and associated unsteady aerodynamic phenomena can be obtained through a relatively simple motion of the wing that consists in a continuous pitch from
 $0^{\circ }$
to
 $90^{\circ }$
pitch angle. Polet, Rival & Weymouth (Reference Polet, Rival and Weymouth2015) investigated the aerodynamic phenomena occurring on a two-dimensional NACA0012 airfoil undergoing prescribed, combined pitch-up and decelerating motions. They showed that lift and drag coefficients increase super-linearly with pitch rate (or with shape change number) and that added mass effects and leading and trailing edge vortices are key features in the production of large forces. Again, large lift and drag forces exceed by far those predicted by quasi-steady models.
While a simple model based on prescribed motions can help reveal salient aerodynamic phenomena (Polet et al.
Reference Polet, Rival and Weymouth2015; Fernando & Rival Reference Fernando and Rival2017), it cannot reveal optimal perching manoeuvres which requires us to take into account the influence of the flow on the wing motion. To this end, we numerically reproduce experiments by Polet et al. (Reference Polet, Rival and Weymouth2015), leaving the translational motion of the airfoil free. That is, the airfoil undergoes a prescribed pitch motion while its horizontal and vertical displacements are responses to aerodynamic forces and the gravity field. In this study, the pitch-up axis location is fixed at
 $1/6$
chord away from the leading edge and the Reynolds number based on the initial airfoil velocity is set to 2000. We show that the minimum kinetic energy reached by the airfoil stochastically and asymptotically depends on the shape change number for shape change numbers below and above 1 respectively. Lowest kinetic energy levels are reached for large shape change numbers. However, because they are accompanied by severe gain in altitude, large shape change numbers are not optimal for short distance perching, i.e. where perching location is close to initial location. As such, it is demonstrated that shape change numbers in the range [0.1–1] (i.e. stochastic region) allow relatively short distance perching with a significant decrease in kinetic energy. Within this range, the time of pitching is of the same order as the convective time and the time of development of a strong leading edge vortex. Hence, the flow physics and dynamics of the airfoil are strongly coupled, leading to strong nonlinear fluid–structure interactions from which arise the stochastic dependence on shape change number. The leading edge vortex acts as an intense, suction region that produces large aerodynamic forces conducive to strong airfoil deceleration.
2 Methodology
2.1 Problem set-up
We consider a NACA0012 airfoil, with chord
 $c$
, subjected to three distinct phases of motion in the
 $xy$
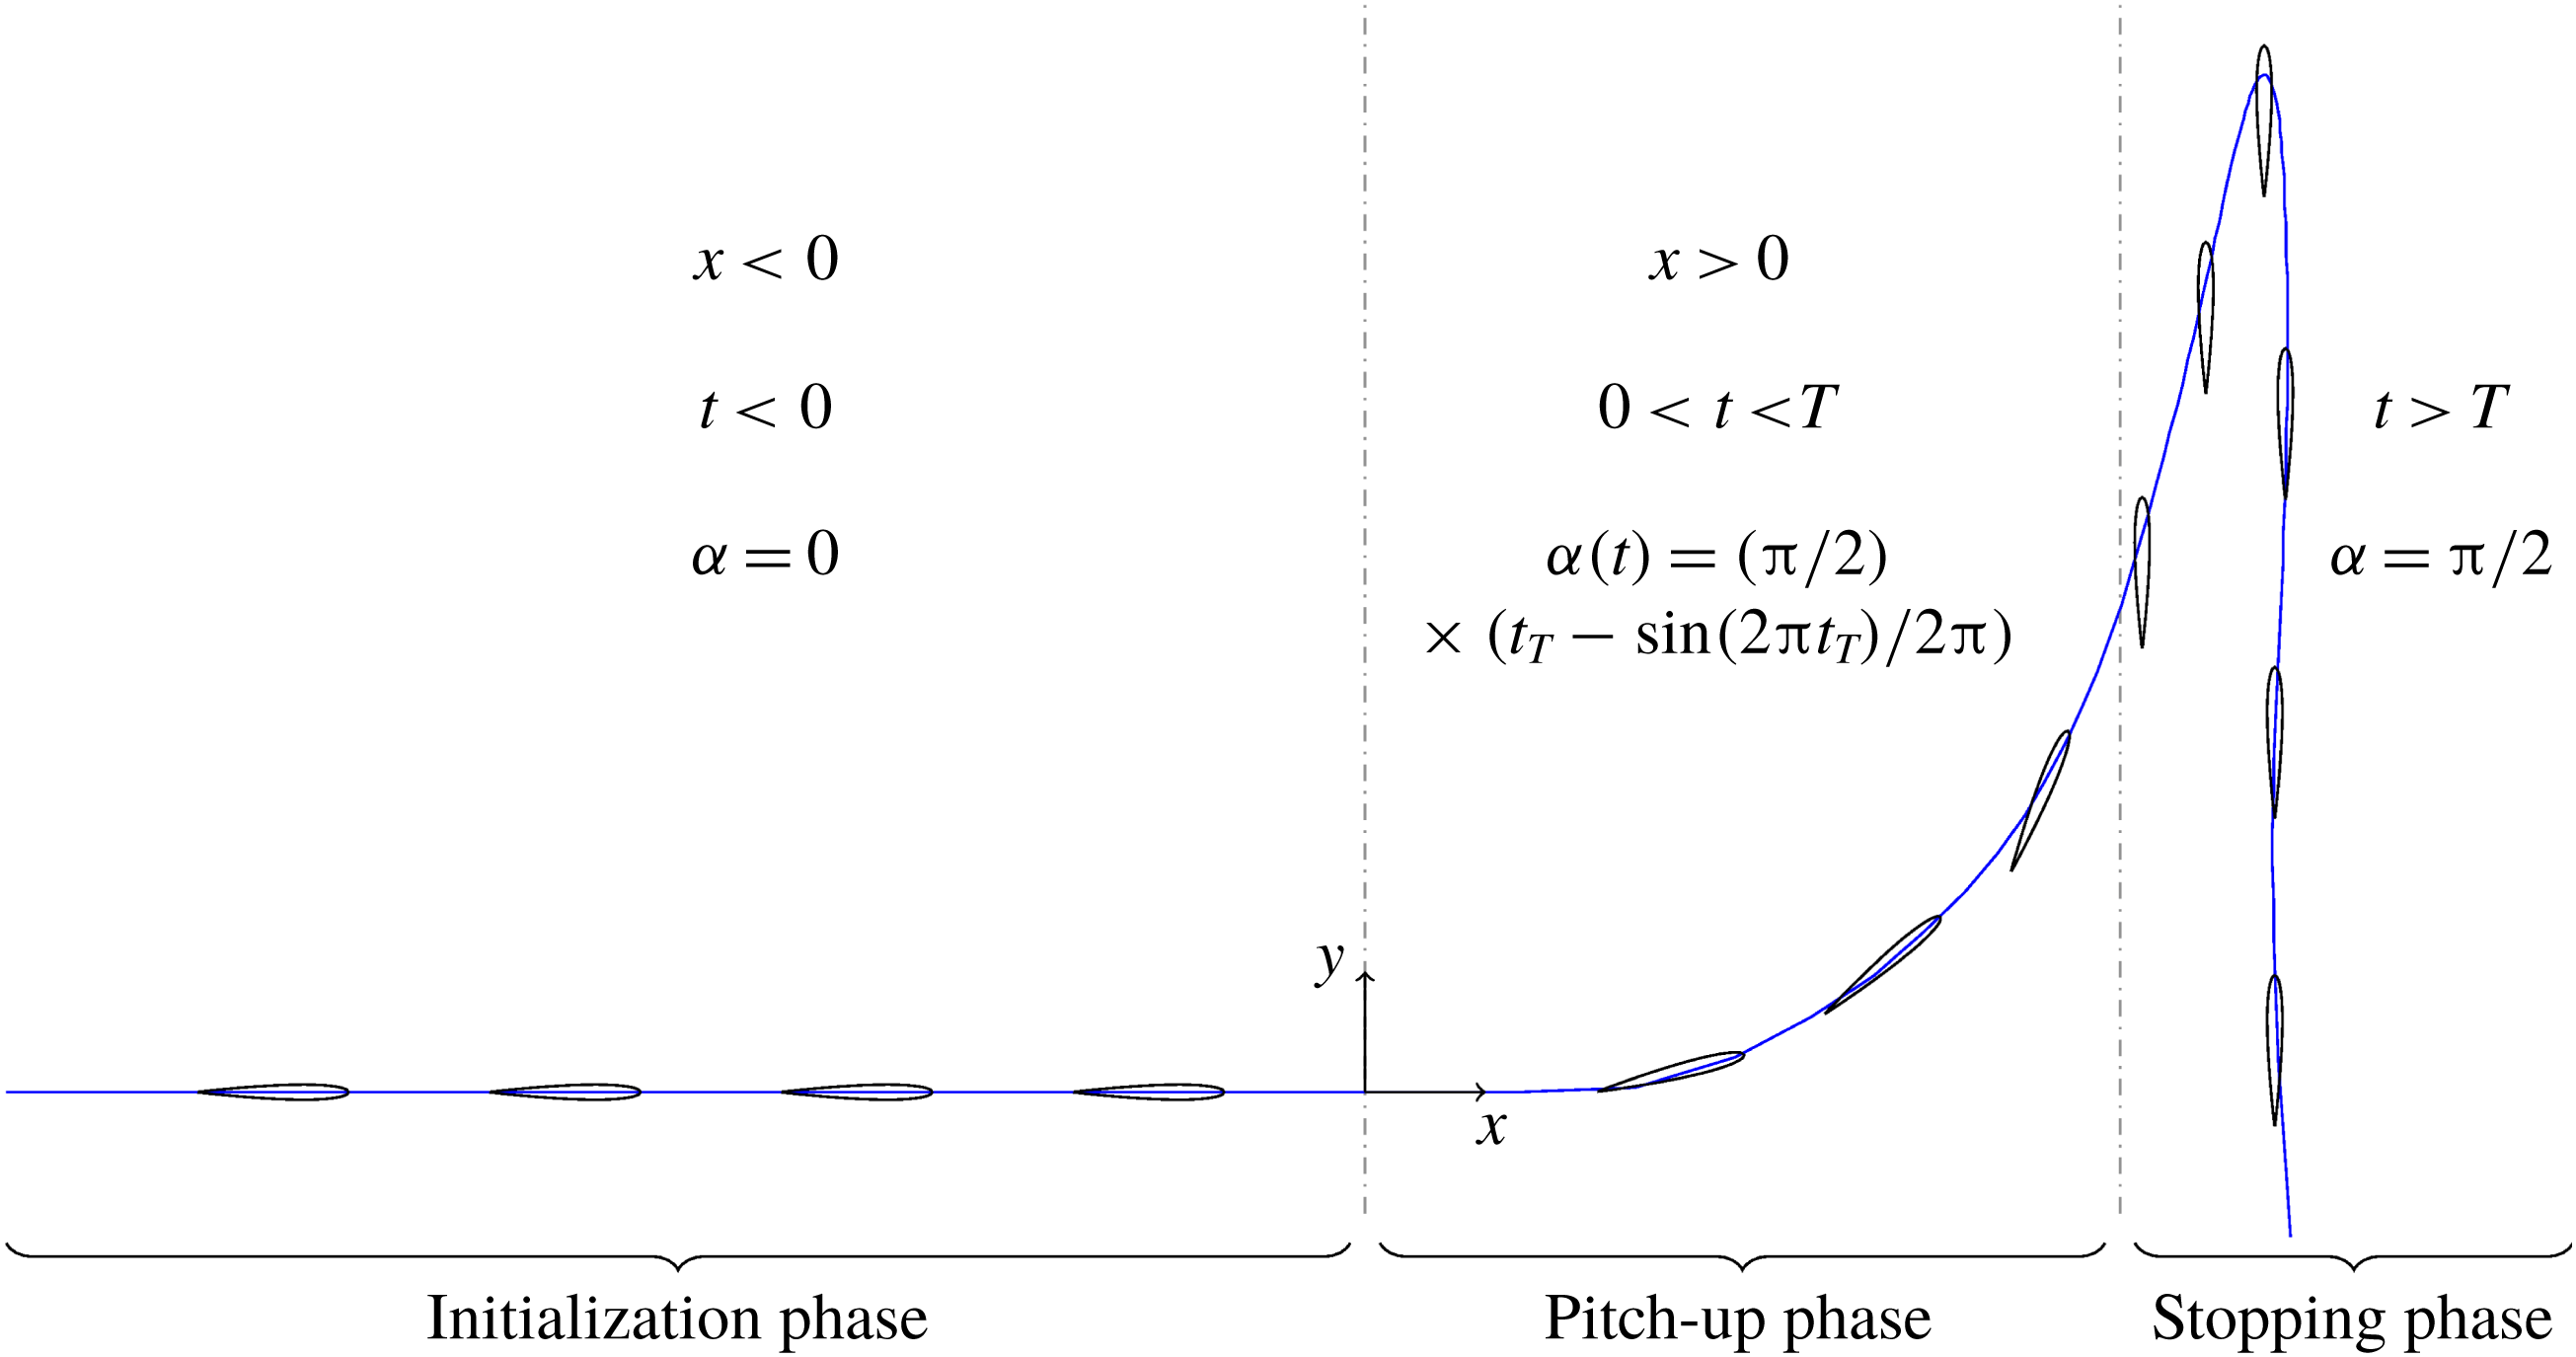
-plane (figure 1).
The first phase is the ‘initialization phase’. It consists in a 10 chord horizontal translation of the airfoil at altitude
 $y=0$
, zero pitch angle and velocity
 $U$
. This phase is prescribed to reach a quasi-steady flow field that is used as an initial condition for the subsequent phases. The ‘initialization phase’ occurs at negative times,
 $t<0$
(corresponding to negative abscissa,
 $x<0$
). The Reynolds number based on the wing chord
 $c$
and the initial translational velocity
 $U$
is
 $Re=cU/\unicode[STIX]{x1D708}=2000$
, where
 $\unicode[STIX]{x1D708}$
is the kinematic viscosity of the surrounding fluid.
The second phase is the ‘pitch-up phase’. The airfoil rotates about a spanwise axis located
 $1/6$
chord away from the leading edge. The pitch angle
 $\unicode[STIX]{x1D6FC}$
varies with time as:
 $$\begin{eqnarray}\displaystyle \unicode[STIX]{x1D6FC}(t)=\frac{\unicode[STIX]{x03C0}}{2}\left(t_{T}-\frac{\sin (2\unicode[STIX]{x03C0}t_{T})}{2\unicode[STIX]{x03C0}}\right), & & \displaystyle\end{eqnarray}$$
where
 $t_{T}=t/T$
,
 $T$
being the time of the pitch-up motion. To be consistent with Polet et al. (Reference Polet, Rival and Weymouth2015), we define the shape change number
 $\unicode[STIX]{x1D6EF}=c/TU$
, which helps measure the unsteadiness of the problem by comparing the pitch-up and convective time scales. During the pitch-up time
 $T$
, the airfoil rotates from 0 to
 $90^{\circ }$
pitch angle while freely translating in the vertical and horizontal directions, as a response to aerodynamic forces and the gravity field. The ‘pitch-up phase’ starts at time
 $t=0$
and ends at time
 $t=T$
.
The third phase is the ‘stopping phase’ where the pitch angle of the airfoil remains constant, i.e.
 $90^{\circ }$
, and where translational motions are free. The ‘stopping phase’ starts at time
 $t=T$
and has no specific ending.
The mass of the airfoil is concentrated at the centre of mass (CoM) and is such that the solid-to-fluid density ratio is
 $\unicode[STIX]{x1D70C}_{s}/\unicode[STIX]{x1D70C}_{f}=100$
. This is typical of fixed-wing MAVs, usually manufactured out of expanded polypropylene (EPP) foam (with a density of approximately
 $30~\text{kg}~\text{m}^{-3}$
) and a carbon structure, fully equipped with electronic devices, cables and batteries (e.g. Grasmeyer & Keennon (Reference Grasmeyer and Keennon2001)). The CoM is located at the rotation axis. Note however that because only translations are free (i.e. rotation is imposed), the results do not depend on the location of the CoM. In what follows, components of the position and velocity of the CoM in the
 $xy$
-plane will be denoted
 $(x,y)$
and
 $(u_{x},u_{y})$
respectively. Finally, the non-dimensional gravity
 $gc/U^{2}$
is equal to 0.01.
Note that the problem set-up is defined to be consistent with previous experiments and simulations by Polet et al. (Reference Polet, Rival and Weymouth2015) (i.e. cross-sectional geometry, Reynolds number and pitch-axis location), albeit with free translational motions.
Motion of the airfoil undergoing a perching manoeuvre.
2.2 Numerical approach
The resulting flow is computed by directly resolving the two-dimensional incompressible Navier–Stokes equations (2.2) and (2.3) on a cylindrical domain of diameter 60
 $c$
enclosing the airfoil,
 $$\begin{eqnarray}\displaystyle & \displaystyle \unicode[STIX]{x1D735}\boldsymbol{\cdot }\boldsymbol{v}=0, & \displaystyle\end{eqnarray}$$
 $$\begin{eqnarray}\displaystyle & \displaystyle \frac{\unicode[STIX]{x2202}\boldsymbol{v}}{\unicode[STIX]{x2202}t}+(\boldsymbol{v}-\boldsymbol{u})\boldsymbol{\cdot }\unicode[STIX]{x1D735}\boldsymbol{v}=-\frac{1}{\unicode[STIX]{x1D70C}_{f}}\unicode[STIX]{x1D735}p+\unicode[STIX]{x1D708}\unicode[STIX]{x1D6FB}^{2}\boldsymbol{v}, & \displaystyle\end{eqnarray}$$
where
 $\boldsymbol{v}$
,
 $\boldsymbol{u}$
,
 $p$
and
 $\unicode[STIX]{x1D708}$
are the fluid velocity, domain velocity, pressure and kinematic viscosity, respectively.
The StarCMM+ v11.02 commercial code is used, which employs a cell-centred finite volume method to solve the momentum and continuity equations in an uncoupled way, using a predictor–corrector approach. Specifically, a colocated variable arrangement and a Rhie–Chow-type pressure–velocity coupling combined with a SIMPLE-type algorithm are used. A conjugate-gradient method that uses an algebraic multi-grid (AMG) solver as preconditioner is used to accelerate the iterative process for pressure correction. Gradients are computed using the hybrid Gauss–least squares method associated with the Venkatakrishnan limiter. Second-order schemes are employed for both spatial (upwind) and temporal discretizations. The numerical method is further detailed in the works by Muzaferija (Reference Muzaferija1994) and Demirdžić & Muzaferija (Reference Demirdžić and Muzaferija1995).
The far-field boundary condition is treated as a Dirichlet pressure condition and the wing is modelled as a no-slip surface. Velocities on the wing surface are derived from the prescribed pitch-up velocity and the equations of motion (2.4), taking into account aerodynamic forces and the gravity field. Recall that only the horizontal and vertical displacements
 $x$
and
 $y$
are derived from the equations of motion, i.e. depending on the phase, the airfoil can be free to translate but the pitch angle is always imposed. At each time step, aerodynamic forces
 $F$
obtained by solving (2.2) and (2.3) and the gravitational force
 $mg$
are used in (2.4) to update the acceleration of the airfoil (with mass
 $m$
), which is then integrated with time step
 $\unicode[STIX]{x0394}t$
to obtain the velocity of the CoM,
 $u=(u_{x},u_{y})$
and its position
 $(x,y)$
at the next time step. The whole computational domain is moved accordingly.
 $$\begin{eqnarray}\displaystyle \boldsymbol{F}+m\boldsymbol{g}=m\frac{\unicode[STIX]{x2202}\boldsymbol{u}}{\unicode[STIX]{x2202}t}. & & \displaystyle\end{eqnarray}$$
An O-type structured grid is used which consists of
 $10^{5}$
cells, with a typical grid spacing of
 $\unicode[STIX]{x0394}s=0.005c$
in the vicinity of the wing. The time step is fixed to
 $\unicode[STIX]{x0394}t=T/360$
, which ensures that the Courant number is approximately equal for all cases and is of the order of 2.
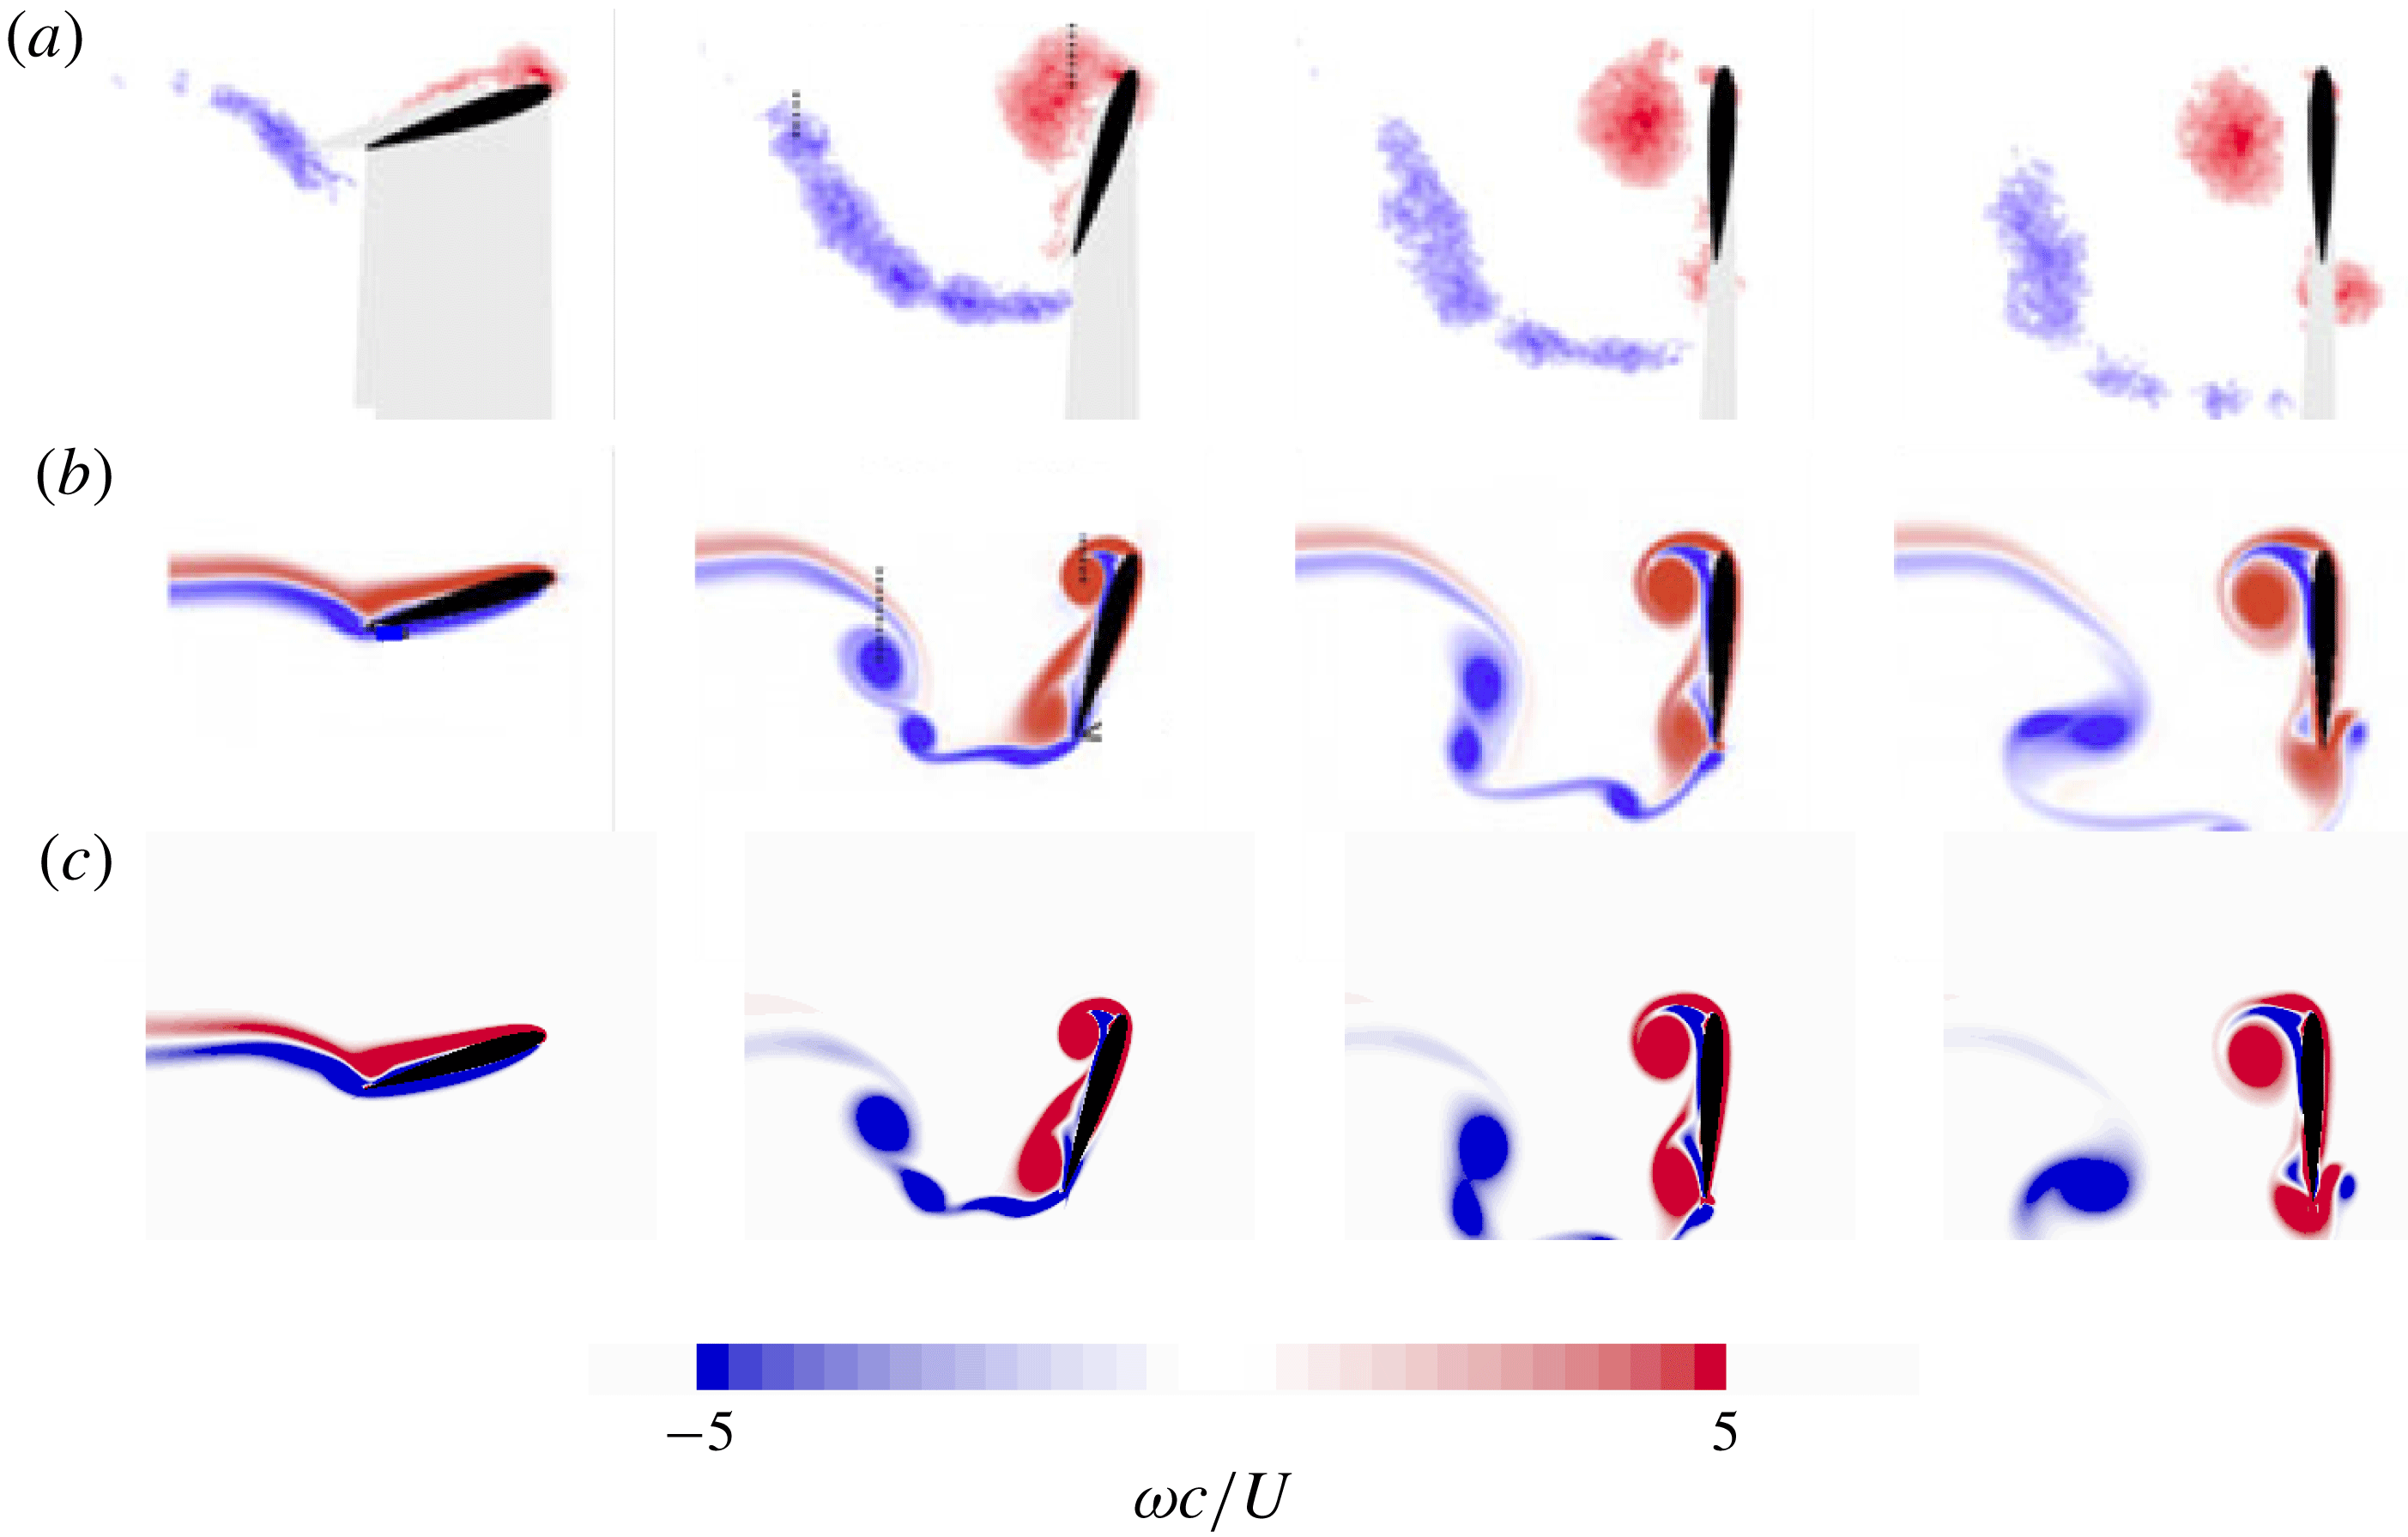
The numerical approach is validated on the Polet et al. (Reference Polet, Rival and Weymouth2015) results, where a NACA0012 airfoil undergoes prescribed (combined) pitch-up and decelerating motions. Figure 2 compares the flow fields obtained from the present approach with those obtained numerically and experimentally by Polet et al. (Reference Polet, Rival and Weymouth2015), for
 $\unicode[STIX]{x1D6EF}=1/4$
. Note that experimental and numerical data from Polet et al. (Reference Polet, Rival and Weymouth2015) are obtained at
 $Re=22\,000$
and
 $Re=2000$
, respectively. Overall, reasonable agreement is observed both in the position and intensity of the leading and trailing edge vortices that develop in the wake of the airfoil.
Furthermore, mean lift and drag coefficients for additional cases are compared and plotted in figures 3(a) and 3(b), respectively. Time averaging is performed over the pitching time
 $T$
and coefficients are obtained as defined in 2.3. Here again, reasonable agreement is observed between the present results and those from Polet et al. (Reference Polet, Rival and Weymouth2015).
Finally, figure 3(c) shows the dependence of the results shown in figure 2 (
 $\unicode[STIX]{x1D6EF}=0.25$
) to the typical grid spacing
 $\unicode[STIX]{x0394}s$
. It is shown that the results are converged with respect to spatial resolution for
 $\unicode[STIX]{x0394}s\approx 0.005c$
. Drag and lift coefficients obtained for this grid spacing are less than 0.4 % and 0.1 % away from the Richardson extrapolated solution. This is in line with past numerical studies of two- and three-dimensional flows in this range of Reynolds number (e.g. Moriche, Flores & Garcia-Villalba (Reference Moriche, Flores and Garcia-Villalba2017), Jardin & Colonius (Reference Jardin and Colonius2018)). Convergence is also verified on the largest pitch rate addressed in the present work, i.e.
 $\unicode[STIX]{x1D6EF}=4$
, which further includes data obtained with increased spatial resolution
 $\unicode[STIX]{x0394}s=0.00125c$
.
Further comparisons with data obtained by Eldredge & Wang (Reference Eldredge and Wang2010) and Kurtulus (Reference Kurtulus2015) for static and pitching airfoils are provided in appendix A.
Vorticity flow fields obtained for
 $\unicode[STIX]{x1D6EF}=1/4$
from particle image velocimetry (a–d) and direct numerical simulation (DNS) (e–h) by Polet et al. (Reference Polet, Rival and Weymouth2015) and from present DNS (i–l) at
 $2/6$
th,
 $4/6$
th,
 $5/6$
th and
 $6/6$
th (from left to right) of the pitching time.
Time averaged lift (a) and drag (b) coefficients obtained for different values of
 $\unicode[STIX]{x1D6EF}$
from experiments and DNS by Polet et al. (Reference Polet, Rival and Weymouth2015) and from present DNS. Time averaged lift coefficients obtained for
 $\unicode[STIX]{x1D6EF}=0.25$
and 4 with different space resolutions from present DNS (c).

2.3 Data reduction
In what follows, and unless otherwise specified, all data are non-dimensionalized with respect to the wing chord
 $c$
and initial translational velocity
 $U$
. Aerodynamic coefficients
 $C_{i}$
are defined as
 $2F_{i}/\unicode[STIX]{x1D70C}_{f}cU^{2}$
where
 $\unicode[STIX]{x1D70C}_{f}$
is the fluid density and
 $F_{i}$
the corresponding aerodynamic force.
3 Results
3.1 Dynamics of perching manoeuvres
We first analyse the dynamics of perching manoeuvres for three configurations characterized by shape change numbers 0.25, 0.5 and 1.
Figures 4(a) and 4(b) show the corresponding instantaneous horizontal (
 $-C_{x}$
) and vertical (
 $C_{y}$
) force coefficients as a function of the non-dimensional time
 $t_{T}$
. The time signals can be separated into two regions according to whether they are dominated by the pitch-up motion (
 $t_{T}<1$
) or by the free translating motion (
 $t_{T}>1$
).
Horizontal (a) and vertical (b) force coefficients as a function of the non-dimensional time
 $t_{T}$
for three values of shape change number
 $\unicode[STIX]{x1D6EF}=1$
, 0.5 and 0.25. The inset in (b) displays the pitch-up velocity during pitch-up time.

When
 $t_{T}<1$
, the aerodynamic forces can be clearly correlated with the pitch-up motion of the airfoil with a peak occurring near the maximum pitch velocity at
 $t_{T}=0.5$
and an amplitude increasing with pitch rate. Decomposition of
 $-C_{x}$
and
 $C_{y}$
in appendix B shows that forces are dominated by their pressure contributions, which are order of magnitudes larger than the viscous contributions. In accordance with the results by Polet et al. (Reference Polet, Rival and Weymouth2015), the maximum instantaneous horizontal and vertical force coefficients increase super-linearly with pitch rate and largely exceed quasi-steady values. Polet et al. (Reference Polet, Rival and Weymouth2015) showed that such large aerodynamic forces result from both strong added mass effects and large circulatory forces (i.e. vorticity production at the leading and trailing edges). Estimation of the normal force coefficient induced by added mass effects
 $C_{N}^{AM}$
on a rotating and accelerating flat plate can be obtained with the following equation (Polet et al.
Reference Polet, Rival and Weymouth2015):
 $$\begin{eqnarray}\displaystyle \boldsymbol{C}_{\boldsymbol{N}}^{\boldsymbol{A}\boldsymbol{M}}=\frac{\unicode[STIX]{x03C0}c}{2U^{2}}\left[\frac{\unicode[STIX]{x2202}\unicode[STIX]{x1D6FC}^{\prime }}{\unicode[STIX]{x2202}t}\cos (\unicode[STIX]{x1D6FC}^{\prime })\boldsymbol{u}+\sin (\unicode[STIX]{x1D6FC}^{\prime })\frac{\unicode[STIX]{x2202}\boldsymbol{u}}{\unicode[STIX]{x2202}t}+c\frac{\unicode[STIX]{x2202}^{2}\unicode[STIX]{x1D6FC}^{\prime }}{\unicode[STIX]{x2202}t^{2}}(1/2-x_{p}/c)\right], & & \displaystyle\end{eqnarray}$$
where
 $\unicode[STIX]{x1D6FC}^{\prime }$
is the airfoil angle of attack (also see § 3.2.2) and
 $\boldsymbol{u}$
its velocity;
 $x_{p}$
is the location of the pitching axis and is here equal to
 $c/6$
. Furthermore, previous studies on translational pitching, massively separated airfoils demonstrated that circulatory and non-circulatory forces can be superimposed linearly (e.g. Granlund, Ol & Bernal (Reference Granlund, Ol and Bernal2013)), which is in line with previous theories on force decomposition (e.g. Chang (Reference Chang1992)). Estimation of the normal force coefficient induced by circulatory forces
 $C_{N}^{C}$
can thus be expressed as
 $C_{N}^{C}=C_{N}-C_{N}^{AM}$
, where
 $C_{N}$
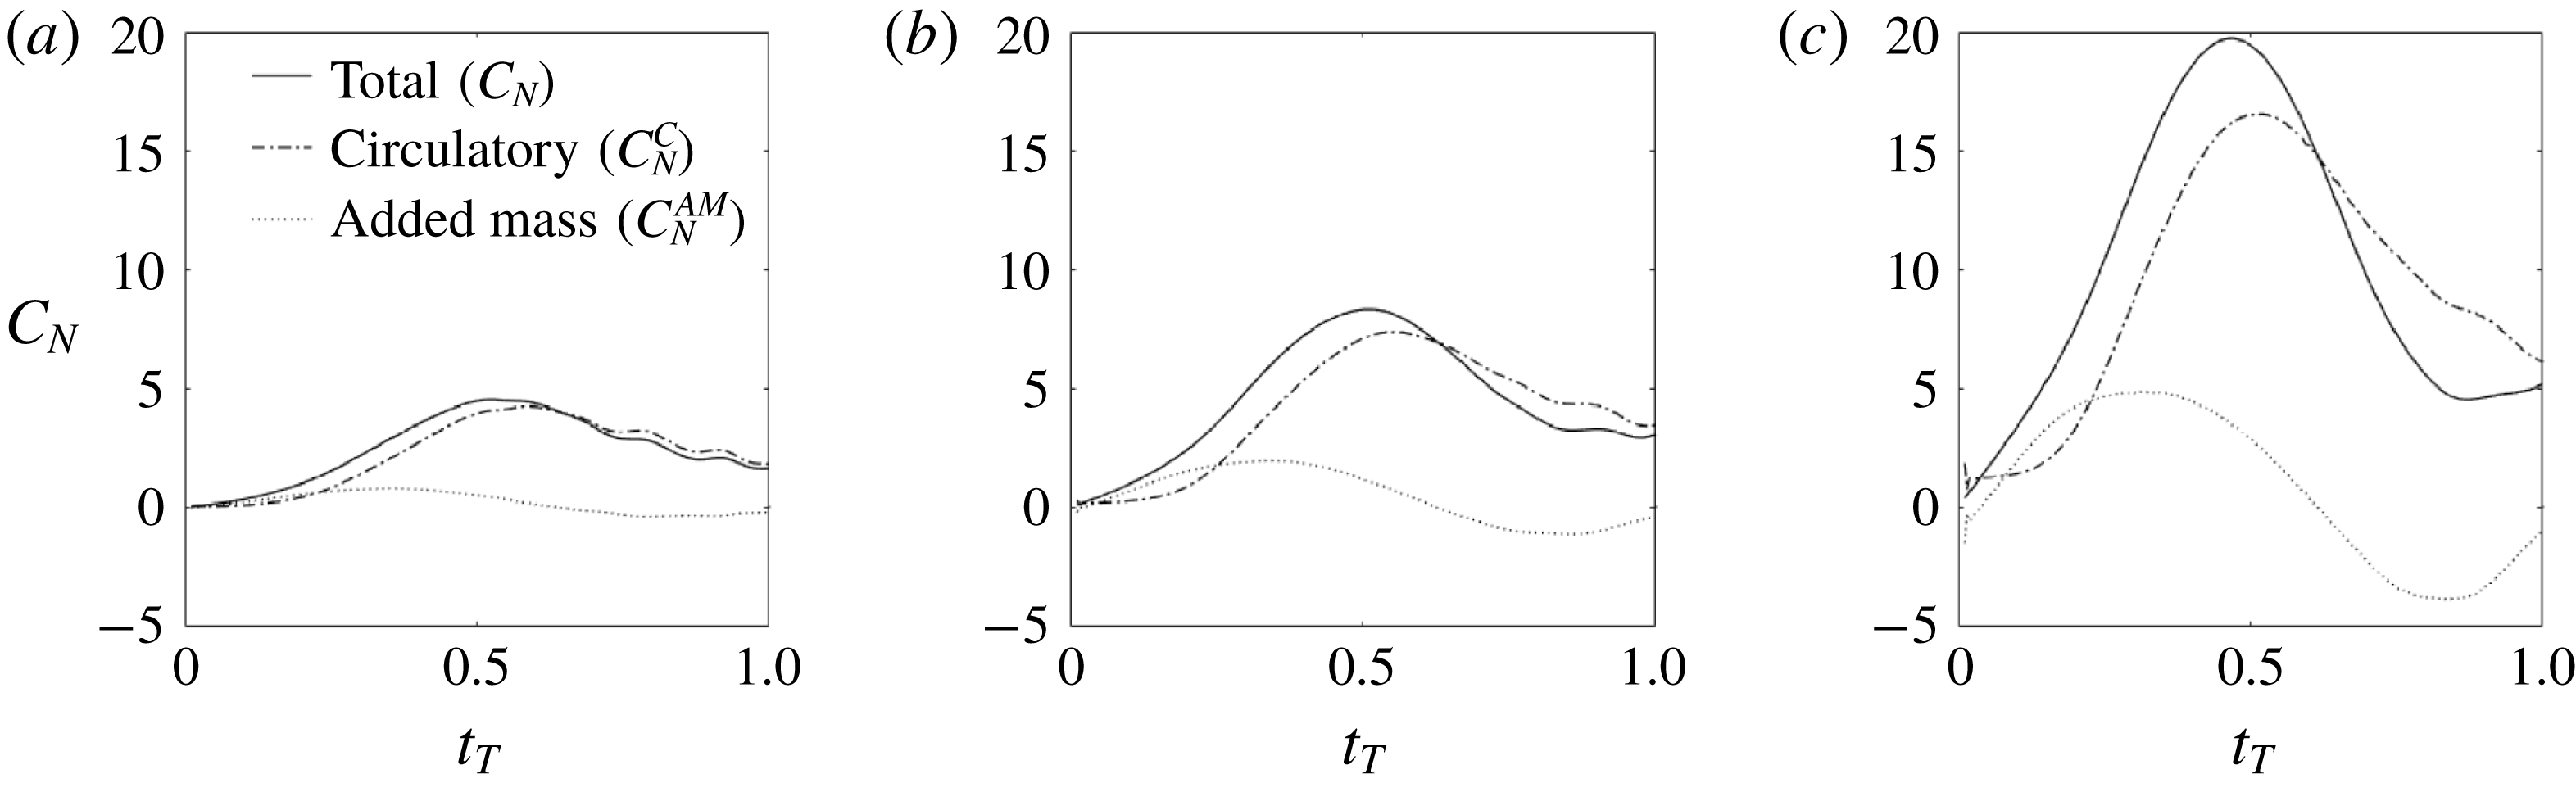
is the total force acting normal to the airfoil. Figure 5 depicts the contributions of added mass and circulatory forces to the normal force
 $C_{N}$
. It is shown that both added mass and circulatory forces increase with shape change number, resulting in the severe increase of both horizontal and vertical forces. Although not shown here for the sake of conciseness, the added mass contribution is increasingly dominated by angular acceleration (third term on the right-hand side of (3.1) as
 $\unicode[STIX]{x1D6EF}$
increases, explaining its almost zero-mean sinusoidal shape. Conversely, the influence of translational acceleration (second term on the right-hand side of (3.1) is relatively small. The balance between circulatory and non-circulatory forces is in qualitative agreement with that obtained for comparable configurations (e.g. Polet et al.
Reference Polet, Rival and Weymouth2015, Moriche et al.
Reference Moriche, Flores and Garcia-Villalba2017).
Contributions of added mass and circulatory forces to total normal force as a function of the non-dimensional time
 $t_{T}$
for three values of shape change number
 $\unicode[STIX]{x1D6EF}=0.25$
(a), 0.5 (b) and 1 (c).
Beyond
 $t_{T}=1$
, the
 $-C_{x}$
and
 $C_{y}$
time signals in figure 4 exhibit chaotic behaviour that contrasts with the previous sine-shaped signals at
 $t_{T}<1$
. These chaotic signals suggest the presence of highly nonlinear flow dynamics and the resulting response of the wing, in terms of translational motion, to nonlinear fluid–structure interactions. Both horizontal and vertical force signals then tend to zero as
 $t_{T}$
increases. (Note that the vertical force will asymptotically tend towards an equilibrium negative value that balances the gravity force for times much larger than those reported in figure 4.)
Horizontal (a) and vertical (b) airfoil velocities as a function of the non-dimensional time
 $t_{T}$
for three values of shape change number
 $\unicode[STIX]{x1D6EF}=1$
, 0.5 and 0.25.
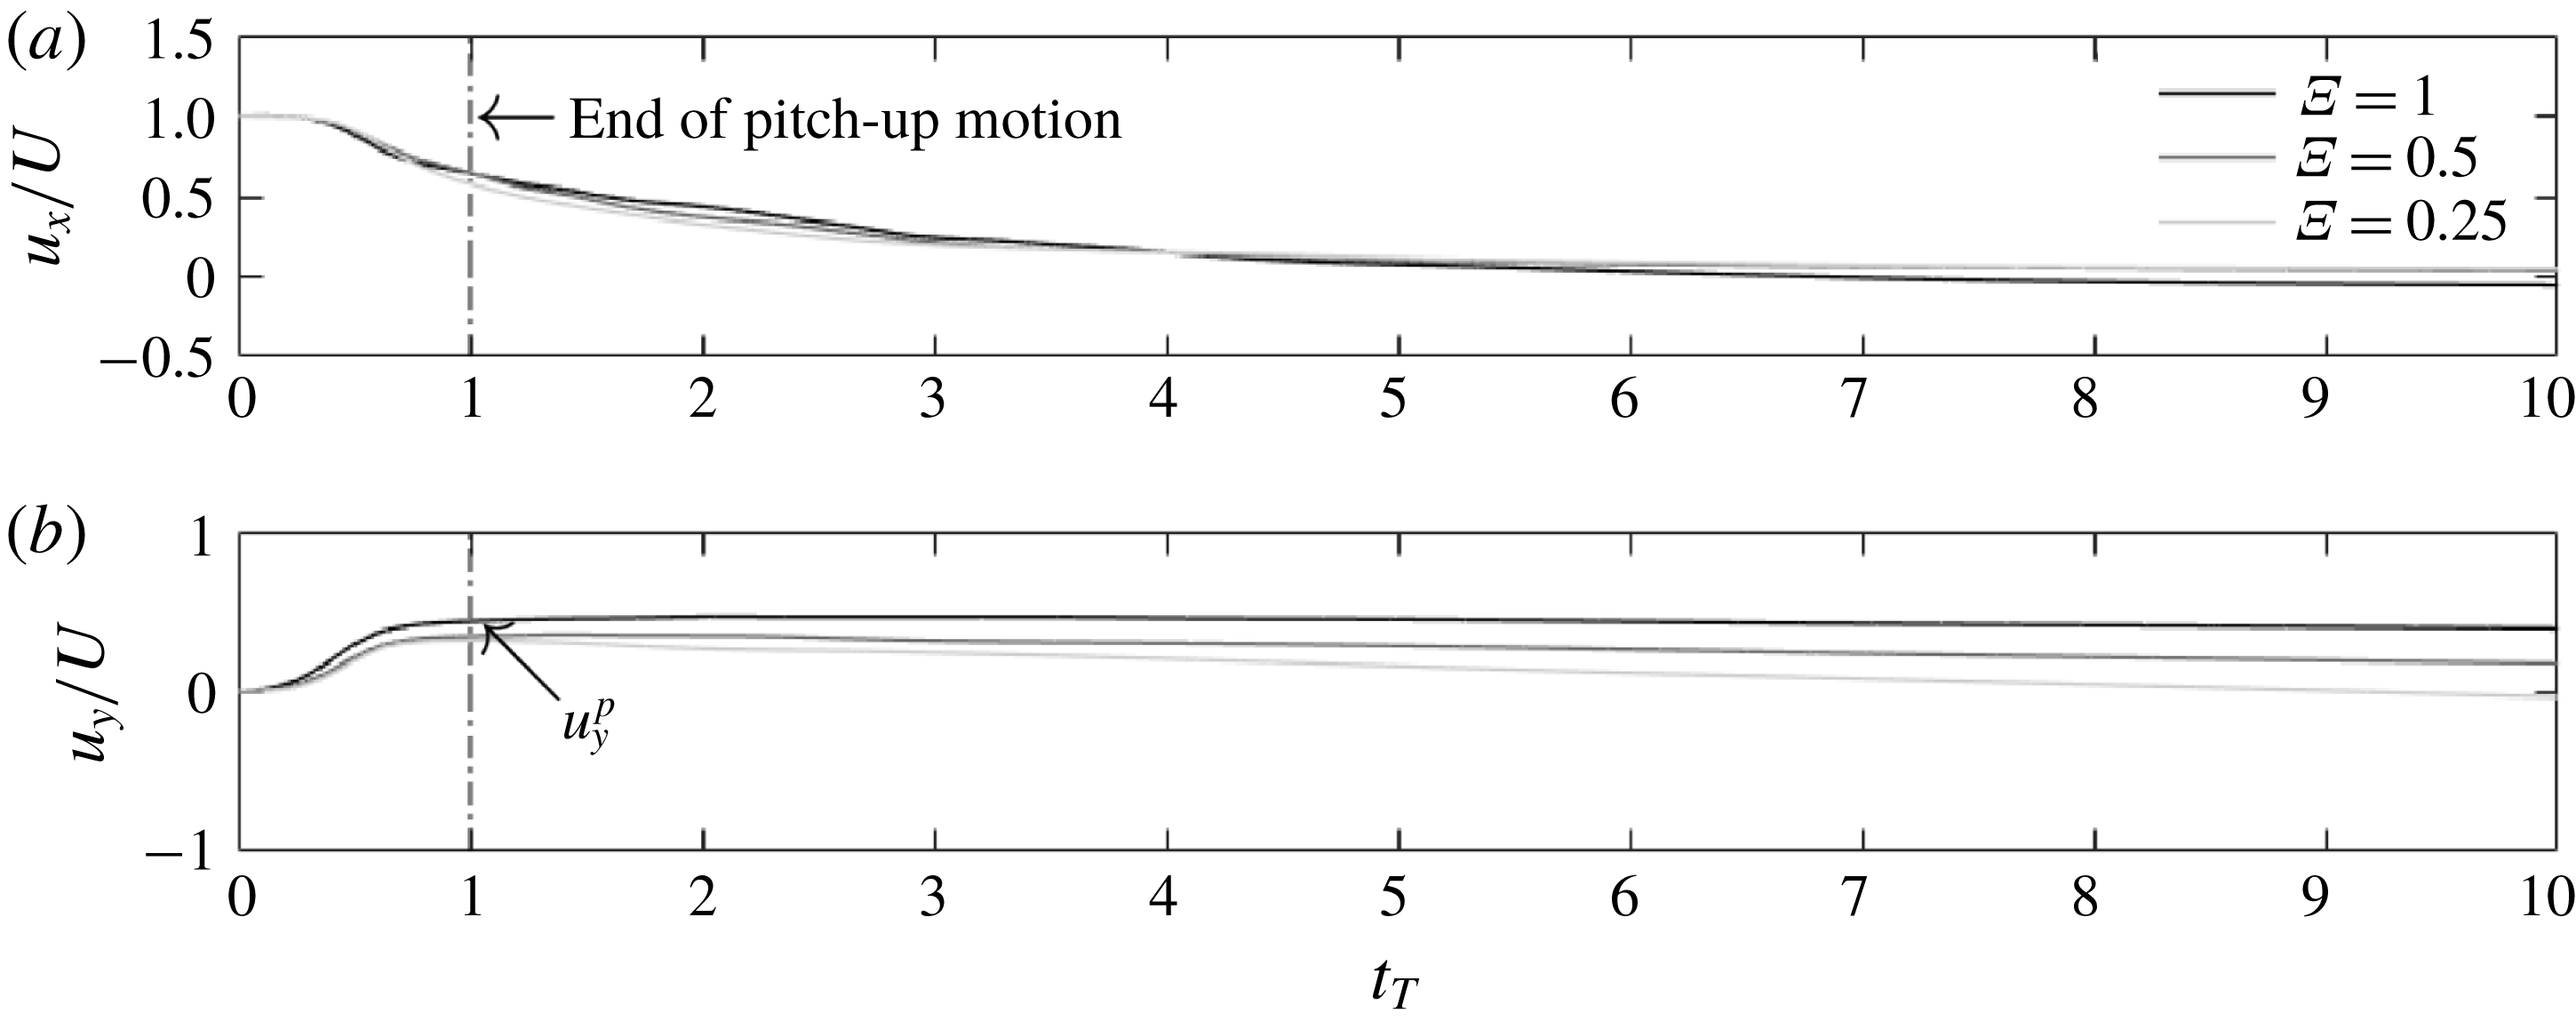
As a result of the strong aerodynamic forces during the pitch-up phase, the airfoil strongly decelerates in the horizontal direction and accelerates in the vertical direction (figures 6
a and 6
b). Horizontal velocity curves in figure 6(a) exhibit a very similar trend for all three
 $\unicode[STIX]{x1D6EF}$
cases, indicating that the horizontal deceleration scales with the pitch-up time
 $T$
. It is interesting to note that
 $u_{x}$
is still more than half of the initial airfoil speed at the end of the pitch-up motion, suggesting that simplified kinematics, where both the prescribed pitch-up and decelerating motions end at the same time, may not be fully representative of a real perching manoeuvre (where deceleration is induced by the pitch-up motion). All vertical velocity curves also show comparable trends during the pitch-up phase, when
 $t_{T}<1$
. However, despite this initial resemblance, two main differences are observed. First, it is shown that the maximum vertical velocity reached at the end of the pitch-up motion is not equal for all cases, i.e. it increases with the pitch rate. Second, while
 $u_{y}$
increases in relatively similar ways for
 $t_{T}<1$
(although towards different maximum values), it decreases in a different manner as
 $t_{T}$
increases beyond 1. As such, while the pitch-up time seems to be the relevant time scale for the vertical velocity when
 $t_{T}<1$
, it is not when
 $t_{T}$
increases beyond 1. As
 $t$
increases and the aerodynamic forces decrease together with the magnitude of
 $u_{x}$
and
 $u_{y}$
, gravity becomes the dominant force and therefore the dynamics of the system is driven by the time scale
 $U/g$
, rather than by
 $T$
.
The resulting trajectories in the
 $xy$
-plane are depicted in figure 7. It can be seen that in all cases a significant gain in altitude is obtained due to the generation of large vertical aerodynamic force. This gain in altitude increases with pitch rate, hence with vertical force, and reaches more than 11 chord lengths in the
 $\unicode[STIX]{x1D6EF}=1$
case. Square markers are added to each curve to represent the airfoil position at
 $t=U/2g$
. It can be observed that maximum gains in altitude occur around a gravitational time of
 $t_{g}=tg/U=1/2$
. In other words, this shows here again that the time at which the maximum
 $y$
value is reached scales with the gravitational time rather than the pitch-up time. Nevertheless, a dependence between the time at which the maximum
 $y$
value is reached and the pitch-up time exists. The pitch-up time drives the vertical force during the pitch-up motion and, subsequently, the vertical velocity at the end of the pitch-up motion,
 $u_{y}^{p}$
. After the pitch-up motion, the gravitational force becomes dominant for these shape change numbers. The pitch-up time to gravitational time ratio is equal to
 $Tg/U=cg/\unicode[STIX]{x1D6EF}U^{2}\ll 1$
, for sufficiently large values of
 $\unicode[STIX]{x1D6EF}$
and with
 $gc/U^{2}=0.01$
(as defined in § 2.1). That is, the pitch-up time is significantly smaller than the gravitational time. Consequently, airfoil deceleration to
 $u_{x}\approx 0$
(which scales with pitch-up time) can be considered fast with respect to the gravitational time scale, such that
 $u_{x}$
can be considered weak during most of the stopping phase. Furthermore, the pitch angle is
 $90^{\circ }$
. These two features do not favour upward vertical force production. Hence,
 $C_{y}$
is low (which can be verified in figure 4) and upward vertical aerodynamic force can be considered negligible with respect to gravitational force. Neglecting
 $F_{y}$
and integrating Newton’s equation gives
 $u_{y}=u_{y}^{p}-g(t-T)$
. At maximum gain in altitude
 $y_{max}$
,
 $u_{y}=0$
and
 $t=u_{y}^{p}/g+T$
. Again,
 $T$
can be neglected since
 $Tg/u_{y}^{p}\sim cg/\unicode[STIX]{x1D6EF}U^{2}\ll 1$
. It can be seen in figure 6(b) that
 $u_{y}^{p}/U$
is close to
 $1/2$
, which corresponds to a gravitational time of
 $1/2$
, as discussed earlier, i.e.
 $t\approx U/2g$
. The precise value of
 $u_{y}^{p}$
gives
 $t_{g}$
at
 $y_{max}$
equal to 0.44, 0.35 and 0.32, hence
 $y_{max}/c=9.37$
, 5.96 and 5.06 for cases
 $\unicode[STIX]{x1D6EF}=1$
, 0.5 and 0.25. This is not far from the
 $y_{max}$
values directly obtained from simulations (
 $y_{max}/c=11.43$
, 6.73 and 5.75 respectively). At this point, the dynamics of the perching manoeuvre along the
 $y$
-axis can thus be described as a rather simple problem where the shape change number drives the vertical velocity at the end of the pitch-up time, which then acts as an initial condition for the motion of a body solely submitted to the gravitational force.
Airfoil trajectories in the
 $xy$
-plane for three values of shape change number
 $\unicode[STIX]{x1D6EF}=1$
, 0.5 and 0.25.
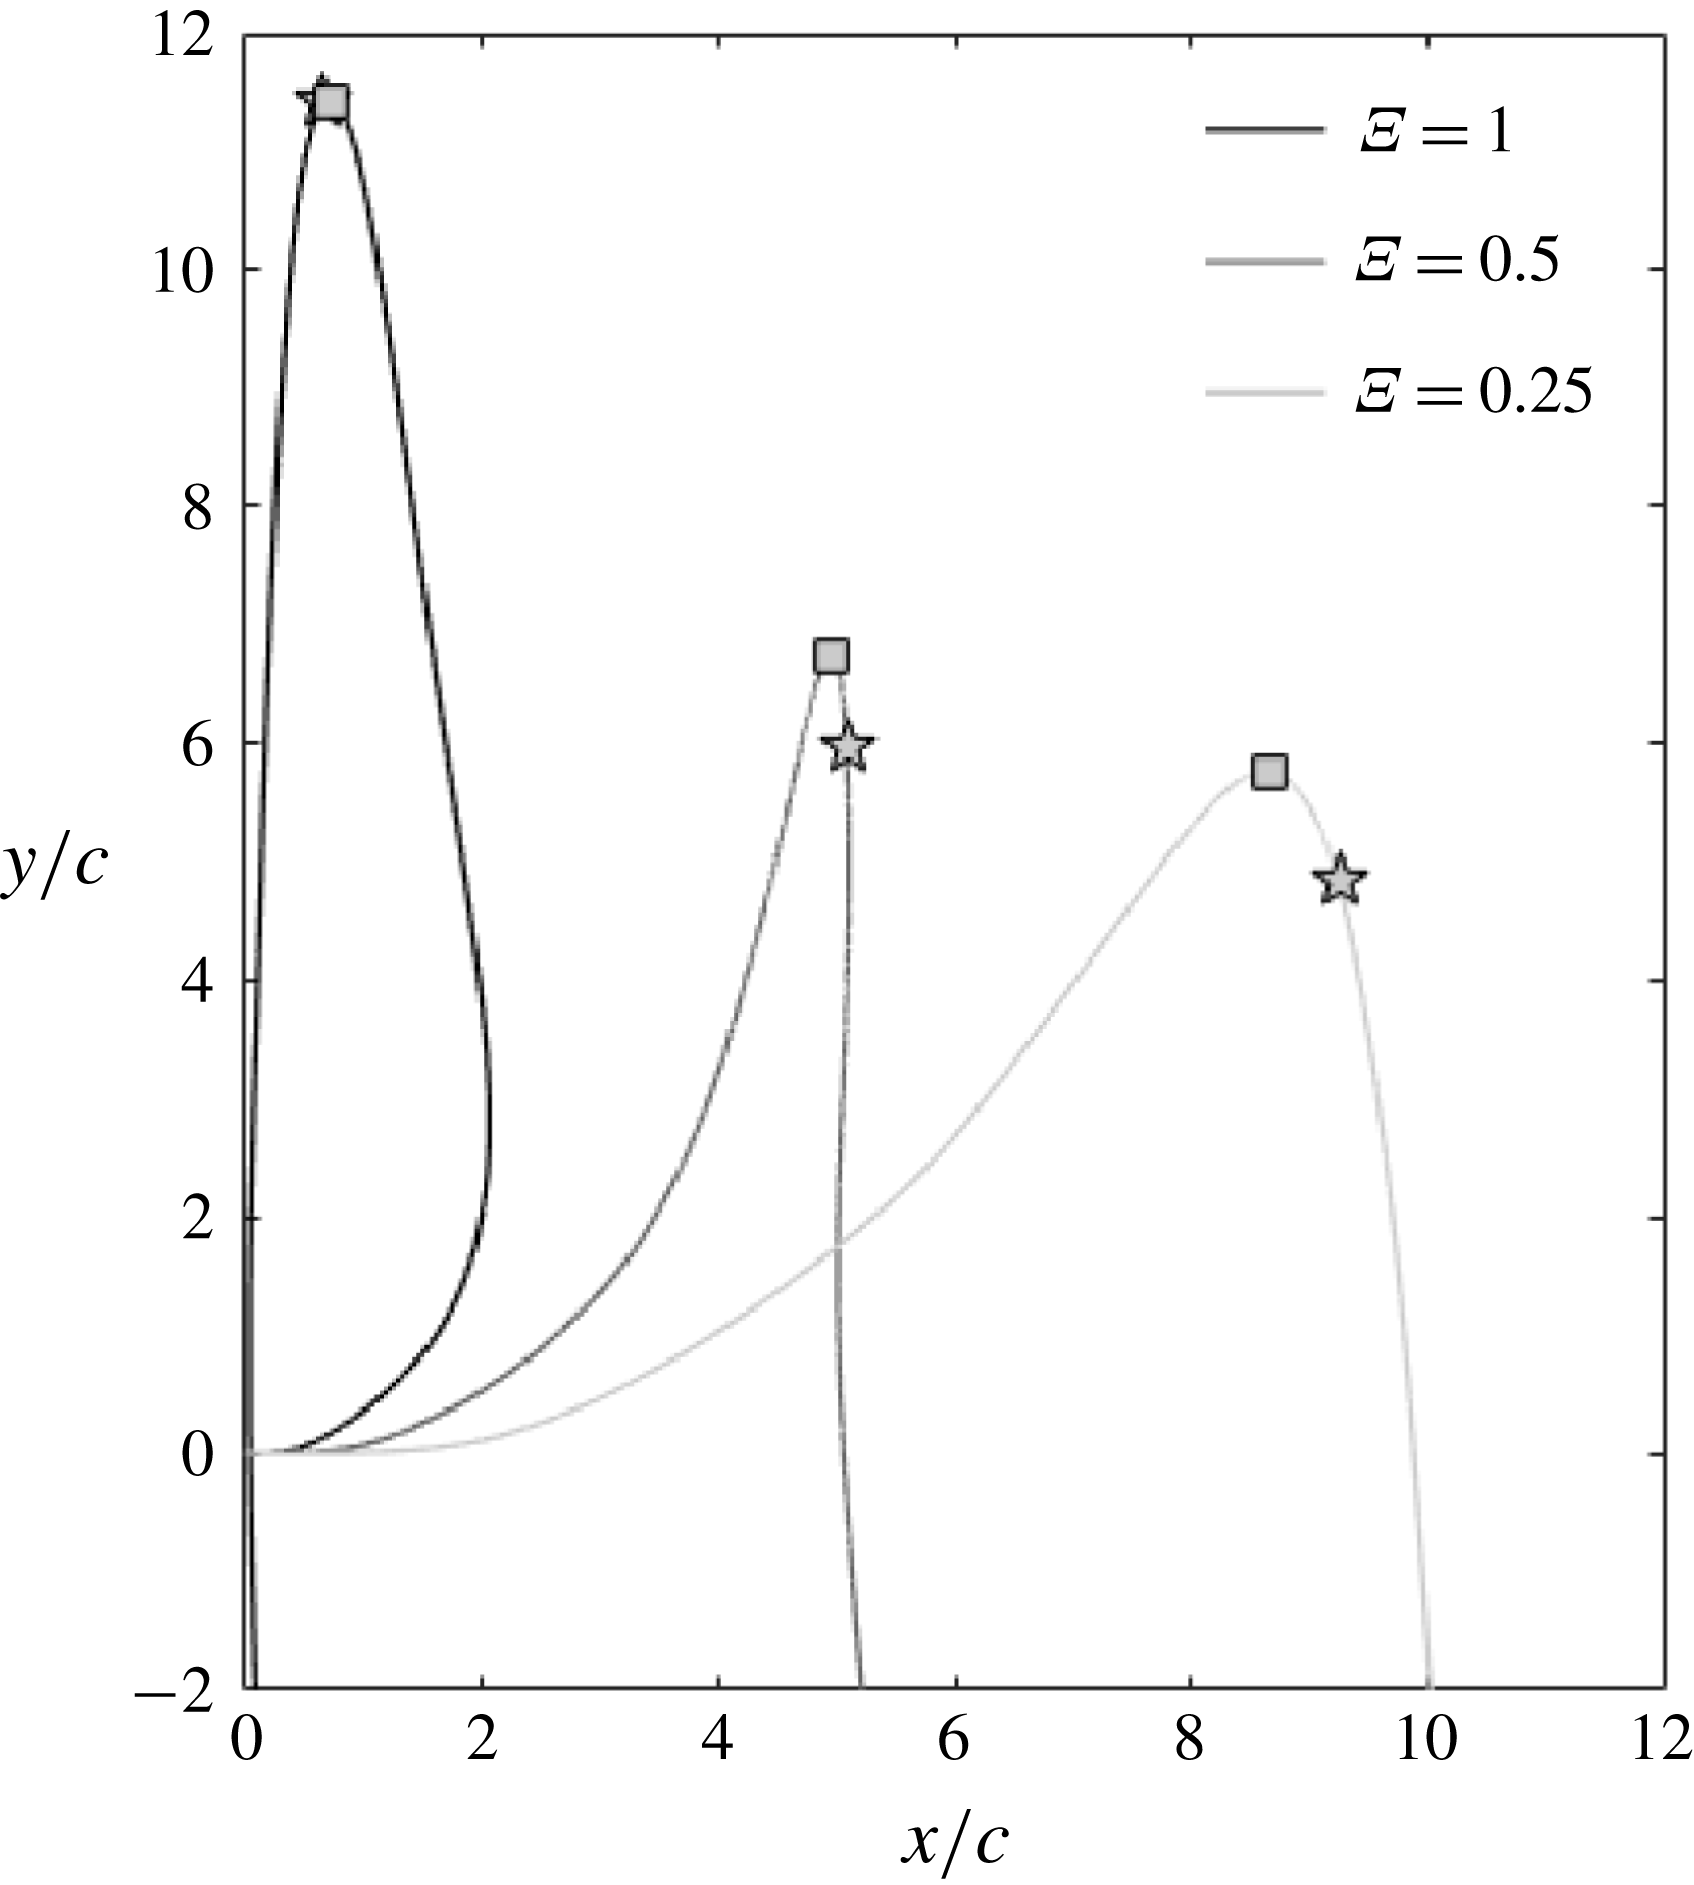
Interestingly, it can be seen from figure 6(b) that the vertical velocity reaches zero (maximum gain in altitude) well after the horizontal velocity reaches negligible values. As such, because both horizontal and vertical velocities should be weak to get low kinetic energy, the lowest levels of kinetic energy (marked with a star symbol in figure 7) are reached at the maximum gain in altitude. After maximum altitude is reached, the vertical velocity becomes negative while the horizontal velocity remains negligible and the trajectory tends toward that of a free falling body. The altitude decreases and kinetic energy has increased again when the airfoil crosses the
 $y=0$
axis, i.e. when it reaches its initial vertical position.
Finally, it is shown that the horizontal displacement at maximum vertical displacement (
 $y=y_{max}$
, i.e. around minimum kinetic energy) or, alternatively, at zero vertical displacement (
 $y=0$
), increases as the shape change number
 $\unicode[STIX]{x1D6EF}$
decreases and can reach very small values for large shape change numbers. What is more, the airfoil can undergo a backward motion for sufficiently large shape change numbers.
3.2 Flow fields
In order to gain further insight into the unsteady dynamics presented above, instantaneous flow fields are analysed for the three configurations with shape change number
 $\unicode[STIX]{x1D6EF}=0.25$
, 0.5 and 1.
3.2.1 Pitch-up phase
We first look at the instantaneous vorticity fields obtained at times
 $t_{T}=0.25,0.5,0.75$
and 1 displayed in figure 8. Vorticity
 $\unicode[STIX]{x1D714}$
is non-dimensionalized using the airfoil chord and initial translation speed,
 $\unicode[STIX]{x1D714}c/U$
, where
 $\unicode[STIX]{x1D74E}=\unicode[STIX]{x1D735}\times \boldsymbol{v}$
. Recall that at
 $t_{T}=0$
, the airfoil has translated 10 chords at
 $0^{\circ }$
pitch angle. The flow field at
 $t_{T}=0.25$
is therefore characterized by two thick positive and negative vorticity layers on the upper and lower surfaces of the airfoil respectively. As also found by Polet et al. (Reference Polet, Rival and Weymouth2015), the pitch-up motion induces the stagnation streamline between positive and negative vorticity to slightly move upstream the trailing edge. This is consistent with previous studies showing that the Kutta condition breaks down during the initial stages of highly unsteady manoeuvres (McCroskey Reference McCroskey1982; Ford & Babinsky Reference Ford and Babinsky2013).
Vorticity flow fields obtained for three shape change numbers
 $\unicode[STIX]{x1D6EF}=0.25$
, 0.5 and 1 (from top to bottom) at four instants
 $t_{T}=0.25$
, 0.5, 0.75 and 1 (from left to right).
 $Qc^{2}/U^{2}=0.1$
isolines at the trailing edge are depicted in orange for
 $t_{T}=0.5$
. LEV, leading edge vortex.
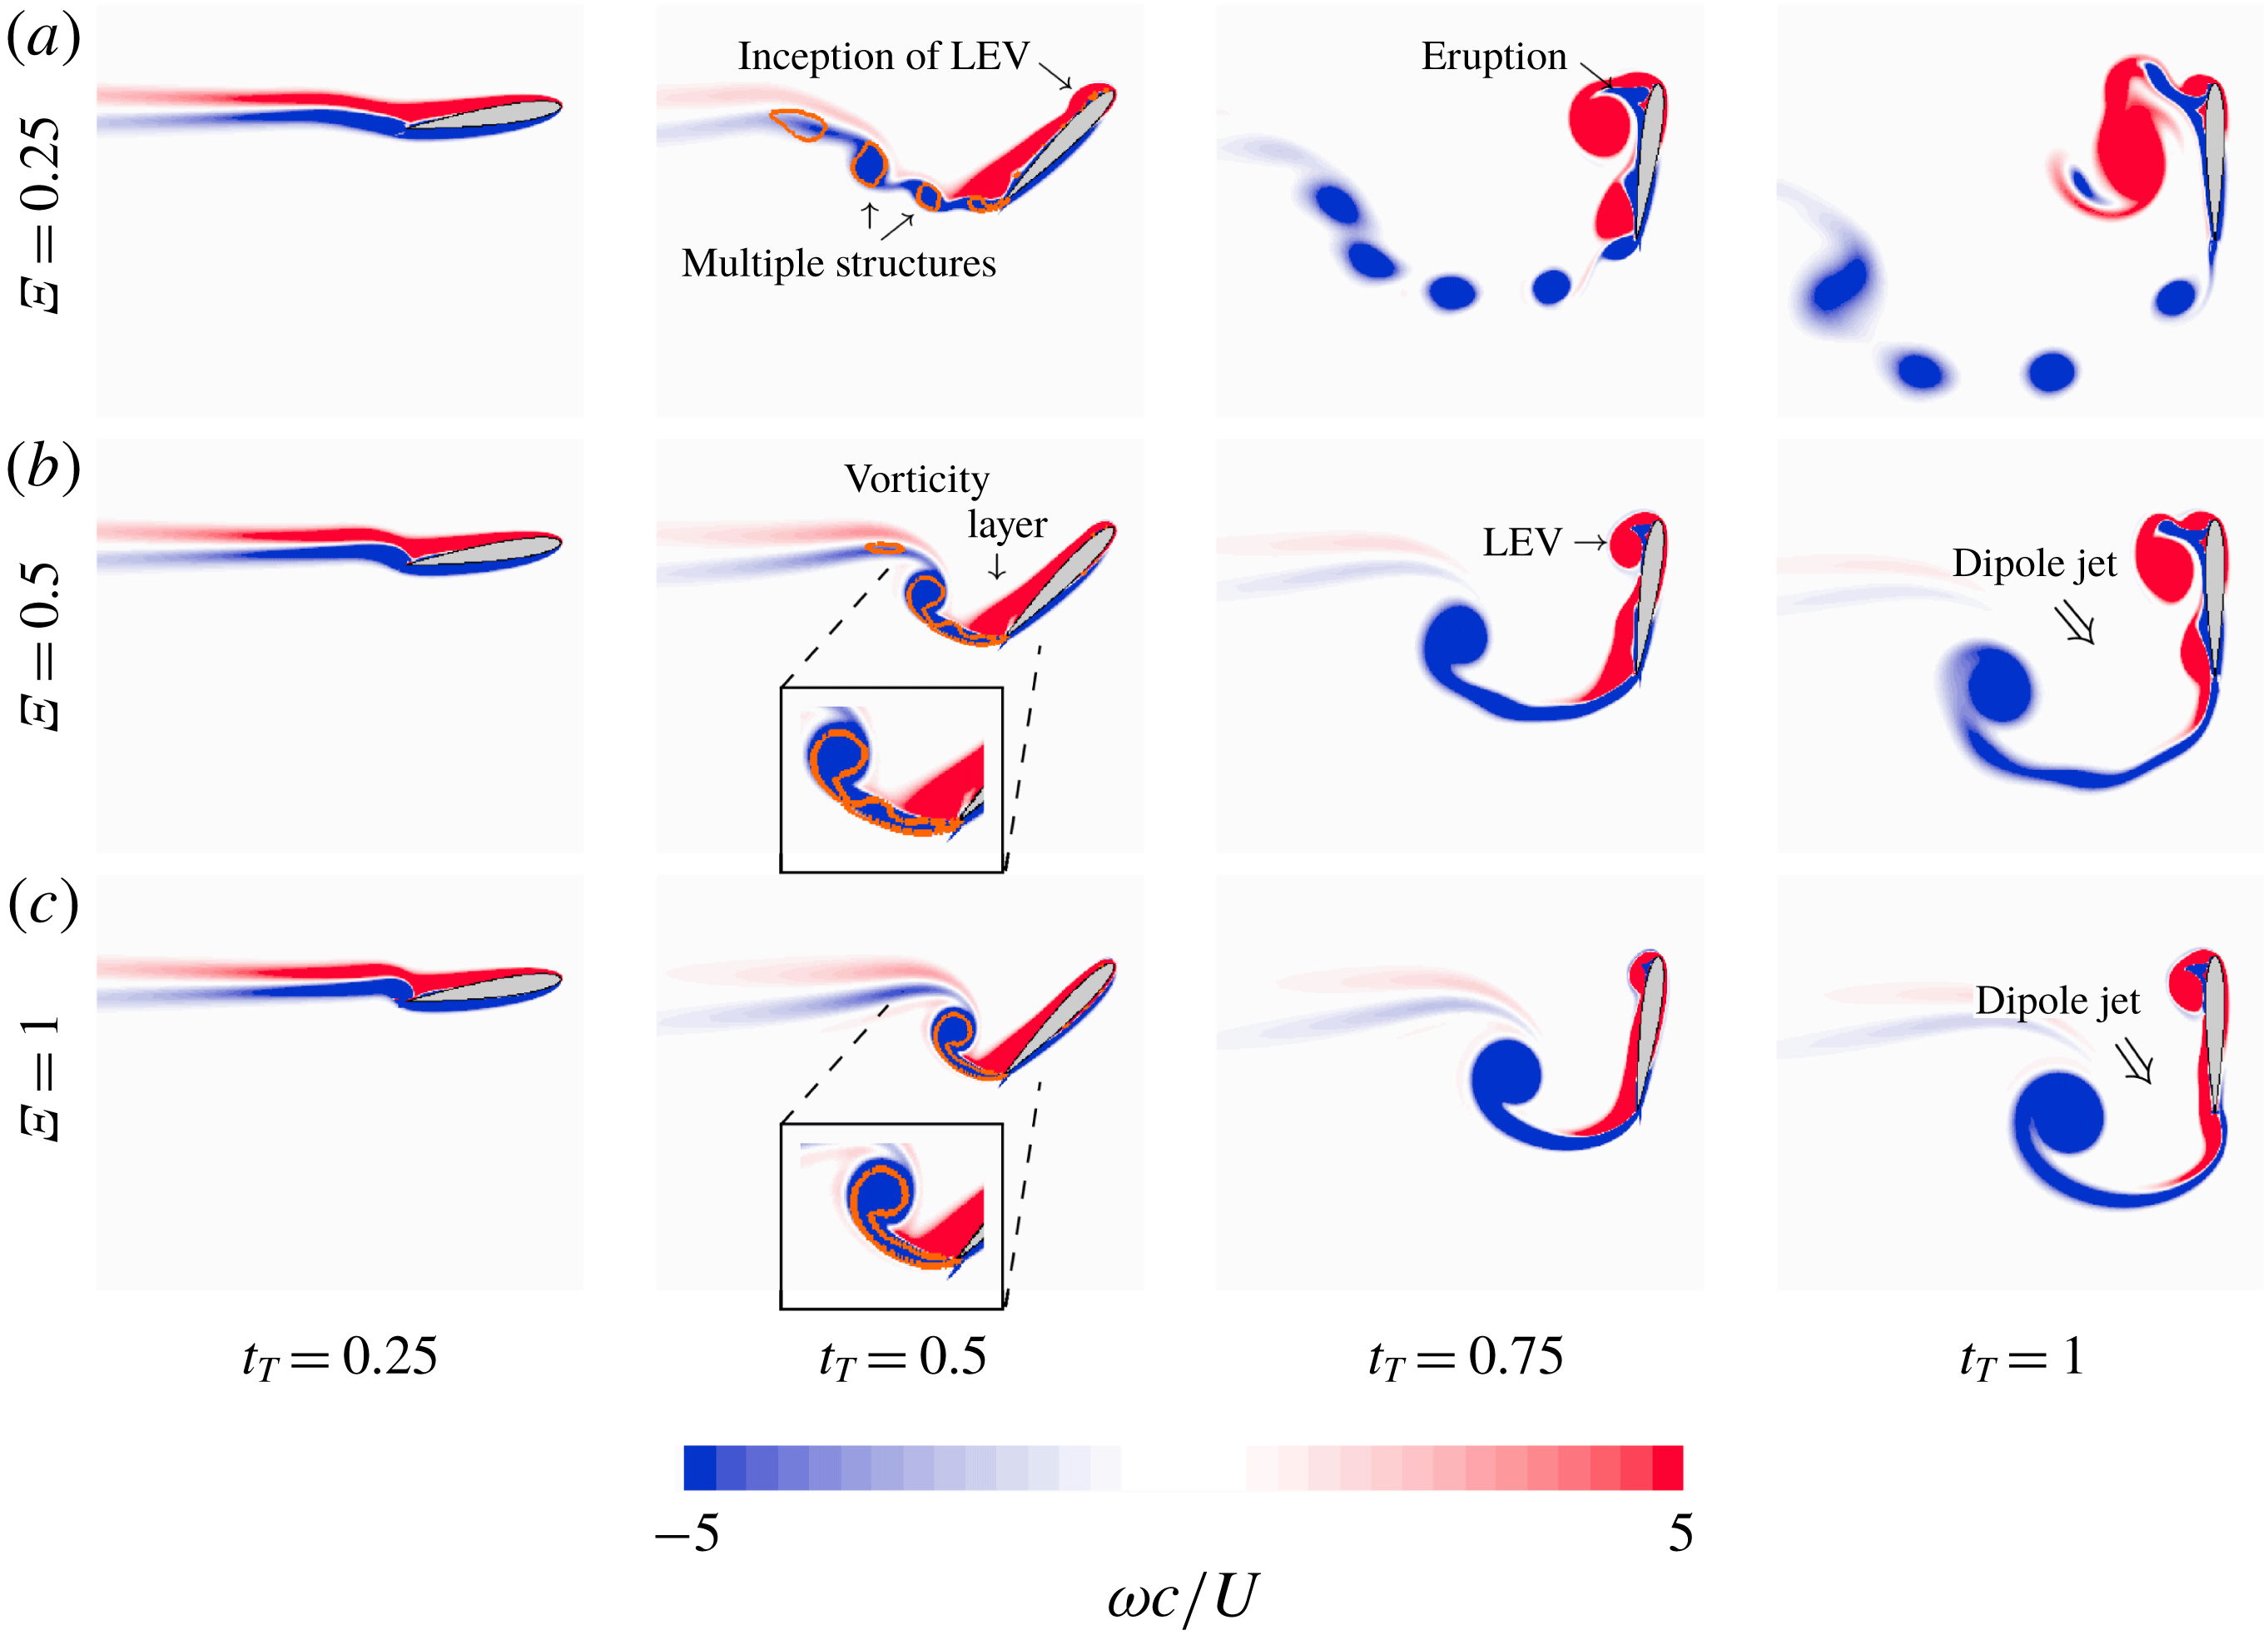
As the airfoil further rotates, negative vorticity is shed from the trailing edge and rolls up into a single clockwise rotating vortex in the
 $\unicode[STIX]{x1D6EF}=0.5$
and 1 cases and into multiple clockwise rotating vortices in the
 $\unicode[STIX]{x1D6EF}=0.25$
case (
 $t_{T}=0.5$
). The pitch-up time scale in the
 $\unicode[STIX]{x1D6EF}=0.25$
case allows for a Kelvin–Helmholtz (KH) type instability to develop in the negative vorticity shear layer emanating from the trailing edge, resulting in small negative vorticity structures. That is, the time scale of the KH instability is smaller than the time scale of the pitch-up motion. On the other hand, the KH instability can not sufficiently develop in the
 $\unicode[STIX]{x1D6EF}=0.5$
and 1 cases because of a smaller pitch-up time scale. At this time (
 $t_{T}=0.5$
), clockwise rotating vortices are the dominant flow structures. According to Kelvin’s circulation theorem, they can be viewed as resulting from the generation of positive circulation around the airfoil due to the combined translating and rotating motions, sometimes referred to as the Kramer effect (Kramer Reference Kramer1932). Their non-dimensional circulation
 $\unicode[STIX]{x1D6E4}/cU$
increases with shape change number, from 1.3 for
 $\unicode[STIX]{x1D6EF}=0.25$
to 1.7 and 2.9 for
 $\unicode[STIX]{x1D6EF}=0.5$
and 1 respectively. Here
 $\unicode[STIX]{x1D6E4}$
is computed by integrating negative vorticity emanating from the trailing edge over the area contained within the
 $Qc^{2}/U^{2}=0.1$
isoline (
 $Q$
is the dimensional Q-criterion, see Hunt, Wray & Moin (Reference Hunt, Wray and Moin1988)). In addition, one can also observe the presence of the thick positive vorticity layer that remains close to the upper surface of the airfoil.
At
 $t_{T}=0.75$
, the formation of a counter-clockwise rotating vortex can be observed at the leading edge. The size of this LEV decreases with
 $\unicode[STIX]{x1D6EF}$
. In particular, it can be observed that the larger LEV at
 $\unicode[STIX]{x1D6EF}=0.25$
results from an earlier inception, already visible at
 $t_{T}=0.5$
. These differences in LEV size can be correlated with those observed in past studies on translational pitching airfoils (where translation is prescribed along one single direction) and where increasing pitch rate was found to delay stall (e.g. Visbal & Shang (Reference Visbal and Shang1989), Eldredge & Wang (Reference Eldredge and Wang2010), Ol et al. (Reference Ol, Altman, Eldredge, Garmann and Lian2010)). Pitch-up motion induces an upward velocity of the leading edge, hence a reduced effective angle of attack of the airfoil, which tends to delay stall to a larger pitch angle. Furthermore, pitch-up motion causes the pressure gradient and effective airfoil velocity (i.e. effective Reynolds number) to increase, which favours a more compact and stronger LEV. Increase in effective velocity with
 $\unicode[STIX]{x1D6EF}$
is further enhanced here due to free translations which result in larger translating velocities at larger
 $\unicode[STIX]{x1D6EF}$
(see figure 6). More importantly, at a given
 $t_{T}$
, the airfoil has travelled a shorter distance as
 $\unicode[STIX]{x1D6EF}$
increases, reducing the effective feeding of the LEV by the vorticity through the leading edge shear layer. As the LEV further develops and interacts with the upper surface of the airfoil, it generates opposite sign (negative) vorticity that is entrained in the leading edge shear layer. This mechanism, sometimes referred to as the eruption of opposite sign vorticity, is known to promote detachment of the LEV on translating airfoils (Widmann & Tropea Reference Widmann and Tropea2015). In addition, the positive vorticity layer on the upper surface of the airfoil tends to roll up into a more compact vortical structure in the vicinity of the trailing edge.
At
 $t_{T}=1$
, the LEV in the
 $\unicode[STIX]{x1D6EF}=0.25$
case detaches under the influence of vorticity layer eruption and merges with the positive, aft vortical structure. In the
 $\unicode[STIX]{x1D6EF}=0.5$
case, the LEV is about to detach and has not yet merged with the positive aft structure. In the
 $\unicode[STIX]{x1D6EF}=1$
case, the LEV is still relatively small and attached to the airfoil and the positive vorticity near the trailing edge is entrained by the trailing edge shear layer. Despite these differences, all three cases exhibit two distinct vorticity regions: a negative vorticity region at the trailing edge on the one hand and a positive vorticity region at the leading edge on the other hand. These two regions act like a vorticity dipole associated with a fluid jet oriented downward and slightly forward (depending on the value of
 $\unicode[STIX]{x1D6EF}$
), i.e. producing upward and backward forces consistent with figure 4.
3.2.2 Stopping phase
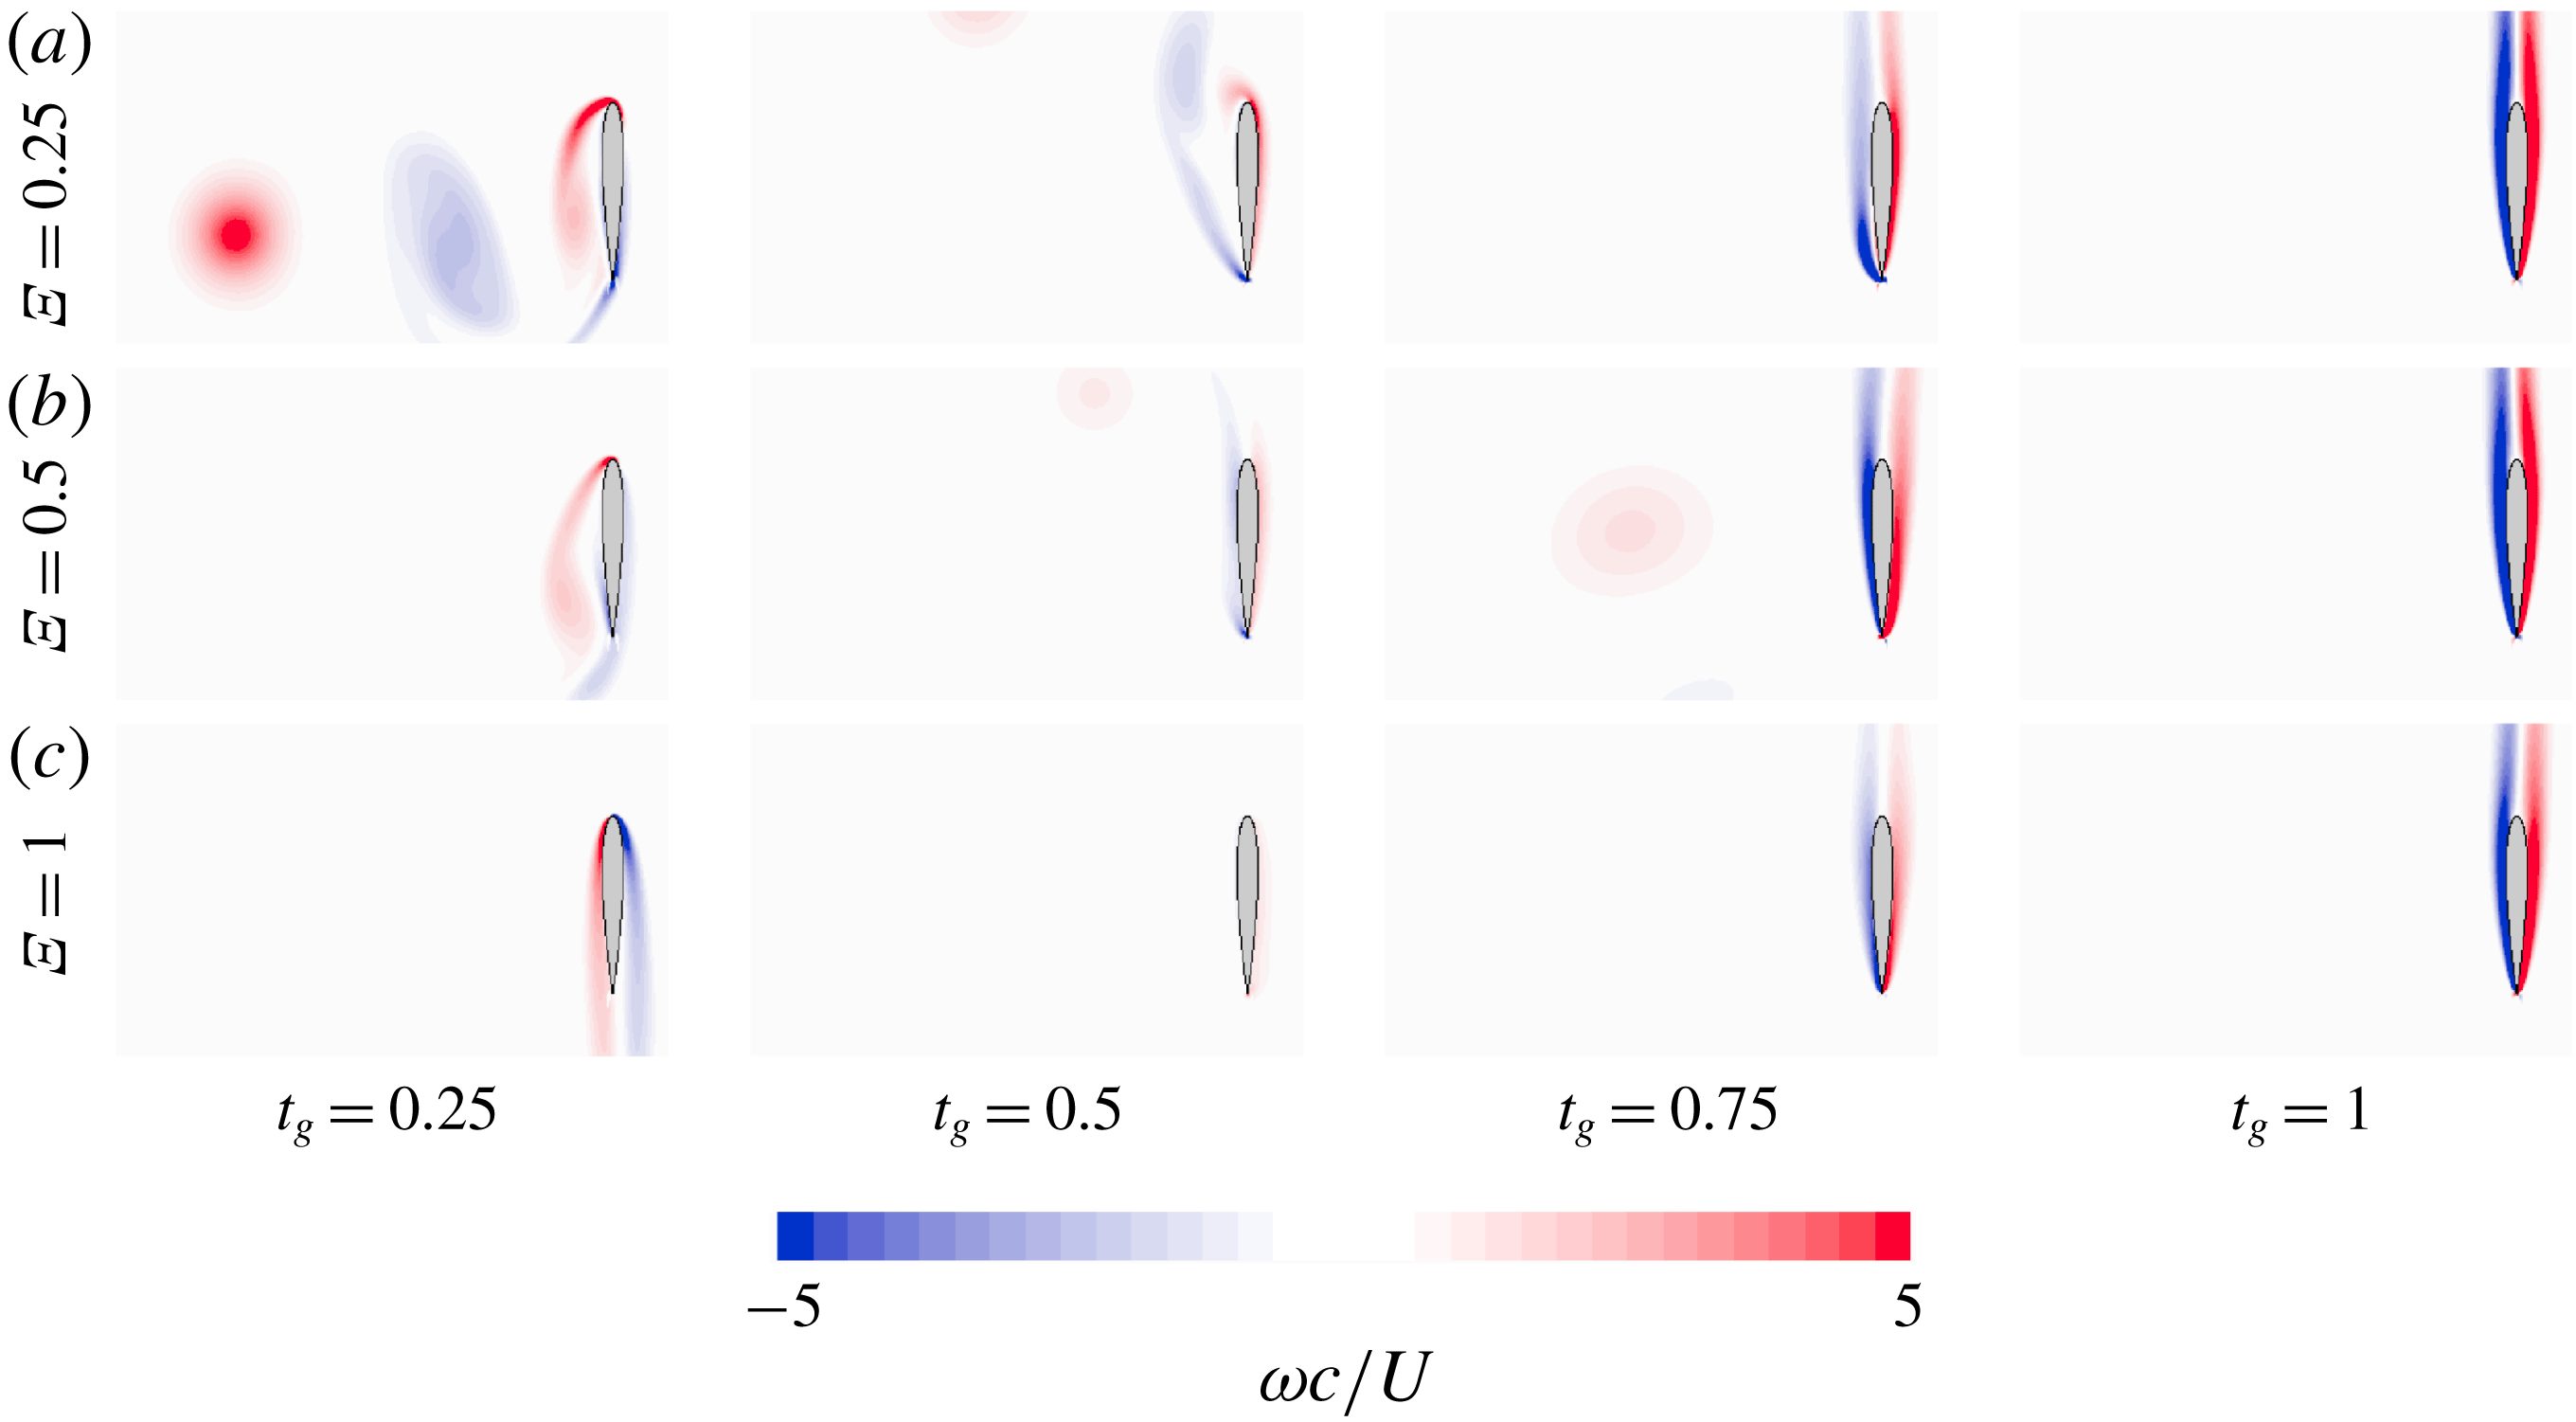
We then look at the instantaneous vorticity fields obtained during the ascending portion of the stopping phase. Flow fields at
 $t_{g}=0.05$
, 0.1, 0.15 and 0.2 are displayed in figure 9.
In all cases, the flow field turns into a complex system consisting of multiple interacting structures. Observed phenomena include interaction between the LEV and the airfoil upper surface, subsequent entrainment of the opposite sign vorticity layer, generation of new leading and trailing edge vortices. Because the airfoil is directed vertically during the ascending phase, these highly nonlinear structures and mutual interactions have a strong impact on the horizontal force and explain the chaotic trend observed in figure 4(a).
Vorticity flow fields obtained for three shape change numbers
 $\unicode[STIX]{x1D6EF}=0.25$
, 0.5 and 1 (from top to bottom) at four instants
 $t_{g}=0.05$
, 0.1, 0.15 and 0.2 (from left to right).

Strong differences exist between patterns observed for cases
 $\unicode[STIX]{x1D6EF}=0.25$
, 0.5 and 1. Furthermore, the flow field for a given
 $\unicode[STIX]{x1D6EF}$
exhibits differences from that observed in its counterpart with a prescribed translating motion (Polet et al.
Reference Polet, Rival and Weymouth2015) (see figure 2). In addition to effects induced by variation in the wall-normal leading edge velocity and distance of travel at different pitch rates (addressed earlier in § 3.1), these differences partly result from the fluid–structure interaction that imposes different translation speed for each case. Apart from a different effective Reynolds number, a direct consequence is that the angle of attack of the airfoil
 $\unicode[STIX]{x1D6FC}^{\prime }$
is not equal to the prescribed pitch angle
 $\unicode[STIX]{x1D6FC}$
, since it depends on the translation velocities
 $u_{x}$
and
 $u_{y}$
. The angle of attack is equal to
 $\unicode[STIX]{x1D6FC}^{\prime }=\unicode[STIX]{x1D6FC}-\unicode[STIX]{x1D719}$
where
 $\unicode[STIX]{x1D719}$
is the airfoil angle of displacement and is equal to
 $\unicode[STIX]{x1D719}=\arctan (u_{y}/u_{x})$
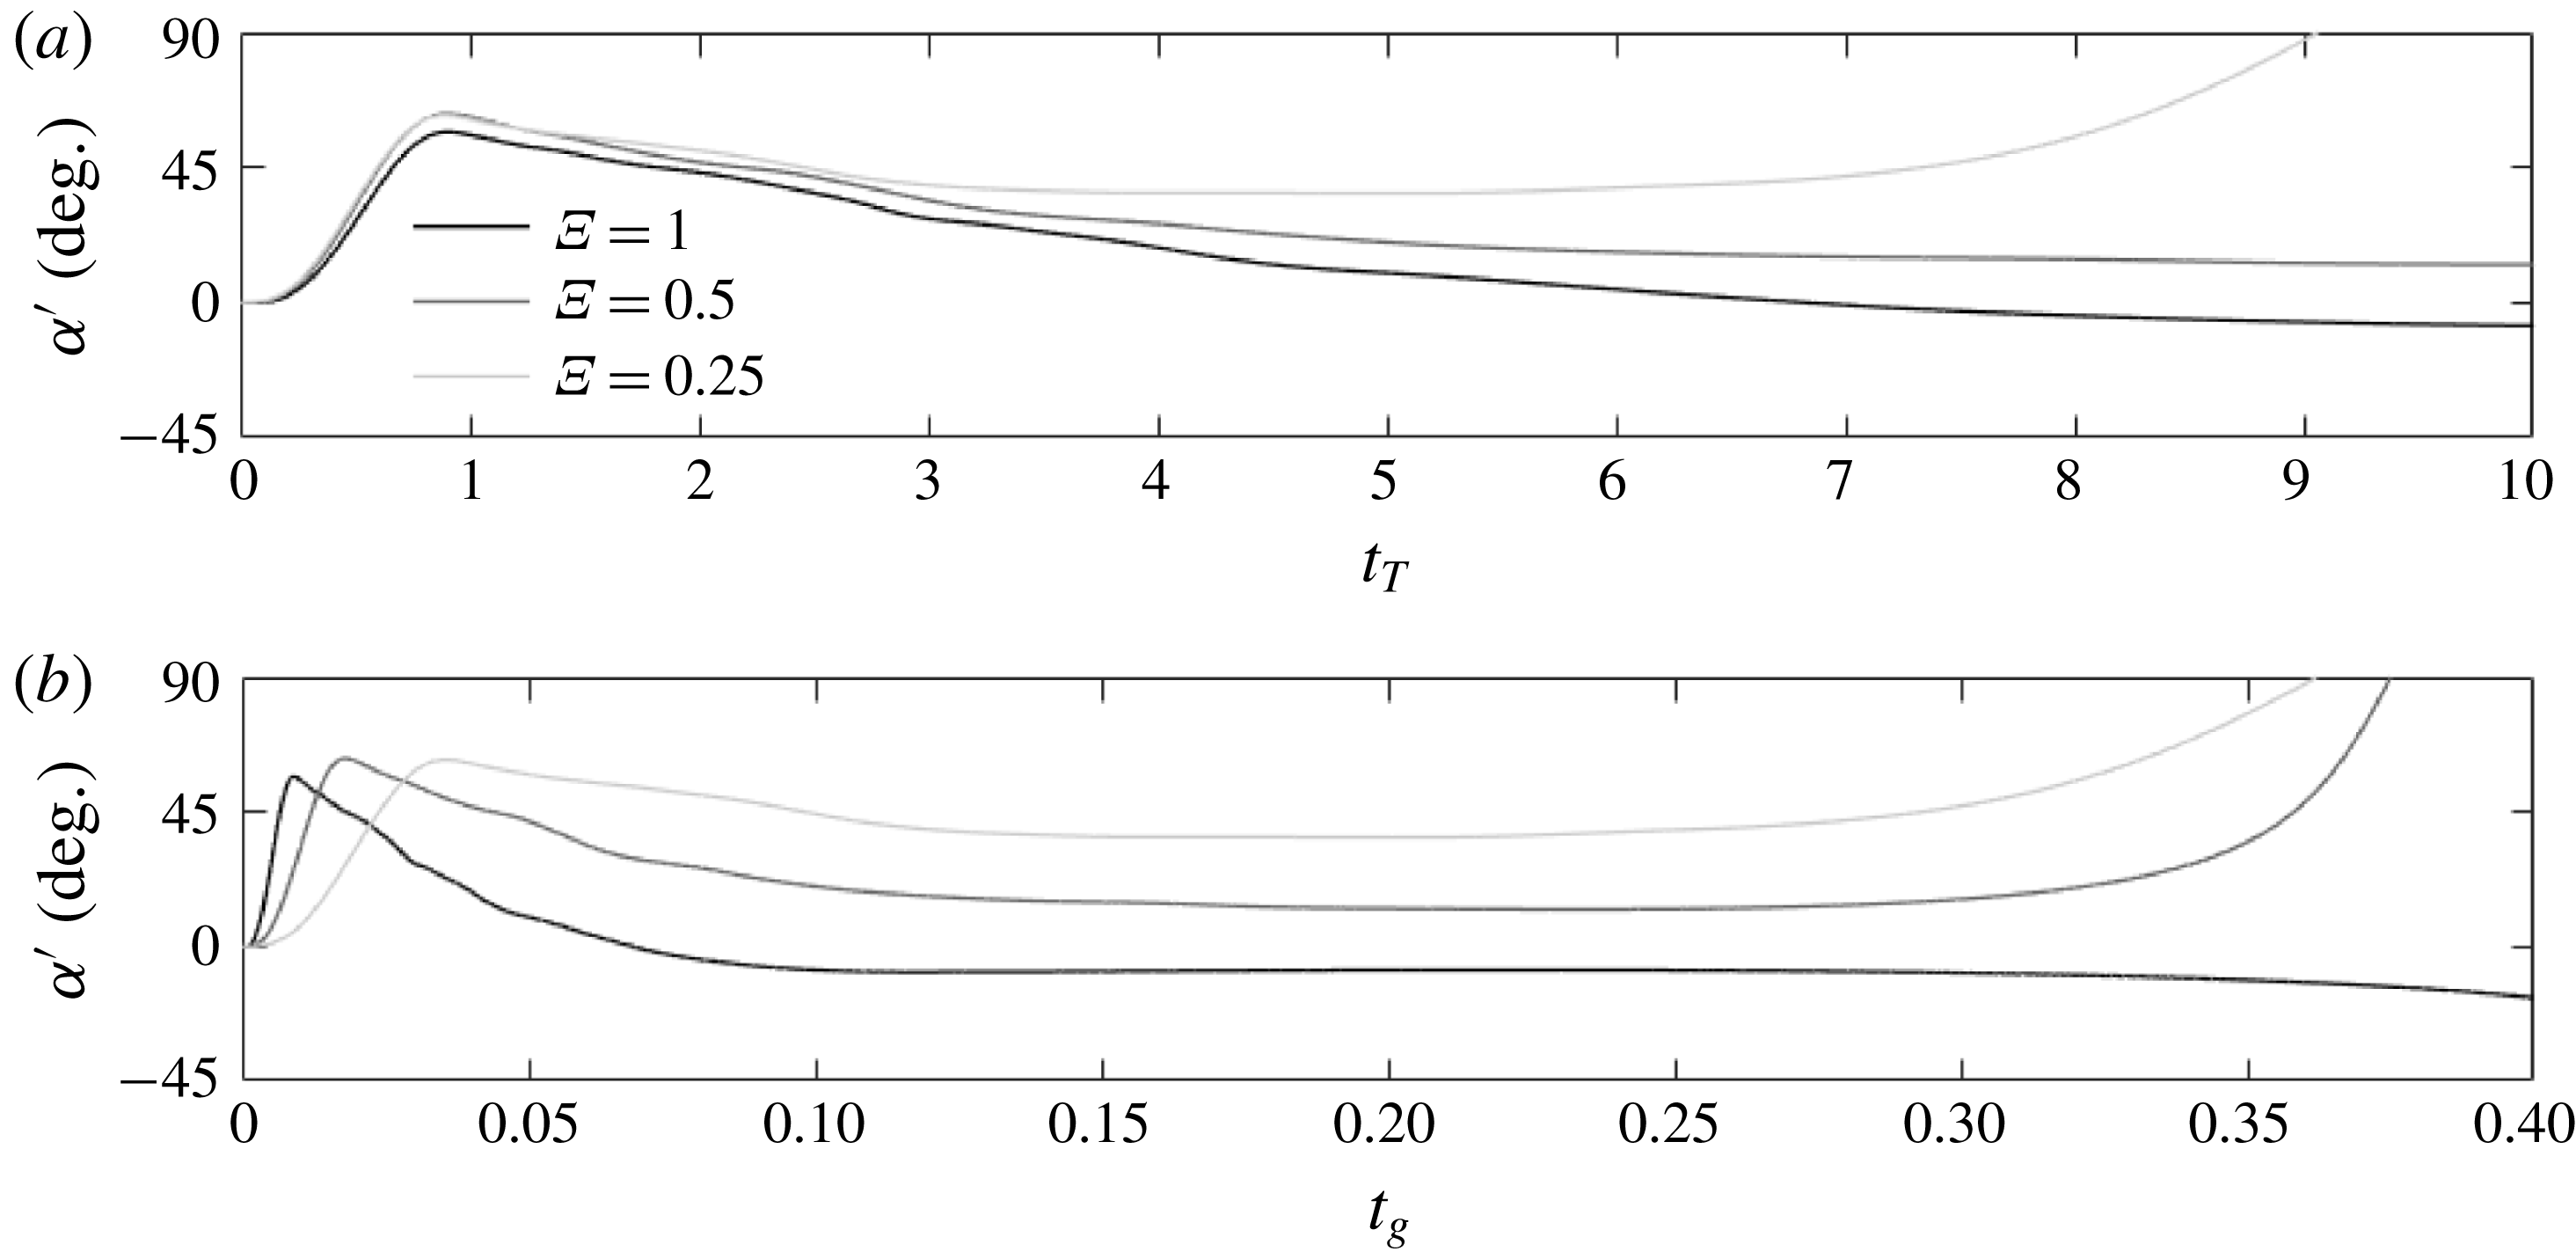
. Figure 10(a) plots the angle of attack
 $\unicode[STIX]{x1D6FC}^{\prime }$
as a function of time
 $t_{T}$
.
 $\unicode[STIX]{x1D6FC}^{\prime }$
rapidly increases during the pitch-up phase, accordingly to the prescribed augmentation of
 $\unicode[STIX]{x1D6FC}$
. However, because of the change in trajectory of the airfoil (i.e. the increase in
 $\unicode[STIX]{x1D719}$
),
 $\unicode[STIX]{x1D6FC}^{\prime }$
increases less rapidly than
 $\unicode[STIX]{x1D6FC}$
and reaches maximum value of the order of
 $60^{\circ }$
. When compared to cases with prescribed motion for which
 $\unicode[STIX]{x1D6FC}^{\prime }$
(equal to
 $\unicode[STIX]{x1D6FC}$
) increases up to
 $90^{\circ }$
, this contributes to reducing the strength of the leading edge vortex observed during the late part of the pitch-up motion. Furthermore, it can be shown that
 $\unicode[STIX]{x1D6FC}^{\prime }$
slightly decreases with increasing
 $\unicode[STIX]{x1D6EF}$
, which, again, contributes to differences in LEV size observed in the previous subsection at
 $t_{T}=0.75$
. These differences further increase at larger times leading to completely different dynamics, as shown in figure 11.
Angle of attack of the airfoil as a function of
 $t_{T}$
(a) and
 $t_{g}$
(b) for three shape change numbers
 $\unicode[STIX]{x1D6EF}=0.25$
, 0.5 and 1.
At larger times, it was previously shown that
 $U/g$
is a more appropriate reference time scale. Figure 10(b) depicts
 $\unicode[STIX]{x1D6FC}^{\prime }$
as a function of
 $t_{g}$
. It can be seen that the
 $\unicode[STIX]{x1D6FC}^{\prime }$
curves have similar trends, yet with large offsets. In the
 $\unicode[STIX]{x1D6EF}=1$
case, the ascending velocity largely dominates the horizontal velocity such that the angle of attack of the airfoil is small and the flow structure progressively decreases in complexity. It can be seen from figure 11 that, at
 $t_{g}=0.25$
, the flow field for this case is characterized by an attached flow with opposite sign vorticity layers on both sides of the airfoil. On the contrary, the flow field for
 $\unicode[STIX]{x1D6EF}=0.25$
and 0.5 is characterized by leading and trailing edge vortices that shed into the wake, causing fluctuating forces on the airfoil and, subsequently, small perturbations in the horizontal displacement.
After maximum gain in altitude is reached, the airfoil falls and experiences reversed flow. The flow is characterized by an attached flow with opposite sign vorticity layers on both sides of the airfoil. The magnitude of the downward velocity increases asymptotically to the equilibrium velocity where the vertical aerodynamic force balances the gravity force.
Vorticity flow fields obtained for three shape change numbers
 $\unicode[STIX]{x1D6EF}=0.25$
, 0.5 and 1 (from top to bottom) at four instants
 $t_{g}=0.25$
, 0.5, 0.75 and 1 (from left to right).
3.3 Minimum kinetic energy manoeuvres
From the above analysis, it can be understood that high shape change numbers lead to high aerodynamic forces during the pitch-up motion, hence severe changes in horizontal and vertical airfoil velocities. Overall, it is shown that the shape change number drives the vertical velocity at the end of the pitch-up motion, which in turn drives the maximum gain in altitude. For the three cases considered above, the horizontal velocity has significantly decreased when the airfoil reaches maximum altitude where the vertical velocity is zero. As such, minimum kinetic energy roughly coincides with the maximum gain in altitude. However, for lower shape change number, the horizontal velocity may still be significant when maximum altitude is reached. This is due to the fact that the decrease in horizontal velocity is found to scale with the pitch-up time while the decrease in vertical velocity after pitch-up scales with the gravitational time. As a consequence, minimum kinetic energy may not coincide with maximum gain in altitude for all cases. Moreover, the global dynamics of the airfoil may depend nonlinearly on the pitch-up time leading to non-trivial optimal manoeuvres. Therefore, in order to reveal optimal manoeuvres, in terms of minimum kinetic energy with and without constraints on perching location, simulations are performed for a large number of shape change numbers.
3.3.1 Unconstrained perching location
Figure 12(a,b) shows the minimum velocity magnitude
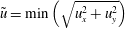 $\tilde{u} =\min \left(\sqrt{u_{x}^{2}+u_{y}^{2}}\right)$
(i.e. minimum kinetic energy) reached by the airfoil as a function of the shape change number. All cases achieve a velocity magnitude lower than 10 % of the initial translational velocity.
Minimum velocity magnitude reached by the airfoil as a function of shape change number (a,b). Vertical (c,d) and horizontal (e,f) displacements of the airfoil at minimum velocity magnitude. Conventional (a,c,e) and zoomed, logarithmic (b,d,f) scales.
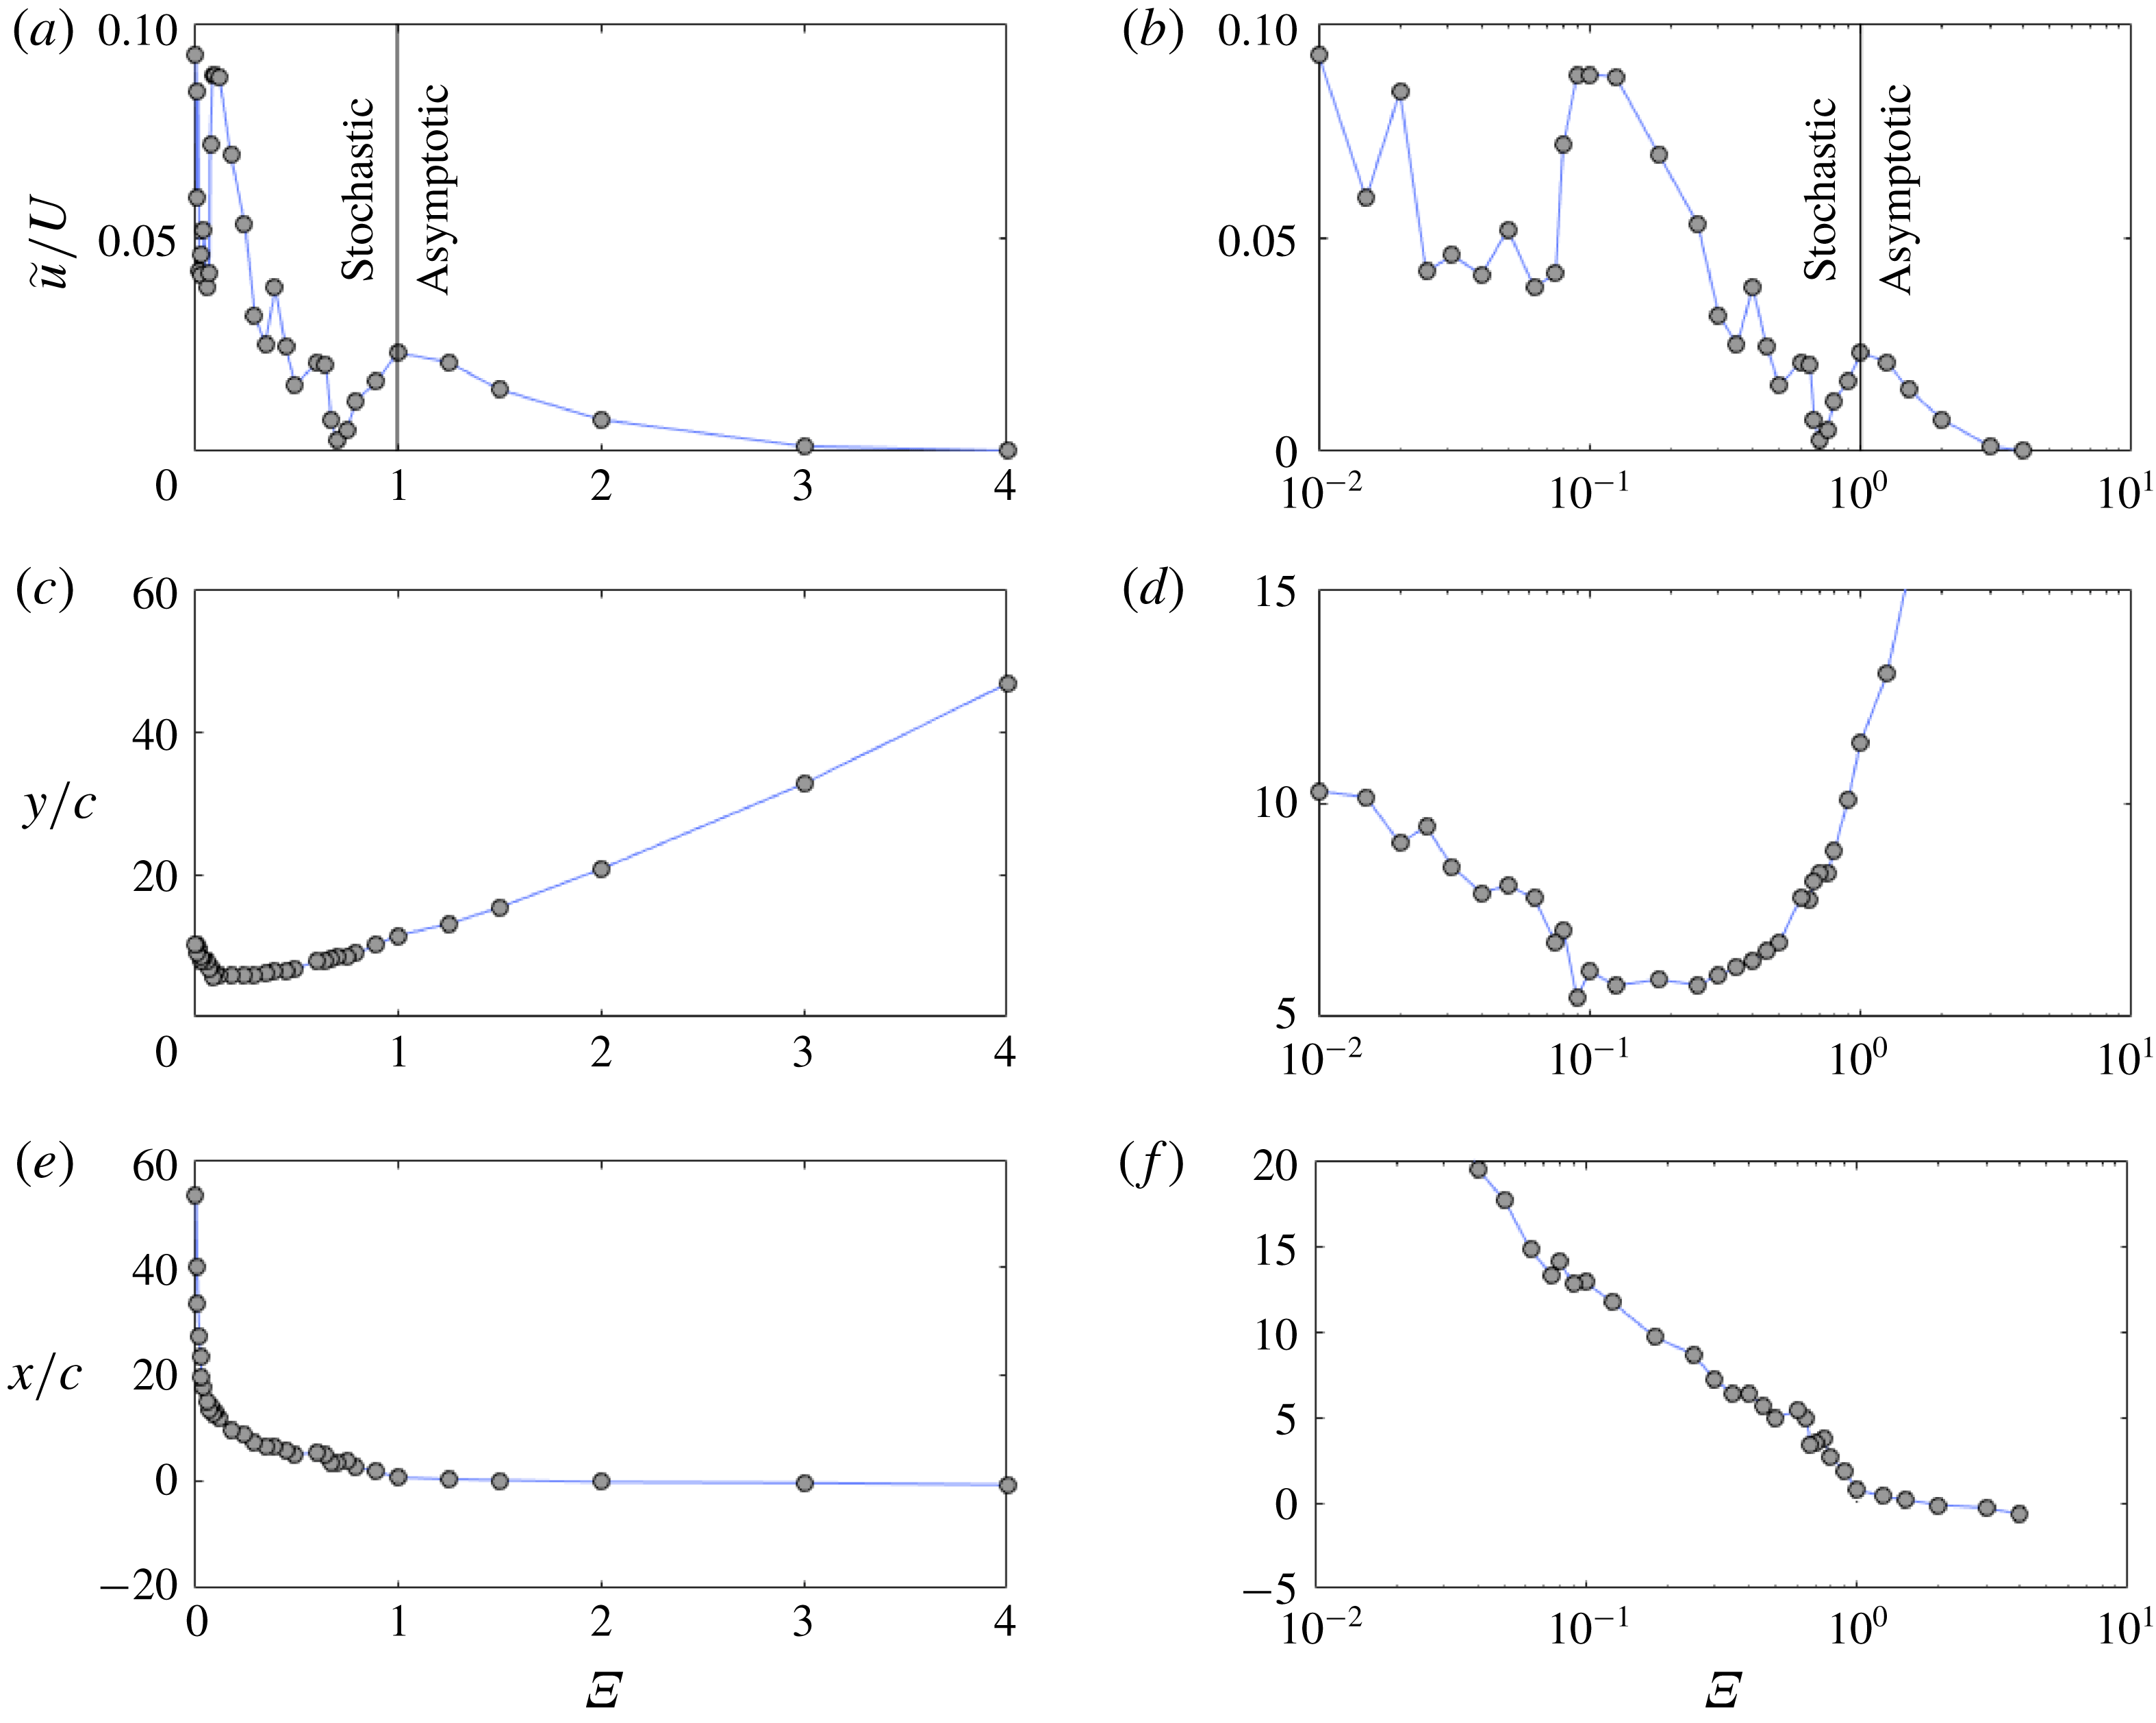
In the higher shape change number range, i.e.
 $\unicode[STIX]{x1D6EF}>1$
, the curve asymptotically tends to zero. For such large values, as previously explained, the horizontal velocity has time to decrease to negligible values before the airfoil reaches maximum altitude where the vertical velocity is zero. Again, because the decrease in horizontal velocity scales with
 $t_{T}$
while the decrease in vertical velocity scales with
 $t_{g}$
, decreasing
 $\unicode[STIX]{x1D6EF}$
implies that the horizontal velocity has not yet decreased to negligible values when maximum altitude is reached. Hence, minimum kinetic energy slightly increases.
As
 $\unicode[STIX]{x1D6EF}$
is further decreased below
 $\unicode[STIX]{x1D6EF}=1$
, the curve exhibits a highly unpredictable, chaotic trend. Slight modifications of the shape change number can lead to drastic changes in minimum kinetic energy. The right column in figure 12 shows similar data to those plotted on the left column using a semi-log axis to better highlight this chaotic trend. Below
 $\unicode[STIX]{x1D6EF}=1$
, the minimum kinetic energy is reached for
 $\unicode[STIX]{x1D6EF}=0.7$
, and corresponds to a velocity magnitude that is below 0.25 % of the initial translational velocity. Note however that because of the highly chaotic trend it is unknown whether another value of
 $\unicode[STIX]{x1D6EF}$
(i.e. not tested here) would lead to a lower kinetic energy. Yet, reaching lower levels of kinetic energy is of limited interest regarding the already very low levels reached for
 $\unicode[STIX]{x1D6EF}=0.7$
.
While high shape change numbers (in the asymptotic range) allow very low, negligible kinetic energy to be reached, they do not allow for these levels to be reached at low altitude. For these cases, the reduction in kinetic energy to its minimum value is accompanied by a significant gain in altitude which, from a practical perspective, may be undesirable. Figure 12(c,d) shows the vertical displacement at minimum kinetic energy. It is clear that, in the asymptotic range, increasing the shape change number results in an increase in the vertical displacement. This trend persists to lower values of
 $\unicode[STIX]{x1D6EF}$
(i.e. below 1) and then reverses as
 $\unicode[STIX]{x1D6EF}$
tends to zero, for values roughly below 0.1.
 $\unicode[STIX]{x1D6EF}\approx 0.1$
appears as an optimal value where the vertical displacement at minimum kinetic energy is minimum. The horizontal displacement at minimum kinetic energy as a function of the shape change number (figure 12
e,f) exhibits a much simpler, monotonic trend. High shape change numbers lead to rapid decrease in horizontal velocity (which, again, scales with
 $t_{T}$
) and limits forward displacement. In the most extreme cases, it was shown that the airfoil can even undergo a backward motion. As such, figure 12(e,f) shows that the horizontal displacement at minimum kinetic energy roughly tends to zero as
 $\unicode[STIX]{x1D6EF}\gg 1$
. In this limit, it is straightforward that the overall displacement tends towards very high values.
3.3.2 Constrained perching location
The vertical displacement at minimum kinetic energy obtained for the
 $\unicode[STIX]{x1D6EF}=0.09$
case (5.46 chords) may still appear rather high for some specific manoeuvres. From a practical perspective, it is relevant to identify which shape change number leads to minimum kinetic energy with the constraint that perching occurs at a vertical position equal to (or close to) the initial vertical position. Note that this constraint still allows the vehicle to experience a large gain in altitude before reaching the constrained vertical position.
Velocity magnitude of the airfoil as it reaches its initial vertical position
 $y=0$
(a,b) – conventional (a,c) and logarithmic (b,d) scales. Minimum velocity magnitude of the airfoil as it reaches a vertical position within
 $y/c=0\pm \unicode[STIX]{x0394}y/c$
(c) and corresponding shape change number (d).
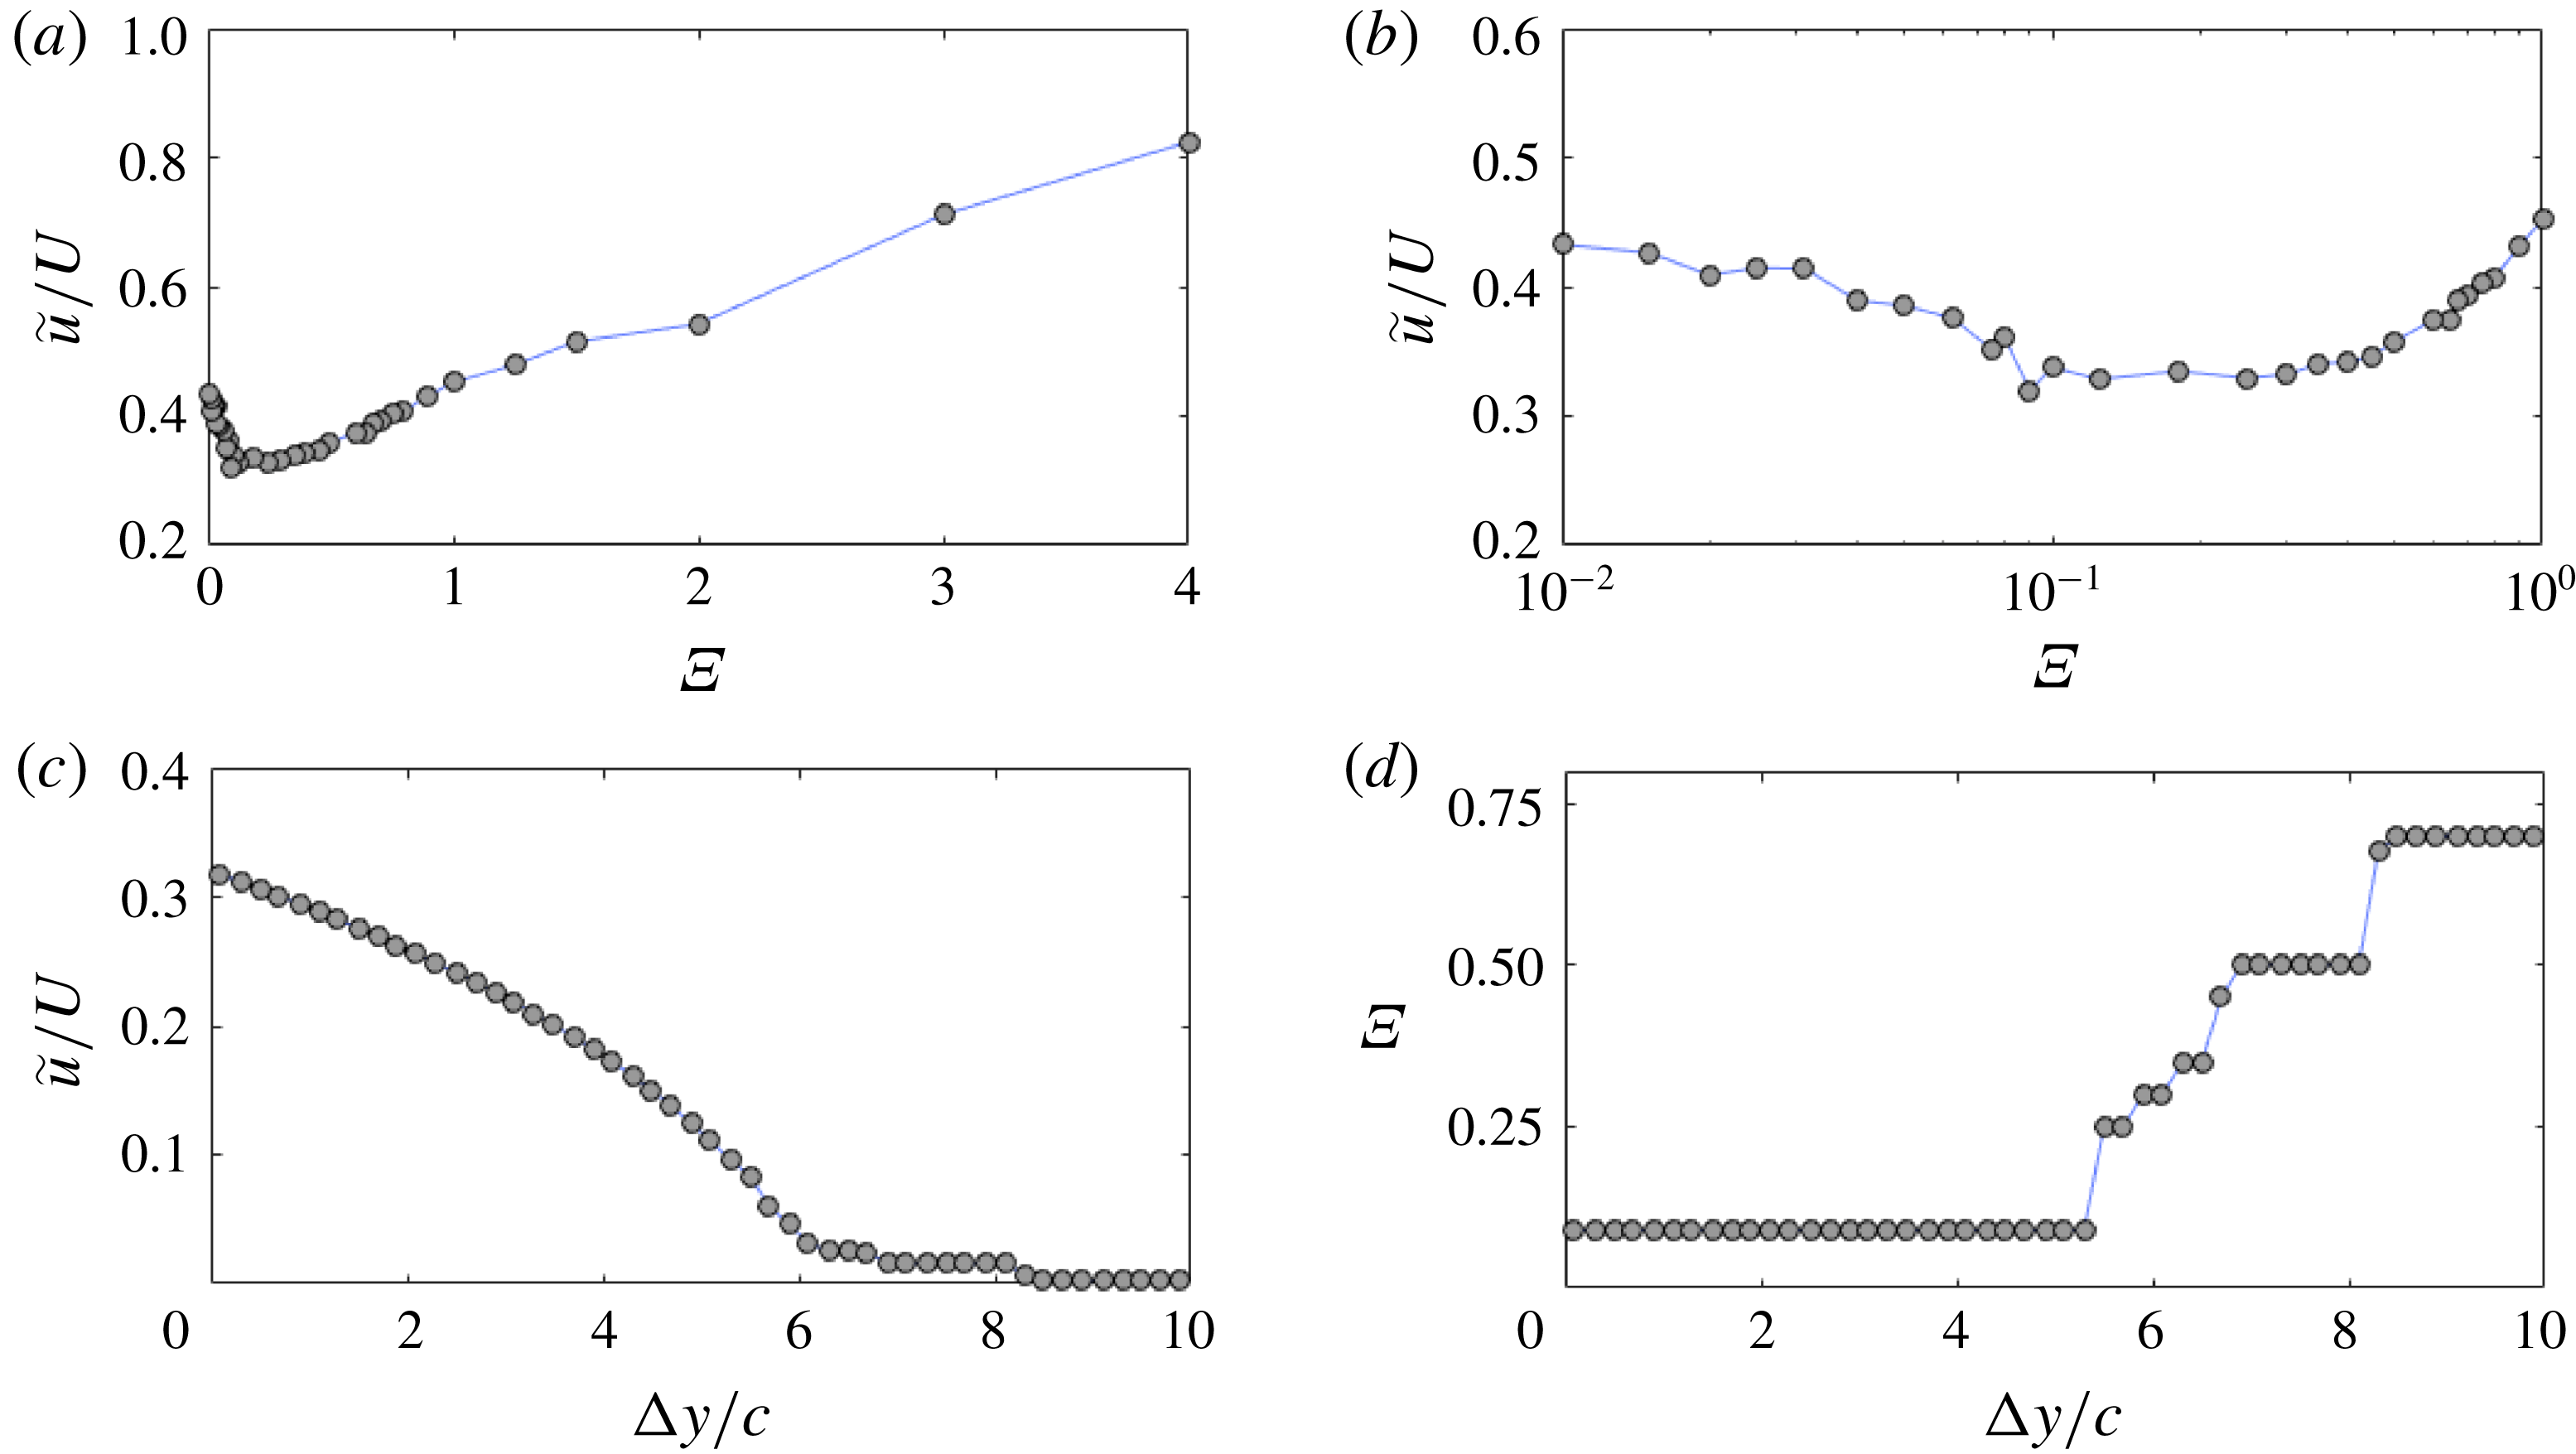
Figure 13(a,b) shows the velocity magnitude of the wing when it reaches its initial vertical position (i.e.
 $y=0$
), as a function of the shape change number. Here again,
 $\unicode[STIX]{x1D6EF}\approx 0.1$
appears to be the optimal value for minimum kinetic energy, with the velocity magnitude decreasing to approximately one third of the initial translational velocity. Previous results demonstrated that lower kinetic energy levels could be reached at higher shape change numbers (
 $\unicode[STIX]{x1D6EF}=0.7$
in the stochastic region and
 $\unicode[STIX]{x1D6EF}\gg 1$
in the asymptotic region). However, the latter were obtained for
 $y>0$
. Therefore, for these cases, the kinetic energy rises again to large values when the airfoil falls back to
 $y=0$
. On the other hand, the gain in altitude at minimum kinetic energy is still limited for the
 $\unicode[STIX]{x1D6EF}=0.09$
case (5.46 chords) and the velocity magnitude therefore ‘only’ increases back to 32 % of the initial translational velocity as the airfoil falls back to
 $y=0$
. Figure 13(a,b) further shows that the velocity magnitude remains close to one third of the initial translational velocity for a relatively broad range of shape change numbers,
 $\unicode[STIX]{x1D6EF}\in [0.09{-}0.3]$
.
We then relax the strict
 $y=0$
constraint on the perching location to a
 $y=0\pm \unicode[STIX]{x0394}y$
constraint. Figure 13(b,c) shows that kinetic energy decreases with
 $\unicode[STIX]{x0394}y/c$
(i.e. as the constraint is relaxed) until it reaches minimum values, previously observed in figure 12(a,b). Again, the optimal shape change number associated with small vertical displacement
 $y/c<5.5$
is
 $\unicode[STIX]{x1D6EF}\approx 0.1$
. Beyond 5.5 chords, a decrease in kinetic energy is obtained for increased shape change numbers. Yet, it is observed that
 $\unicode[STIX]{x1D6EF}$
remains within a narrow range,
 $\unicode[STIX]{x1D6EF}\in [0.25{-}0.75]$
.
These results demonstrate that a constraint in the vertical position of perching precludes shape change numbers in the asymptotic region because they are accompanied with too large gains in altitude. Thus, shape change numbers in the stochastic region are preferred, although they intrinsically lead to less accurate manoeuvres (i.e. more difficult to achieve for onboard controllers, precisely because of the chaotic trend). That is, a small uncertainty in the shape change number may result in non-negligible changes in kinetic energy at perching location.
Minimum velocity magnitude of the airfoil as it reaches a position (
 $x/c\pm 1$
,
 $y/c\pm 1$
) (a). Corresponding shape change number (b).

Finally, we look at the minimum velocity magnitude that the wing can reach at a specific perching location. Perching location in the
 $xy$
-plane is here defined with a tolerance on both
 $x$
and
 $y$
values of one chord. Overall, it is observed from figure 14(a) that, at least within the region
 $0\leqslant x/c\leqslant 12$
and
 $-2\leqslant y/c\leqslant 6$
, kinetic energy decreases with both
 $x$
and
 $y$
. It is clear, however, that changes in kinetic energy are more intense along the vertical direction. On the other hand, the shape change number required to reach minimum velocity magnitude nearly solely varies with
 $x$
(figure 14
b). Therefore, the global picture here is that gain in altitude is required to reach low kinetic energy while shape change number can be adjusted to control the horizontal displacement to perching location. Again, it is observed that values of
 $\unicode[STIX]{x1D6EF}$
remain in the range [0.1–1]. Within this range, quicker stops are obtained for larger shape change numbers, but with limited decrease in kinetic energy. For very quick stops, vehicle integrity may thus not be guaranteed due to (i) larger shape change numbers that lead to larger aerodynamic loads and (ii) relatively high levels of kinetic energy at perching location – note that Polet & Rival (Reference Polet and Rival2015) and Provini et al. (Reference Provini, Tobalske, Crandell and Abourachid2014) measured a
 $78\pm 4\,\%$
,
 $94\,\%$
and
 $96\,\%$
loss in total energy on black-capped chickadees, zebra finches and diamond doves respectively.
4 Discussion
Present results were obtained for a NACA0012 airfoil pitching around an axis located
 $1/6$
chord away from the leading edge, at a Reynolds number of 2000 and with solid-to-fluid density ratio 100 and non-dimensional gravity 0.01. Modifications to one of these parameters can lead to significant changes in the dynamics of the system. While the parameter space formed by all sets of parameters is too large to be comprehensively explored in the present work, previous works on translational pitching wing can help determine which parameters govern, to leading order, the dynamics of the wing.
For example, it was observed that the cross-sectional geometry does not significantly affect the flow response to translational pitching motion (Ol et al.
Reference Ol, Altman, Eldredge, Garmann and Lian2010; Eldredge & Jones Reference Eldredge and Jones2019). We verify this in the context of free translating airfoils by performing similar numerical simulations to those presented above, but for a flat plate profile (Reynolds number, pitch-axis location and mass are unchanged). Figure 15 compares the minimum velocity magnitude (i.e. minimum kinetic energy) reached by a flat plate airfoil with that reached by a NACA0012 airfoil, as a function of the shape change number. It can be observed that similar levels of kinetic energy are reached for both cross-sectional geometries, leading to similar stochastic and asymptotic trends for
 $\unicode[STIX]{x1D6EF}$
lower and higher than 1 respectively.
Minimum velocity magnitude reached by NACA0012 and flat plate airfoils as a function of shape change number.

The Reynolds number was also found to play a relatively minor role (Ol et al.
Reference Ol, Altman, Eldredge, Garmann and Lian2010; Eldredge & Jones Reference Eldredge and Jones2019), at least in the range
 $[10^{3}{-}10^{4}]$
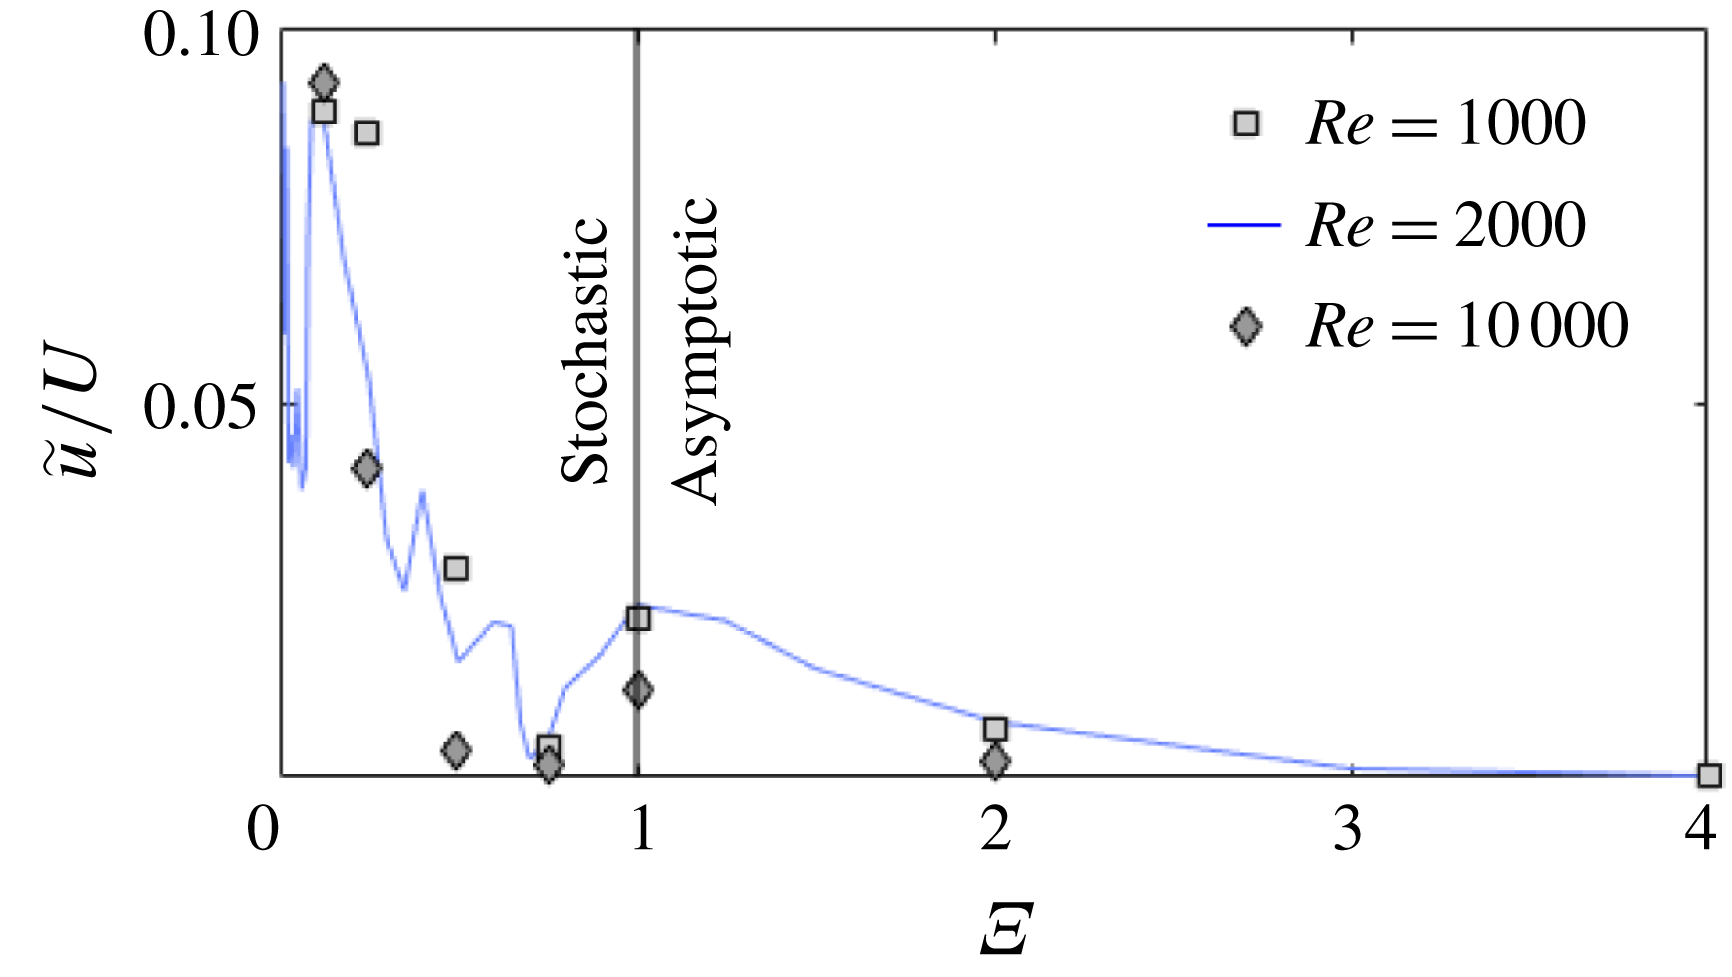
. Additional simulations were performed for Reynolds numbers 1000 and 10 000. Figure 16 supports previous results obtained on translational pitching wings in that modification of the Reynolds number in the range
 $[10^{3}{-}10^{4}]$
does not lead to significant changes in the minimum kinetic energy versus shape change number curve. Evidently, because of the stochastic nature of the response to a shape change number below 1, changes in any of the governing parameters may have a non-negligible effect on the levels of kinetic energy. Yet, the general trend of the minimum kinetic energy versus shape change number curve is not significantly altered. This may not be the case at much lower Reynolds numbers where increased viscous effects will tend to mitigate the stochastic nature of the response to shape change numbers.
Minimum velocity magnitude reached at Reynolds numbers 1000, 2000 and 10 000 as a function of shape change number.
Conversely to the cross-sectional geometry and Reynolds number, the location of the pitch axis was found to play an important role in the flow response to translational pitching motion (Visbal & Shang Reference Visbal and Shang1989; Yu & Bernal Reference Yu and Bernal2016; Eldredge & Jones Reference Eldredge and Jones2019). In fact, for a given shape change number, modification of this parameter leads to changes in the wall-normal component of velocity at the leading edge and can thus be compared, to leading order, to a modification in shape change number (Granlund et al. Reference Granlund, Ol and Bernal2013; Eldredge & Jones Reference Eldredge and Jones2019). From this point of view, the frontier between stochastic and asymptotic regions may occur at a different shape change number. Similarly, modifications in non-dimensional gravity will alter the relative importance of the pitch-up and gravitational time scales, which may shift the stochastic-to-asymptotic frontier. Future studies are thus required to provide insight into how modifications to these parameters will affect the dynamics of the wing.
5 Conclusion
Small birds exhibit fascinating flight agility that could help engineers develop highly manoeuvrable micro-air vehicles (MAVs) with short landing, or perching, capabilities. Perching manoeuvres of birds were recently investigated by several researchers (e.g. Carruthers et al.
Reference Carruthers, Thomas, Walkers and Taylor2010, Provini et al.
Reference Provini, Tobalske, Crandell and Abourachid2014, Polet & Rival Reference Polet and Rival2015) who demonstrated that strong deceleration could be achieved entirely through aerodynamic means, and in particular, using the aerodynamic force generated by the pitching wing. Following previous work by Polet et al. (Reference Polet, Rival and Weymouth2015), we numerically analysed the unsteady dynamics of a two-dimensional airfoil (with initial flight speed
 $U$
) continuously pitching from
 $0^{\circ }$
to
 $90^{\circ }$
about an axis located
 $1/6$
chord away from the leading edge with different shape change numbers, and freely translating in the horizontal and vertical directions as a response to aerodynamic and gravitational forces (non-dimensional gravity equal to 0.01).
For characteristic shape change numbers, we showed that wing pitch-up induces strong aerodynamic forces, which results in significant deceleration and acceleration in the horizontal and vertical directions respectively. The horizontal velocity is found to scale with the pitch-up time, at the end of which it is still more than half of the initial flight velocity. The vertical velocity scales with the pitch-up time during pitch-up, and with gravitational time after pitch-up. As such, the dynamics of the airfoil along the vertical direction can be understood as a rather simple problem where the pitch-up motion drives the vertical velocity reached by the airfoil at the end of the pitch-up time, which then acts as an initial condition for the motion of a body solely submitted to the gravitational force. The vertical velocity at the end of the pitch-up time increases with shape change number such that significant gain in altitude is obtained for high shape change numbers. Results demonstrated that lowest kinetic energy is obtained at maximum gain in altitude, where the vertical velocity reaches zero and the horizontal velocity has reached low values.
In addition, we performed a parametric study to highlight the influence of shape change number on the airfoil dynamics. We showed that the lowest kinetic energy level reached by the airfoil depends stochastically and asymptotically on the shape change number whether it is below or above 1 respectively. Optimal values of shape change numbers when the perching location is not constrained are found to be around 0.7 in the stochastic region and for
 $\unicode[STIX]{x1D6EF}\gg 1$
in the asymptotic region. However, high shape change numbers are accompanied by a severe gain in altitude, which may not be desirable from a practical perspective. Hence, we demonstrated that shape change numbers in the range [0.1–0.3] are conducive to a large reduction in kinetic energy with close perching locations. While these results have a small dependence on the sectional geometry and Reynolds number (at least in the range
 $10^{3}{-}10^{4}$
), they may depend on parameters like pitch-axis location (as suggested by studies on translational pitching wings), non-dimensional gravity and solid-to-fluid density ratio. Future studies are thus required to assess this dependence.
Finally, we highlighted the prominent role of leading and trailing edge vortices in obtaining large aerodynamic forces (responsible for changes in horizontal and vertical velocities) through the generation of a vortex dipole jet oriented backward and downward. The presence of these vortical structures further promotes a complex vortex dynamics that induces chaotic motions of the airfoil through highly nonlinear fluid–structure interactions. The nonlinear nature of these interactions explains the stochastic dependence of the minimum kinetic energy levels on shape change numbers lower than 1 and suggests that perching may be hardly controllable for flying vehicles, within this range of shape change numbers.
Appendix A. Comparisons with data from the literature
Further comparison with data in the literature obtained for static and pitching airfoils are provided in this appendix.
A.1 Comparisons with Kurtulus (Reference Kurtulus2015)
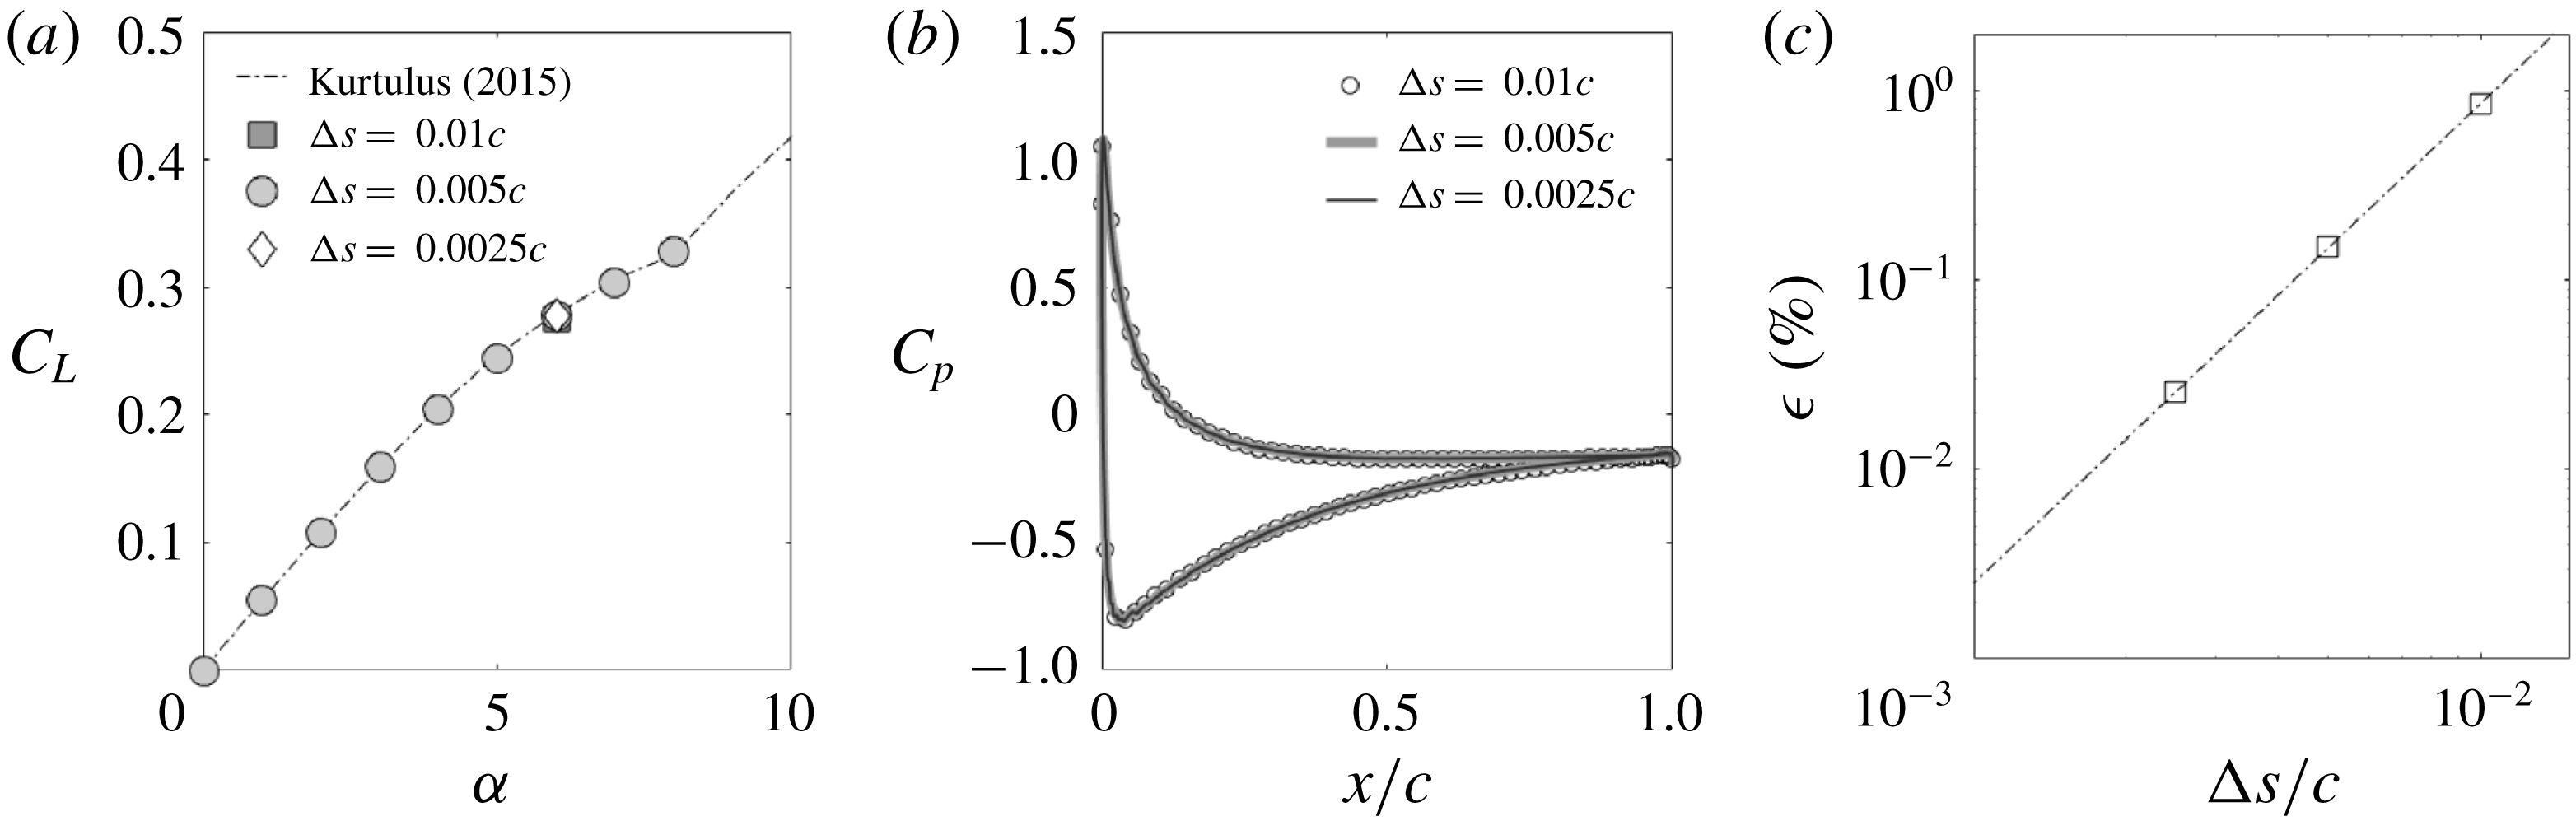
We first consider the simple case of a low angle of attack NACA0012 airfoil at Reynolds number 1000. Figure 17(a) compares the mean lift coefficient obtained for angles of attack in the range
 $\unicode[STIX]{x1D6FC}\in [0^{\circ }{-}8^{\circ }]$
with data reported in Kurtulus (Reference Kurtulus2015). Three different grid spacings are used at
 $\unicode[STIX]{x1D6FC}=6^{\circ }$
. The corresponding pressure distributions
 $C_{p}=2p/\unicode[STIX]{x1D70C}U^{2}$
along the chord are displayed in figure 17(b) (with
 $\unicode[STIX]{x1D70C}$
and
 $U$
the fluid density and velocity respectively and
 $p$
the relative static pressure on the airfoil). The corresponding percentage error with respect to the Richardson extrapolated solution is depicted in figure 17(c). These plots show very good agreement with data reported in the literature and demonstrate convergence of the data with respect to grid spacing.
Lift coefficients obtained for a low angle of attack
 $\unicode[STIX]{x1D6FC}\in [0^{\circ }{-}8^{\circ }]$
NACA0012 airfoil at Reynolds number 1000 (a). Corresponding pressure coefficients along the chord for three spatial resolutions at
 $\unicode[STIX]{x1D6FC}=6^{\circ }$
(b). Corresponding error on the drag coefficient as a function of spatial resolution at
 $\unicode[STIX]{x1D6FC}=6^{\circ }$
(c).
A.2 Comparisons with Eldredge & Wang (Reference Eldredge and Wang2010)
We then consider a flat plate undergoing a pitch-up manoeuvre about the leading edge at Reynolds number 1000. The Reynolds number is based on the wing chord and the constant free-stream velocity
 $U$
and the wing pitches up from
 $0^{\circ }$
to
 $45^{\circ }$
pitch angle following the motion defined in Eldredge & Wang (Reference Eldredge and Wang2010). The motion is parametrized using pitch rate
 $K$
, which is here set to 0.2, 0.6 and 1. Figure 18 displays the instantaneous lift coefficient
 $C_{L}$
obtained using the present numerical approach with that reported in Eldredge & Wang (Reference Eldredge and Wang2010). Note that the present flat plate is 2 % thick and has blunt leading and trailing edges, whereas that used in Eldredge & Wang (Reference Eldredge and Wang2010) is 2.3 % thick and has rounded leading and trailing edges. Again, good agreement with data reported in the literature is observed, which further validates the present numerical approach.
Instantaneous lift coefficients obtained for a flat plate undergoing a pitch-up manoeuvre at Reynolds number 1000 for various pitch rates
 $K$
. Comparison between results obtained using the present numerical approach with those reported in Eldredge & Wang (Reference Eldredge and Wang2010).

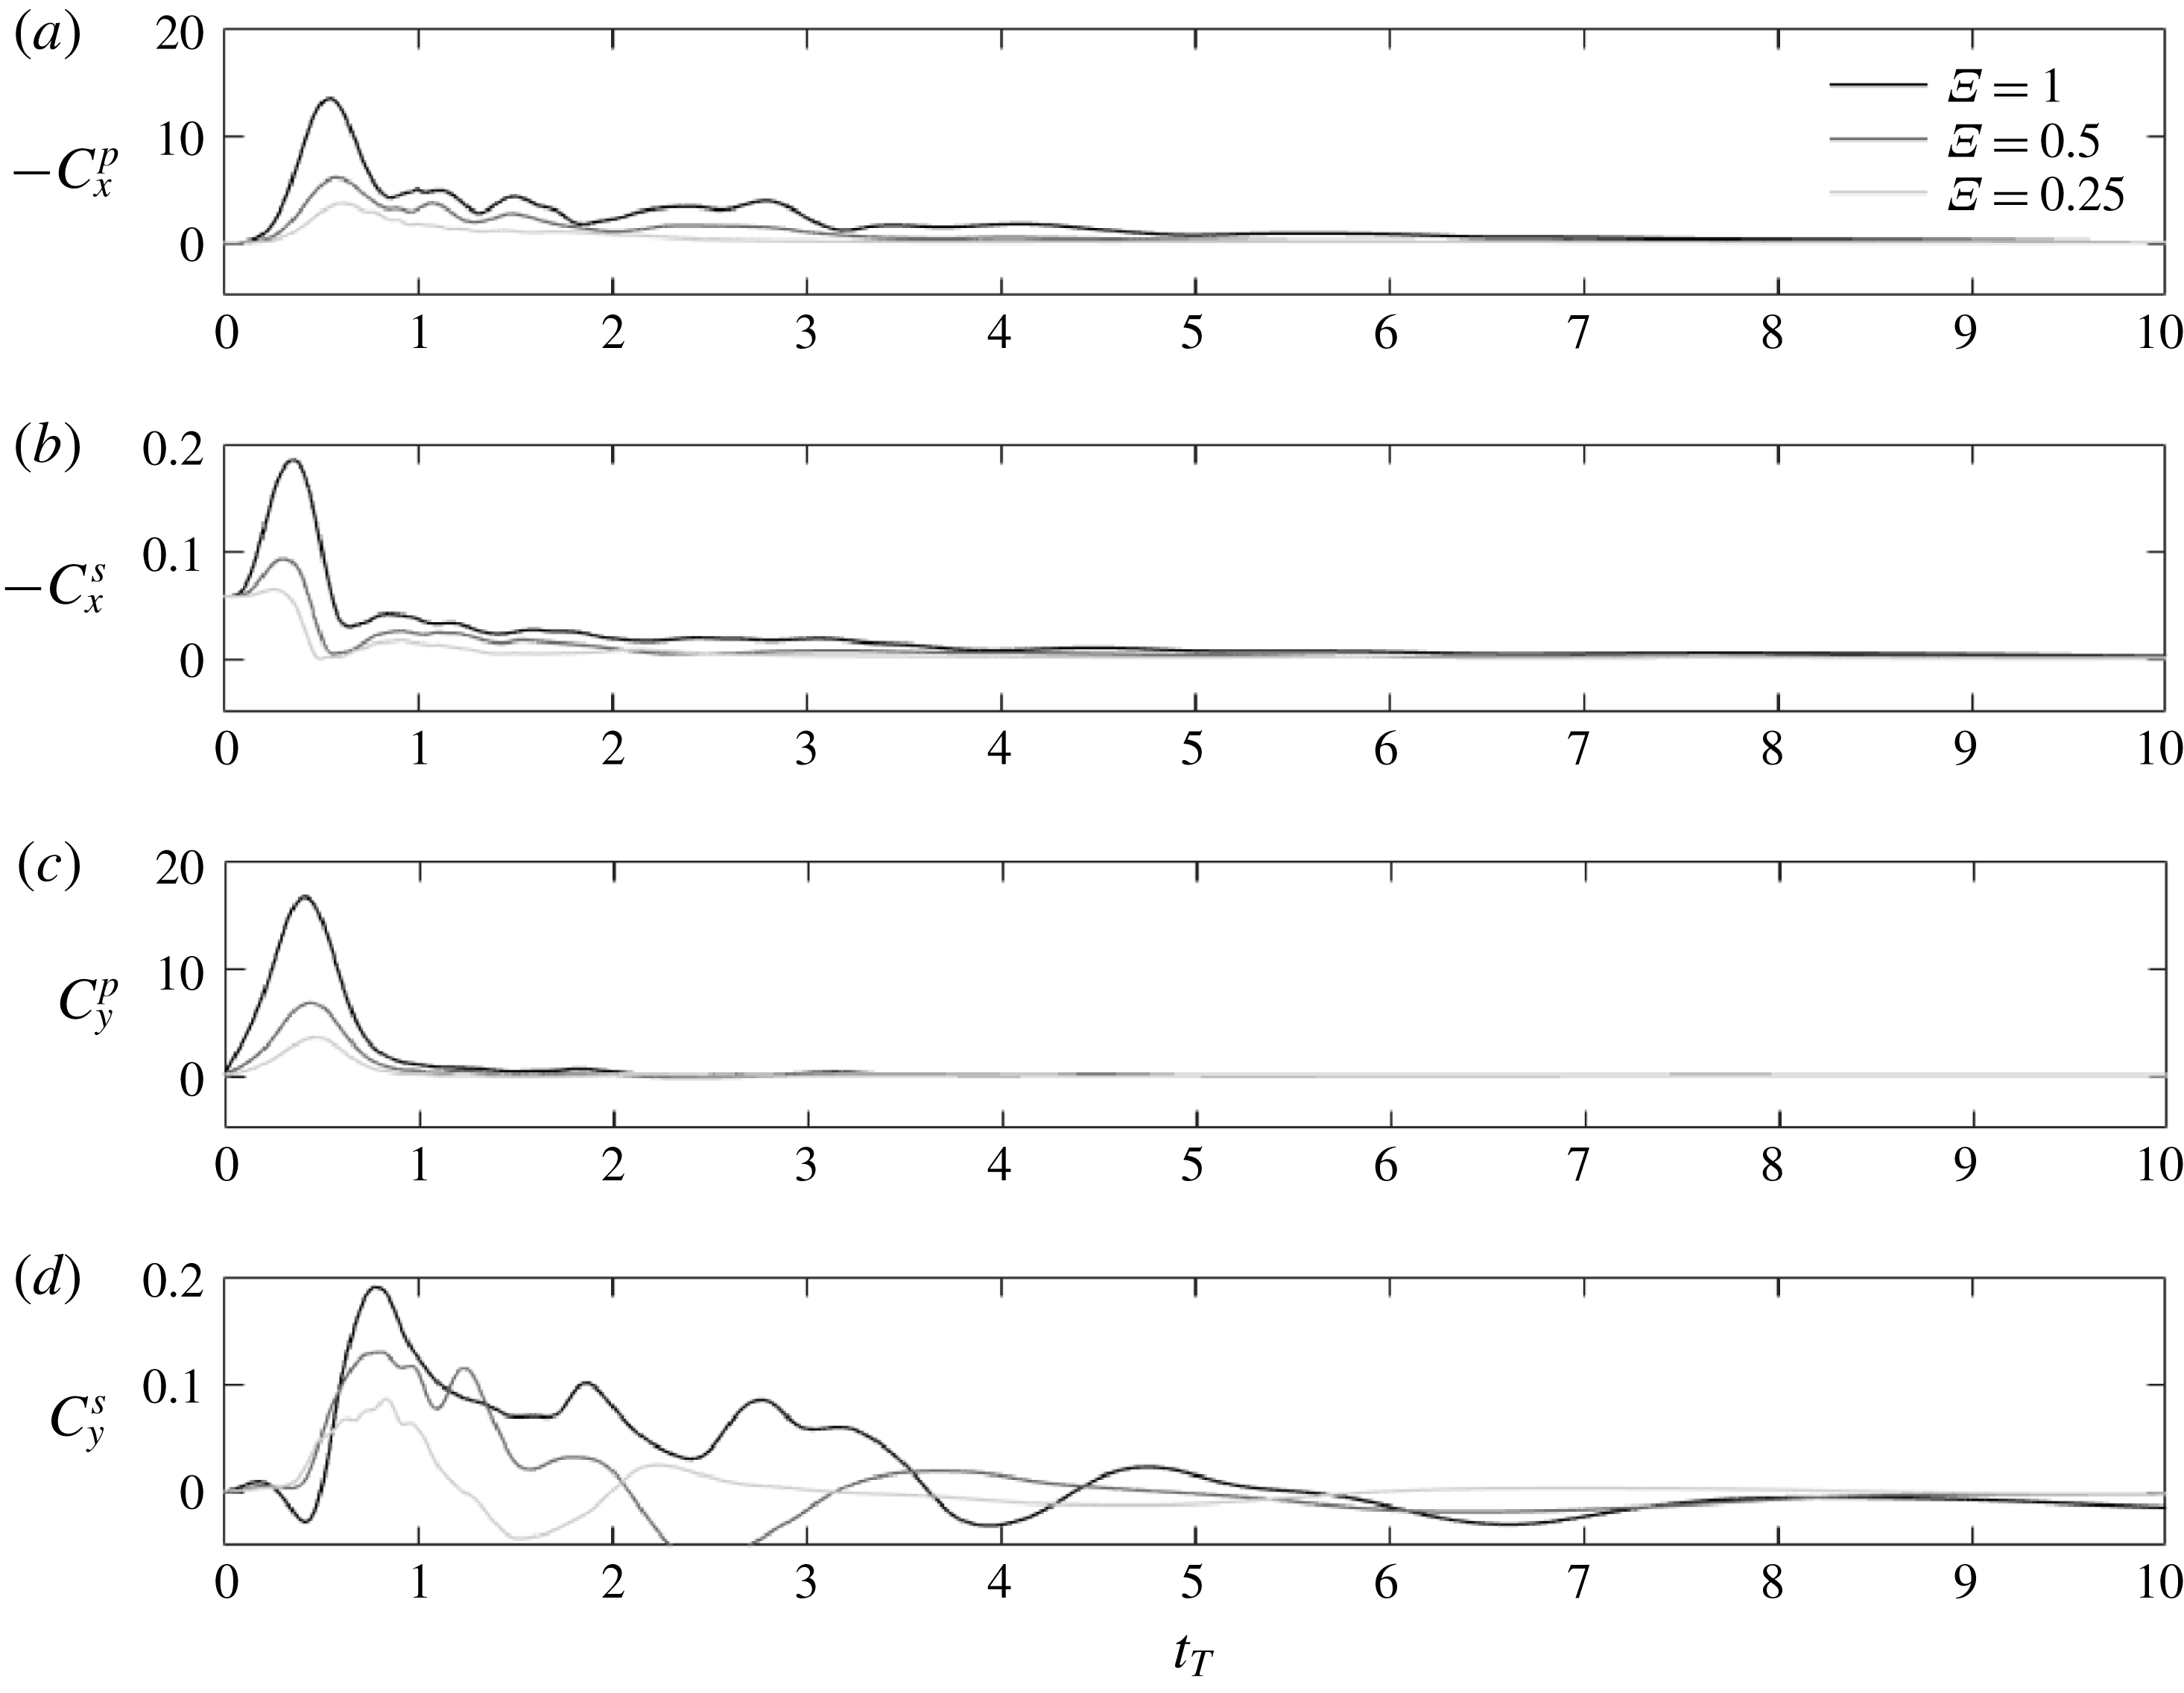
Pressure and viscous contributions to the horizontal (a and b, respectively) and vertical (c and d, respectively) force coefficients as a function of the non-dimensional time
 $t_{T}$
for three values of shape change number
 $\unicode[STIX]{x1D6EF}=1$
, 0.5 and 0.25.
Appendix B. Pressure and shear contributions to aerodynamic forces
Horizontal and vertical forces are decomposed into their pressure (
 $C_{x}^{p}$
and
 $C_{y}^{p}$
, respectively) and viscous (
 $C_{x}^{s}$
and
 $C_{y}^{s}$
, respectively) contributions and plotted in figure 19. It is shown that aerodynamic forces are dominated by their pressure contributions, which act perpendicularly to the airfoil surface. This is in line with both added mass and circulatory forces on separated airfoils acting perpendicularly to the airfoil (e.g. Granlund et al. (Reference Granlund, Ol and Bernal2013)). Because the pitch angle varies from
 $0^{\circ }$
to
 $90^{\circ }$
, pressure forces principally contribute to
 $C_{y}$
(i.e. to increasing upward velocity) during the first half of the pitch-up time, and then to
 $-C_{x}$
(i.e. decreasing horizontal velocity). This may explain the slight phase shift observed between maximum values of pressure and viscous components during the pitch-up time, and, similarly, the phase shift observed between maximum values of horizontal and vertical forces.



