



1. Introduction
Cohesive granular materials are encountered in many geophysical and industrial applications. Whereas many advances have been made in the description of cohesionless granular flows in various configurations, the behaviour of cohesive granular media has been much less investigated. One difficulty is the complexity underlying the origin of cohesion. For very small particles (typically below 10  $\mathrm {\mu }$m in diameter), the cohesion arises from attractive forces like van der Waals (Castellanos Reference Castellanos2005) or electrostatic forces (Konopka & Kosek Reference Konopka and Kosek2017), whereas for larger particles it may arise from capillary bridges (Bocquet et al. Reference Bocquet, Charlaix, Ciliberto and Crassous1998; Mitarai & Nori Reference Mitarai and Nori2006) or from solid bridges (Langlois, Quiquerez & Allemand Reference Langlois, Quiquerez and Allemand2015). In some situations, adhesive force between grains may also evolve due to variations in the environmental conditions (change of the confinement pressure, the temperature or the humidity rate) or due to the micromechanical evolution of the bonds (ageing, sintering, chemical reaction) (Kamiya et al. Reference Kamiya, Kimura, Tsukada and Naito2002; Foster, Bronlund & Paterson Reference Foster, Bronlund and Paterson2006).
This complexity in controlling cohesion explains why most of the fundamental experimental studies focus on wet granular materials, for which cohesion is controlled by the amount of liquid mixed with the grains. Different canonical configurations, such as flow in rotating drums or granular collapse, have been investigated using unsaturated wet granular media. However, capillary bridges are known to migrate and merge during flow, which adds some heterogeneities and complexity to the flow. Recently, a new model granular material has been developed, where the cohesion originates from a polyborosilicate (PBS) coating of glass particles (Gans, Pouliquen & Nicolas Reference Gans, Pouliquen and Nicolas2020). The resulting cohesive material is very stable and reusable; the adhesive force is constant in time and is simply controlled by the thickness of the coating. This material has been used, for instance, to study the erosion of a cohesive granular bed by a turbulent jet by (Sharma et al. Reference Sharma, Gong, Azadi, Gans, Gondret and Sauret2022). In this study, we investigate the dynamics of this cohesion-controlled granular material (CCGM) in the classical configuration of granular collapse.
Granular collapse, which consists of the sudden release of a granular pile under gravity (Balmforth & Kerswell Reference Balmforth and Kerswell2005; Lajeunesse, Monnier & Homsy Reference Lajeunesse, Monnier and Homsy2005; Lube et al. Reference Lube, Huppert, Sparks and Freundt2005), has been extensively studied for cohesionless granular materials and has served as a benchmark for both discrete (Staron & Hinch Reference Staron and Hinch2005; Lacaze, Phillips & Kerswell Reference Lacaze, Phillips and Kerswell2008; Kermani, Qiu & Li Reference Kermani, Qiu and Li2015) and continuum simulations (Lagrée, Staron & Popinet Reference Lagrée, Staron and Popinet2011). When the grains are released, the granular mass spreads and stops at a finite distance (Lajeunesse et al. Reference Lajeunesse, Monnier and Homsy2005). It has been shown that the morphology of the deposit is mainly controlled by the initial aspect ratio of the column, and scaling laws have been obtained for the run-out distance and the final height, which are independent of the material properties.
The problem of the collapse of a column has also been investigated in the case of a pure viscoplastic material. The different failure modes and the existence of non-deformed regions during the flow have been reported, in order to better understand how the run-out depends on the aspect ratio and yield stress (Chamberlain et al. Reference Chamberlain, Sader, Landman and White2001; Liu et al. Reference Liu, Balmforth, Hormozi and Hewitt2016).
The case of cohesive materials lies between these two extreme cases, as they exhibit both a yield stress like viscoplastic materials and friction like granular materials. Several studies have investigated the influence of cohesion on the dynamics of granular collapse. Experimentally, Mériaux & Triantafillou (Reference Mériaux and Triantafillou2008) have studied the collapse of fine powders and showed that cohesion does not modify the scaling laws of the run-out but modifies the prefactors. Artoni et al. (Reference Artoni, Santomaso, Gabrieli, Tono and Cola2013), and more recently Li et al. (Reference Li, Wang, Wu and Niu2021), have studied the collapse of wet granular media and how the dynamics depends on both the particle diameters via the Bond number and the water content. Using the discrete element method and an irreversible adhesive force model between particles to mimic solid bridges, Langlois et al. (Reference Langlois, Quiquerez and Allemand2015) have shown how fragmentation occurs during the collapse and how it decreases the run-out distance. Abramian et al. have analysed the stability criterion (Abramian, Staron & Lagrée Reference Abramian, Staron and Lagrée2020) and the roughness of the free surface (Abramian, Lagrée & Staron Reference Abramian, Lagrée and Staron2021) of the final deposit, which increases when increasing the adhesive forces between the grains.
In this paper, we revisit the problem of the collapse of a cohesive granular medium by performing experiments using the new CCGM, and by confronting the measurements to predictions from continuum simulations using a simple rheological description obtained by adding a constant cohesive stress to the  $\mu (I)$ rheology. Although the rheology of cohesive materials is known to be more complex (Badetti et al. Reference Badetti, Fall, Hautemayou, Chevoir, Aimedieu, Rodts and Roux2018; Macaulay & Rognon Reference Macaulay and Rognon2021; Mandal, Nicolas & Pouliquen Reference Mandal, Nicolas and Pouliquen2021), this approach is a first attempt to capture cohesive effects in a continuum model. After the description of the experimental procedure and the numerical methods in § 2, we focus on the stability condition in § 3, and on the failure mode of the pile in § 4, where we confront the observation to the prediction of a Mohr–Coulomb model. The role of cohesion on the dynamics of the flow, on the typical velocities and on the shape of the final deposit are discussed in § 5, before concluding in § 6.
2. Experimental and numerical methods
2.1. Experimental set-up and methods
In our experiments, the CCGM is made of glass beads of diameter  $d = 800\pm 60~\mathrm {\mu }$m coated with a PBS polymer. To tune the cohesion, we vary the average thickness
 $b$ of the coating in the range
 $0< b<400$ nm. From equation (
 $7$) in Gans et al. (Reference Gans, Pouliquen and Nicolas2020), this corresponds to a static cohesive stress
 $\tau _c$ in the range
 $0~{\rm Pa}<\tau _c< 65~{\rm Pa}$. In the following, the cohesion is characterized through the cohesion length
 $\ell _c$ defined as
 \begin{equation} \ell_c = \frac{\tau_c}{\phi \rho g}, \end{equation}
which corresponds to the characteristic length for which the hydrostatic pressure  ${P = \phi \rho g \ell _c}$ is equal to the cohesive stress
 $\tau _c$. In this paper, the particle density is
 ${\rho =2600}$ kg m
 $^{-3}$, the volume fraction is
 $\phi \approx 0.58$ and
 $g$ is the acceleration due to gravity. As a result, the range of cohesive lengths investigated in this study is
 $0 \leqslant \ell _c \leqslant 4.1$ mm.
A sketch of the experimental set-up is shown in figure 1. It consists of a rectangular channel of length  $62$ cm, width
 $15.4$ cm and height
 $31$ cm. A mass
 $M$ of cohesive grains is retained on the left side of the box by a removable gate, which can slide upwards. The rectangular channel is built with poly(methyl methacrylate) (PMMA) plates, and the bottom plate is made rough by gluing particles of the same size as the flowing particles. Since the PBS-coated particles have a very low friction coefficient with PMMA, there is no significant lift nor tangential stress observed either when opening the gate, or on the sidewalls. Different initial columns are used with a length
 $L_i$ in the range
 $2.54~{\rm cm}< L_i<12.7$ cm and a height
 $H_i$ in the range
 $1~{\rm cm} < H_i<23$ cm. As a result, the aspect ratio
 $a = H_i/L_i$ varies in the range
 $0.7< a<6.6$. At time
 $t=0$, the gate is rapidly removed vertically, and the granular mass spreads until it reaches a new static configuration at long time. The final deposit is characterized by its length
 $L_f$ and its height
 $H_f$. The granular collapse is recorded with a high-speed camera (Phantom VEO 710) at 300 frames per second. A vertical laser sheet illuminates the vertical central plane of the channel, providing a measurement of the pile profile during the flow. Using image processing software, the spatio-temporal evolution of the profile is computed, and the front velocity
 $V$ and the final deposit geometry are measured.
Sketch of the experimental set-up showing the initial granular column of length  $L_i$ and height
 $H_i$ (light grey) and the final deposit of length
 $L_f$ and height
 $H_f$ (dark grey).

2.2. Numerical methods
In parallel with the experiments, we performed numerical simulations based on the two-dimensional Navier–Stokes solver Basilisk, an open-source library (www.basilisk.fr) using an adaptive mesh and a volume-of-fluid method. The granular material is considered as an incompressible fluid, with a non-Newtonian frictional rheology. Without cohesion, it has been shown that the collapse is captured by the simple  $\mu (I)$ constitutive law (Lagrée et al. Reference Lagrée, Staron and Popinet2011). The stress tensor is given by
 $\sigma _{ij}=-P\delta _{ij}+\tau _{ij}$, where
 $P$ is the pressure and
 $\tau _{ij}$ is the deviatoric stress given by
 \begin{equation} \tau_{ij}=\mu(I) P \frac{\dot \gamma_{ij}}{|\dot \gamma|} . \end{equation}
Here  $\dot \gamma _{ij}$ is the shear-rate tensor,
 $|\dot \gamma | = \sqrt {\dot \gamma _{ij}\dot \gamma _{ij}/2}$ is its second invariant and the friction coefficient
 $\mu$ is a function of the dimensionless inertial number
 $I$,
 \begin{equation} \mu(I)=\mu_s+\frac{{\rm \Delta}\mu}{I_0/I+1}, \quad{\rm with}\quad I=\frac{|\dot{\gamma}|d}{\sqrt{P/\rho}}, \end{equation}
where  $\mu _s = 0.4$ is extracted from Gans et al. (Reference Gans, Pouliquen and Nicolas2020) and observed to be independent of
 $b$,
 ${\rm \Delta} \mu = 0.12$ and
 $I_0 = 0.3$.
In this study, where cohesion plays an important role, we extend this rheological model by adding a constant cohesive stress  $\tau _c$ so that the deviatoric stress
 $\tau _{ij}$ becomes (see Abramian et al. (Reference Abramian, Staron and Lagrée2020) for numerical details)
 \begin{equation} \tau_{ij}=[\tau_c + \mu(I)P] \frac{\dot \gamma_{ij}}{|\dot \gamma|}. \end{equation}
This expression assumes that adhesion does not modify the shear-rate-dependent frictional part of the constitutive law, which is a strong simplification. However, during collapse, the rate-dependent part of the rheology appears to play a negligible role (see the Appendix), which motivates our choice of this simple constitutive law.
In the following, when comparing the simulations to the experiments, the value of  $\tau _c$ in the numerical code is equal to its experimental value. The parameters of the friction law
 $\mu (I)$, when not specified, are chosen from a calibration based on the cohesionless case:
 $\mu _s=0.4$,
 ${\rm \Delta} \mu = 0.12$ and
 $I_0 = 0.3$. The influence of these numerical parameters is discussed in the Appendix. It should be emphasized that, in the numerical method, the plastic criterion and the existence of a yield stress are not strictly captured. A regularization method is used where a cutoff of the viscosity to a finite but high value is introduced for low values of shear rate (Abramian et al. Reference Abramian, Staron and Lagrée2020).
2.3. Control parameters
The dynamics of the cohesive granular collapse is a priori controlled by three dimensionless numbers: the aspect ratio of the initial column  $a=H_i/L_i$, the relative magnitude of the cohesion stress compared to the gravity stress given by the ratio of the cohesive length to the height of the columns
 $\ell _c / H_i$, and the number of particles in the column
 $H_i/d$. Considering the continuum model (2.4), it is easy to show that the latter parameter plays a role only in the inertial number where the particle diameter explicitly appears, i.e. in the dependence of the rheology on the shear rate. Thus, in the limit of quasi-static regimes with negligible inertial number as studied in this paper,
 $H_i/d$ is expected to play a limited role. In this regime, the system is therefore mainly controlled by only two parameters,
 $a=H_i/L_i$ and
 $\ell _c / H_i$, which are chosen to be equal in the simulation and in the experiments when confronting the experimental observation to the numerical prediction.
2.4. Qualitative observations
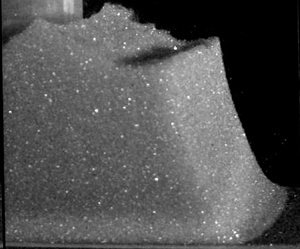
When the gate of the experimental set-up is removed, three different behaviours are observed, depending on the aspect ratio of the column and on the cohesion of the material. When the column is not high enough, it remains static, showing that a minimum height of cohesive material is required to trigger the flow (figure 2a). For a slightly higher column, the material breaks along a well-defined failure plane having its origin at the foot of the pile, leading to the collapse of the top right corner of the column (figure 2b), the rest of the pile remaining undeformed. For a sufficiently high column and/or for a sufficiently weak cohesive force between particles, the collapse starts at the right corner but extends to the bulk, leading to the spreading of the granular mass until a new static configuration is reached (figure 2c). The final deposit surface reveals a roughness reminiscent of undeformed clusters during the flows (Langlois et al. Reference Langlois, Quiquerez and Allemand2015), which increases when increasing the cohesion (Abramian et al. Reference Abramian, Staron and Lagrée2020). In particular, the upper right corner of the initial column seems to be carried by the flow without being sheared or deformed and is present in the final deposit (figure 2c). The same phenomenology is observed in simulations, as shown in figure 2.
Experimental observations (top grey pictures) and numerical simulation (bottom colour pictures) of the collapse of a cohesive granular column. (a) A stable column with small aspect ratio ( $a=0.08$,
 $\ell _c=4.1$ mm,
 $\ell _c/H_i=0.2$). (b) Partial collapse for a moderate aspect ratio (
 $a=0.43$,
 $\ell _c=4.1$ mm,
 $\ell _c/H_i=0.08$) with a well-defined slip plane. (c) Collapse of the column (
 $a=1.9$,
 $\ell _c=2.8$ mm,
 $\ell _c/H_i=0.025$), where we observe a ‘surfing wedge’ coming from the top right corner being transported during the flow. The white scale bar corresponds to 4 cm in panels (a) and (b), and to 10 cm in panel (c).

However, the origin of the free-surface roughness in the continuous simulations remains unclear and would require a specific study. We observed that the irregularities depend on the mesh size, suggesting that their development might be related to the ill-posed behaviour of the  $\mu (I)$ rheology (Barker et al. Reference Barker, Schaeffer, Bohórquez and Gray2015). However, we verified that the dynamics studied in the sequel are independent of mesh size, and calculations were performed with a typical mesh size of
 $5.86 \times 10^{-3}$ (52
 $\mathrm {\mu }$m) in the column.
3. Column stability
To interpret the initiation of the flow and the failures observed in both experiments and simulations, we express the stability condition of a granular column in the framework of a simple cohesive Mohr–Coulomb model.
3.1. Theoretical failure conditions
The failure of hills has been the subject of many studies in the soil mechanics literature (Fredlund & Krahn Reference Fredlund and Krahn1977; Halsey & Levine Reference Halsey and Levine1998; Chen, Yin & Lee Reference Chen, Yin and Lee2003; Duncan, Wright & Brandon Reference Duncan, Wright and Brandon2014). Here, we restrict our analysis to the simple assumption that failure occurs along a straight plane, following the work of Restagno, Bocquet & Charlaix (Reference Restagno, Bocquet and Charlaix2004). The three different configurations depicted in figure 3 are analysed: an infinitely wide rectangular pile, a truncated wide pile and a rectangular pile of finite width.
Theoretical analysis of the stability of columns using a cohesive Mohr–Coulomb criterion. (a) Wide column: the corner delimited by the plane inclined at an angle  $\alpha$ is stable when the cohesion level
 $\ell _c/H_i$ is above the black curve
 $f_{\theta _c}(\alpha )$ in (3.3). The blue line corresponds to a cohesion level leading to stable column, the red line to a marginally stable column where a single angle
 $\alpha _m=\theta _c/2+{\rm \pi} /4$ is unstable, and the green line to an unstable column. The grey area corresponds to the unstable angles. (b) Truncated pile: the different curves correspond to the stability function
 $f_{\theta _c,\theta _m}(\alpha )$ in (3.5) for different values of the free-surface inclination
 $\theta _m$ (i.e.
 $\theta _m^1=50^{\circ }$,
 $\theta _m^2=71.4^{\circ }$,
 $\theta _m^3=80^{\circ }$). The dashed line is the function
 $({\ell _c}/{H_i})_{crit}(\theta _m)$ in (3.6) above which the truncated pile is stable. (c) Tall column: the stability curves for various aspect ratios
 $a$ given by
 $f_{\theta _c,a}(\alpha )$ in (3.8) for
 $\alpha < \arctan a$ and by
 $f_{\theta _c}(\alpha )$ in (3.3) for
 $\alpha > \arctan a$.

3.1.1. Rectangular pile with a small aspect ratio
We first consider a cohesive rectangular column of height  $H_i$ and width
 $L_i\gg H_i$. A corner delimited by the slip plane having its origin at the bottom right base and inclined at an angle
 $\alpha$ from the horizontal (figure 3a) is stable according to a cohesive Mohr–Coulomb criterion if the following condition is satisfied:
 \begin{equation} Mg\sin{\alpha} \leq S \tau_c + \mu_s M g\cos{\alpha}, \end{equation}
where  $M$ is the mass of material above the slip plane,
 $S$ is the area of the failure surface,
 $\mu _s$ is the static friction angle and
 ${\tau _c}$ is the cohesive stress. In the configuration of figure 3(a), we can write
 $M = \rho W {H_i}^2 / (2\tan {\alpha })$ and
 $S = W H_i /{\sin {\alpha }}$, where
 $W$ is the thickness of the pile. The pile is then stable when
 \begin{equation} \frac{\rho g H_i}{2 \tan \alpha}\sin{\alpha}\, (\sin{\alpha} - \mu_s \cos{\alpha}) \leq \tau_c , \end{equation}
which can be expressed using the cohesive length  $\ell _c$ and the friction angle
 $\theta _c=\arctan (\mu _s)$,
 \begin{equation} f_{\theta_c}(\alpha) = \frac{\cos{\alpha} \sin(\alpha - \theta_c)} {2 \cos{\theta_c}} \leq \frac{\ell_c}{H_i}. \end{equation}
The function  $f_{\theta _c}(\alpha )$ is shown in figure 3(a) for
 $\mu _s=0.4$ corresponding to
 $\theta _c=21.8^{\circ }$. This function is a symmetric curve centred at
 $\alpha _m=\theta _c/2 + {\rm \pi}/4$, where it reaches its maximum value
 $f_{\theta _c}(\alpha _m)\approx 0.17$, and becomes zero for
 $\alpha =\theta _c$ and
 $\alpha ={\rm \pi} /2$. In this plot, a point (
 $\alpha,{\ell _c}/{H_i}$) below the curve corresponds to an unstable corner. A high cohesion level
 $\ell _c/H_i> 0.17$ corresponds to a stable pile (blue line) for which the stability criterion (3.3) is fulfilled whatever the slip angle
 $\alpha$. The value
 $\ell _c/H_i=0.17$ corresponds to the marginally stable pile, which will break along the slip plane inclined at
 $\alpha _m$ (red line). A low cohesion level
 $\ell _c/H_i< 0.17$ (green line) corresponds to an unstable column that may fail at any angle for which
 $f_{\theta _c}(\alpha ) > \ell _c/H_i$ (grey zone in figure 3a).
3.1.2. Truncated pile
The previous analysis can be generalized to the case of a truncated pile, with a missing corner inclined at an angle  $\theta _m$ (figure 3b). Studying this geometry is interesting, as it may provide information about the stable final deposit shape. By evaluating the mass of material
 $M$ located between the slip plane inclined at an angle
 $\alpha$ and the free surface inclined at an angle
 $\theta _m$, one can derive the following expression for the stability criterion:
 \begin{equation} \frac{1}{2}\rho g H_i \left(\frac{1}{\tan \alpha} - \frac{1}{\tan \theta_m} \right) \sin{\alpha}\, ( \sin{\alpha} - \mu \cos{\alpha} ) \leq \tau_c. \end{equation}
Again using  $\ell _c$ and
 $\theta _c$, this equation may be rewritten as
 \begin{equation} f_{\theta_c,\theta_m}(\alpha) = \frac{\sin(\theta_m- \alpha)\sin(\alpha - \theta_c)}{2 \cos{\theta_c} \sin{\theta_m}} \leq \frac{\ell_c}{H_i} . \end{equation}
The different stability limits in the plane  $\alpha$ versus
 $\ell _c/H_i$ for different truncated angles
 $\theta _m$ are plotted in figure 3(b). The graphs of the function
 $f_{\theta _c,\theta _m}(\alpha )$ are curves centred at
 $(\theta _c + \theta _m)/2$ and vanishing at
 $\alpha =\theta _c$ and
 $\alpha =\theta _m$. The rectangular pile is recovered for
 $\theta _m={\rm \pi} /2$. The maximum of the
 $f_{\theta _c,\theta _m}(\alpha )$ gives the value of the critical cohesion level
 $(\ell _c/H_i)_{crit}(\theta _m)$ below which the pile truncated at angle
 $\theta _m$ is unstable, given by the following equation:
 \begin{equation} \left(\frac{\ell_c}{H_i}\right)_{crit}(\theta_m)= \frac{1 - \cos(\theta_m- \theta_c)}{4 \cos{\theta_c} \sin{\theta_m}} . \end{equation}
This function  $(\ell _c/H_i)_{crit}(\theta _m)$ is plotted in figure 3(b) as the black dashed line. A pile truncated at an angle
 $\theta _m$ and for a cohesion level
 $\ell _c/H_i$ such that the point (
 $\theta _m, \ell _c/H_i$) is below this line, is unstable.
3.1.3. Rectangular pile with a large aspect ratio
The last case of interest is the case when the aspect ratio of the pile is large and such that the slip plane no longer intersects the top free surface but the left side of the pile, i.e. when  $\arctan {a} \geq \alpha$ (figure 3c). In this case,
 $M=\rho W L_i(H_i - \frac {1}{2}L_i\tan \alpha )$ and
 $S=W L_i/\cos \alpha$, and the stability criterion of the column is given by
 \begin{equation} \rho g \left( H_i - \frac{L_i \tan{\alpha}}{2} \right) \cos{\alpha} \, (\sin{\alpha} - \mu_s \cos{\alpha}) \leq \tau_c , \end{equation}
which can be written as
 \begin{equation} f_{\theta_c,a} (\alpha) = \left( 1 - \frac{1}{a}\frac{ \tan{\alpha}}{2} \right) \cos^2{\alpha} \, (\tan{\alpha} - \tan{\theta_c}) \leq \frac{\ell_c}{H_i} . \end{equation}
The stability criterion in this case depends on the aspect ratio  $a$ and is given by the function
 $f_{\theta _c,a}(\alpha )$, which is plotted as curves starting at
 $(\alpha =\theta _c, 0)$ and presenting a maximum. This maximum increases when increasing the aspect ratio. When the slip angle
 $\alpha$ reaches the
 $\arctan {a}$ value, i.e. the slip plane no longer reach the left vertical side of the column, the stability criterion is no longer given by the
 $f_{\theta _c,a}(\alpha )$ function but by the low-aspect-ratio function
 $f_{\theta _c}(\alpha )$ in (3.3). For a given aspect ratio
 $a$, the stability of the column is thus given by a curve made of two parts, as shown in figure 3(c), its absolute maximum giving the critical cohesion level below which the pile is unstable. At low aspect ratio, the first part of the curve (colour curves in figure 3c) is lower than the second part (black curve), and the stability is controlled by a constant cohesion level, independent of
 $a$. When
 $a$ becomes greater than 1.145 (black dashed line in figure 3c), the maximum is given by the first maximum corresponding to a mode of failure crossing the pile from one side to another. A stability limit can then be plotted in the
 $(a, \ell _c/H_i)$ plane, as shown by the black curve in figure 4, separating the stable region (blue) from the region where collapse occurs (pink). The discontinuity between the two geometrical possibilities of failure occurs at
 $a\approx 1.145$.
Stability diagram in the aspect ratio  $a$ versus cohesion level
 $\ell _c/H_i$ plane for a cohesive granular column. The black curve is the limit of stability. Circles corresponds to experiments, squares to simulation and blue (red) symbols correspond to stable (unstable) columns.

In conclusion, three stability criteria have been derived, depending on the aspect ratio of the rectangular column, or if the pile is truncated with an angle  $\theta _m$. In the next section, we test the stability criteria using experimental observations and numerical simulations.
3.2. Experimental and numerical observations
We first investigated experimentally the condition for a collapse of the pile after the opening of the gate. Numerous experiments were done, varying both the aspect ratio  $a$ and the cohesive strength
 $\ell _c/H_i$. The results are plotted in figure 4 as circles, with the following colour code: red indicates that a collapse occurs, and blue indicates that the column remains stable. Experimentally, we were not able to investigate the high-aspect-ratio and large
 $\ell _c/H_i$ limit, as, for the range of
 $\ell _c$ accessible with our beads, it would correspond to narrow piles with only few particles in the width.
We can further explore this diagram using numerical simulations. Stable and unstable columns are discriminated by using two criteria: the column is stable either if its final run-out does not exceed 1 % of the initial length, or if the maximum viscosity is reached everywhere in the early stage of the collapse. Overall, these two criteria lead to the same results. The numerical results are data taken from Abramian et al. (Reference Abramian, Staron and Lagrée2020) and data from new computations. The results are plotted figure 4 as squares, with the same colour code as for the circles.
Finally, both experimental and numerical results show a good agreement with the Mohr–Coulomb stability criterion, showing that the limit of stability of a cohesive granular pile is well captured by a simple Mohr–Coulomb model.
4. Collapse angles
The above theoretical stability analysis predicts whether a column of aspect ratio  $a$ and cohesion level
 $\ell _c/H_i$ between grains is stable or unstable (solid line in figure 4). It also provides an estimate of the failure angles
 $\alpha$ or a range of possible failure angles, which is the scope of the present section.
If the failure angle  $\alpha _m=\theta _c/2+{\rm \pi} /4$ is well predicted at the stability threshold (when
 $\ell _c/H_i=(\ell _c/H_i)_{crit}({\rm \pi} /2)$), the theoretical analysis does not predict the angle for lower cohesion or larger column, i.e. when the collapse occurs far from the stability threshold. Instead, the analysis predicts a whole range of unstable angles (grey area, figure 3a). To investigate this range and understand how the column breaks, in this section we focus on two characteristic angles: we identify the initial angle of failure
 $\alpha _i$ at the onset of collapse, and a final angle
 $\alpha _f$ at the end of collapse, defined as the angle of the plane below which no grain has moved during the entire collapse time (see the inset in figure 5).
Measurements of the initial failure angle  $\alpha _i$ (open circles) and final angle of stability
 $\alpha _f$ (filled dots) for different cohesion levels
 $\ell _c/H_i$. Red symbols are from numerical simulations, and blue symbols are from experiments. The continuous line is given by (3.3). The dashed line corresponds to (3.6), giving the limit of stability of truncated piles.

These two different angles have been measured in both the experiments and numerical simulations. Experimentally, to determine  $\alpha _i$, we compare a reference image of the static column with the subsequent images at the onset of the flow using an image subtraction process enhanced with a threshold filter. Numerically, we threshold the velocity field at the initiation of the flow. The angle
 $\alpha _f$ is experimentally measured through an image difference process between the initial reference image and the images recorded at the end of the collapse, and numerically by thresholding the integral of the velocity field during the whole dynamics. The experimental and numerical results are reported in figure 5, where we restrict the analysis to the small-aspect-ratio configuration (figure 3a).
The initial failure angle  $\alpha _i$ measured in the simulations (open red circles) is constant whatever the parameters, and is always close to the critical angle
 $\alpha _m=\theta _c/2 + {\rm \pi}/4\approx 55^{\circ }$ predicted by the Mohr–Coulomb theory for the incipient failure mode. For low cohesion, the final failure angle
 $\alpha _f$ (red dots), delimiting the region where grains never move during the collapse, is lower than
 $\alpha _i$, because the grains are entrained by the flow. This corresponds to a friction-dominated regime. For higher cohesion, the final failure angle approaches
 $\alpha _i$ until the two are equal: this is a cohesion-dominated regime. Here, only the first unstable corner flows while the rest of the pile remains static, as illustrated in figure 2(b). The transition between the two regimes occurs for
 $\ell _c/H_i\sim 0.08$.
The observation is slightly different in experiments. Although we identify the two regimes, the initial failure angle (blue open circles) is not constant whatever the cohesion level. It is close to the critical angle  $\alpha _m$ at low cohesion, but the experimental
 $\alpha _i$ increases when increasing the cohesion and becomes larger than what is predicted in the simulation. Interestingly, in experiments,
 $\alpha _f$ is close to the critical curve computed theoretically for the stability of truncated piles ((3.6), dashed line in figure 5), meaning that the final shape of the column is close to the marginally stable shape. We assume that
 $\alpha _f$ compares with
 $\theta _m$ of (3.6) since it represents the lower bound of stability despite the flow above it. The discrepancy between simulations and experiments for high cohesion levels may have different origins. A first origin could be that, in the experiment, the gate is not instantaneously removed. The time needed to open the door might induce a stress relaxation at the early stage of the collapse, which is not present in the numerical simulations, where the stresses are instantaneously released. Another source of discrepancy could be that the constitutive law chosen in the simulation is too simple, and other effects, such as normal stress differences, transient effects and/or dilatancy effects, are missing.
5. Collapse dynamics, run-out length and final deposit
5.1. Velocity of the front
Once the gate is removed, the column collapses and a granular front propagates. The profile of the pile during the collapse can be extracted in experiments from the high-speed movie and the laser sheet projection. A typical run is presented in figure 6 showing both the experimental and numerical results for the same parameters for a weakly cohesive material (aspect ratio  $a=1$,
 $\ell _c/H_i=0.0314$). Using the same parameters in simulation (cf. § 2.2), we find a fairly good agreement between the experiments and the numerical predictions for the dynamics of the pile profile during the collapse. The dynamics of the front and its position
 $L(t)$ can be determined by measuring the location
 $L(t)$ of the foot of the pile in both experiments and simulations. The experimental results
 $L(t)-L_i$ are plotted as solid lines in figure 7(a), for
 $\ell _c=0$ (cohesionless material),
 $\ell _c=2.8$ mm and
 $\ell _c=3.6$ mm, for an aspect ratio
 $a=1$. As a comparison, numerical simulations with the same cohesion levels and the same aspect ratio are plotted with dashed lines. We observe that, after a short acceleration step, the front travels at a constant velocity before decelerating and eventually reaching a static position. The comparison between the experimental and numerical results shows a good agreement from the beginning to the end of the steady state. The agreement is very good for the cohesionless granular experiment (light blue curves), showing that the granular collapse is well described by the continuous numerical code with the
 $\mu (I)$ rheology. However, in the case of cohesive materials, a difference is observed between experiments and simulation when the flow slows down and stops. The final run-out length is systematically shorter in the numerical simulations for cohesive materials compared to the experiments, as can also be observed in figure 6.
Comparison between the numerical (black) and experimental (blue) profiles of the granular pile at different times for  $H_i = 8.9$ cm,
 $a = 1$ and
 $\ell _c = 2.8$ mm.

(a) Time evolution of the front position for different cohesion levels in experiments (continuous curves) and simulations (dashed curves) for an aspect ratio  $a=1$. Inset: results for
 $a =0.5$ showing the existence of a significant delay in the experiments before the collapse occurs for the most cohesive material (dark blue,
 $\ell _c = 3.6$ mm). (b) Velocity of the front
 $V$ as a function of the aspect ratio
 $a$ for different cohesion levels. The colour code is the same as in panel (a).

Another discrepancy is observed at lower aspect ratio ( $a=0.5$), close to the stability limit (inset of figure 7(a) for a smaller aspect ratio and
 $\ell _c=3.6\,{\rm mm}$), for which the experiments reveal a delay between the opening of the gate and the initiation of the flow. This delay is not observed in the simulation, and may be reminiscent of more complex rheological features induced by the thick polymer coating, leading to some creeping phenomena not taken into account in the simple rheological model used in the simulation.
Despite this discrepancy, the velocity  $V_{max}$ of the front is quantitatively predicted by the simulation, as shown in figure 7(b). The velocity
 $V_{max}$ is defined as the velocity at the inflection point in the
 $L(t)-L_i$ curves of figure 7(a). The velocity increases with the aspect ratio up to a plateau when
 $a\approx 3$. The graph also shows that the velocity decreases when the cohesion increases.
5.2. Run-out and final deposit
Once the kinetic energy of the collapse is fully dissipated, we measure the final deposit and focus on the final run-out length,  $L_f=L_i + {\rm \Delta} L$. As shown by Lajeunesse et al. (Reference Lajeunesse, Monnier and Homsy2005), the run-out length and the final height of a cohesionless granular material scale as power laws of the aspect ratio
 $a$:
 \begin{equation} \frac{{\rm \Delta} L}{L_i} \propto \left\{\begin{array}{@{}ll@{}} a & \mbox{for } a \leq 3, \\ a^{2/3} & \mbox{for } a \geq 3, \end{array}\right.\quad \mathrm{and}\quad \frac{H_f}{L_i} \propto \left\{\begin{array}{@{}ll@{}} a & \mbox{for } a \leq 0.7, \\ a^{1/3} & \mbox{for } a \geq 0.7. \end{array}\right. \end{equation}
The results for  $L_f$ and
 $H_f$ obtained with cohesionless and cohesive materials are plotted in figures 8(a) and 8(b), respectively, where filled symbols are experimental results and open symbols are numerical results. The run-out length
 $L_f$ decreases when increasing the cohesion, but the final height
 $H_f$ remains constant. However, the power laws (5.1a,b) seem unchanged compared to the cohesionless case, as seen by the
 $a^1$ and
 $a^{2/3}$ slopes on the graph, although the range of aspect ratio investigated is too narrow to conclude firmly on the scalings. These results are in agreement with previous observations for powders (Mériaux & Triantafillou Reference Mériaux and Triantafillou2008), showing that cohesion only changes the prefactor on the run-out length (5.1a,b), without changing the exponent on the aspect ratio. Unfortunately, understanding this prefactor analytically is not trivial, and is out of the scope of the present paper.
(a) Normalized run-out length  ${\rm \Delta} L/L_i$ as a function of the aspect ratio
 $a$ for different cohesion levels for both experiments and simulations. (b) Normalized height of final deposit
 $H_f/H_i$ as a function of the aspect ratio
 $a$.

As discussed previously, the simulations for the cohesive material systematically underestimate the final run-out compared to the experiments. Looking more precisely at the morphology of the free surface at the end of the flow reveals that the discrepancy is localized at the tip of the deposit. The no-slip boundary condition applied in the simulation at the contact line may be a source of additional dissipation explaining the difference between simulation and experiments. We show in the Appendix that, by adjusting the parameters of the rheological model,  $\mu _s$,
 ${\rm \Delta} \mu$ and
 $I_0$, the run-out can be adjusted, but we found no set of parameters able to predict both cohesionless and cohesive systems.
6. Discussion and conclusion
In this paper, we studied the dynamics of the collapse of a column of cohesive granular material both experimentally, using a CCGM made of polymer-coated particles, and numerically, using a continuous approach based on a cohesive viscoplastic rheology.
The first effect of cohesion is the stabilization of the granular column with a stability criterion that depends on the aspect ratio and the cohesion level. A stability criterion and an angle of failure have been measured and compared with a simple theoretical approach based on a Mohr–Coulomb stability criterion assuming a planar slip line. It would be interesting in future work to go beyond this approximation, and analyse more precisely the mode of failure of the column, in the spirit of studies done to understand the collapse of a column of Bingham material (Chamberlain et al. Reference Chamberlain, Sader, Landman and White2001; Liu et al. Reference Liu, Balmforth, Hormozi and Hewitt2016). How the presence of both a plastic yield stress and a frictional stress changes the slip lines is an open question.
A second effect of cohesion is the increase of the dissipation during the flow, leading to a slower spreading of the material and a shorter run-out length. A striking effect of the cohesion on the collapse of the granular column is the presence of a ‘surfing wedge’ on the top corner of the column. It acts as a dead volume transported passively by the granular flow underneath.
The comparison of the results (stability of the column, run-out length, collapse velocity) between the experiments and the continuous numerical simulation reveals a relatively good agreement, despite some discrepancies. This shows that the main features of the cohesive granular collapse are captured by simply adding a constant cohesive yield stress to the cohesionless granular rheological model. Differences between experiments and simulations were observed for large cohesion levels, for which the initial failure angle is higher in experiments than in simulation, the run-out is underestimated in the simulation, and a delay before collapse is observed in experiments and not captured in simulations. These differences may come from an oversimplified description of the rheological properties of the cohesive granular material. Additional studies with other configurations more sensitive to rheological details than column collapse would be interesting to further investigate the rheological properties of the material.
Funding
This research was supported by Agence Nationale de la Recherche through the grant NR-17-CE08-0017 under the COPRINT (Cohesive Powders Rheology: Innovative Tools) project.
Declaration of interests
The authors report no conflict of interest.
Author contributions
A.G., M.G. and A.S. performed the experiments; A.G., A.A. and P.-Y.L. performed the numerical simulations; all authors contributed equally to analysing data and reaching conclusions, and in writing the paper.
Appendix. Effect of the rheological parameters
The rheological model implemented in the numerical simulations is set by three arbitrary parameters: the static friction coefficient  $\mu _s$, the friction coefficient difference
 ${\rm \Delta} \mu$, and the inertial number constant
 $I_0$ (see (2.3)). In this model, we assume that cohesion does not change these parameters. However, since the run-out length and the final morphology are not well captured by the model, a deeper investigation is needed. The effect of the difference of the friction coefficients
 ${\rm \Delta} \mu$ is presented in figure 9(a). The distance of the front
 $L(t)$ is plotted as a function of time for a column of cohesion
 $\ell _c = 2.8$ mm and an aspect ratio
 $a=1$. The green area is obtained by changing the value of
 ${\rm \Delta} \mu$ from 0 to 0.2. Figure 9(b) shows the associated final profile for different values of
 ${\rm \Delta} \mu$. We observe that an increase of
 ${\rm \Delta} \mu$ leads to a decrease of the run-out length. Consequently, changing the value of
 ${\rm \Delta} \mu$ allows adjusting the final run-out of the cohesive collapse with only a small change in the velocity of the collapse.
(a) Experimental and numerical front position  $L(t)$ of the collapse for
 $\ell _c= 2.8$ mm,
 $I_0 = 0.1$ and
 $a = 1$. The green area is obtained by varying the parameter
 ${\rm \Delta} \mu$ from 0 to 0.2, and the green line is the best agreement for the velocity and the run-out. (b) Final profiles for three values of
 ${\rm \Delta} \mu$.

The effect of  $I_0$ is plotted in figure 10(a) and the associated run-out profile is plotted in figure 10(b) for the configuration described above, and a chosen
 ${\rm \Delta} \mu = 0.1$. We see that changing the value of
 $I_0$ barely changes the dynamics and the final profile of the run-out. Therefore, if the cohesion has an impact on this parameter, we do not expect a major effect.
(a) Numerical front position  $L(t)$ of the collapse for
 $\ell _c= 2.8$ mm,
 ${\rm \Delta} \mu = 0.1$ and
 $a = 1$. The green area is obtained by varying the parameter
 $I_0$ from 0.001 to 0.2, and the green line is the best agreement for the velocity and the run-out. (b) Final profiles for three values of
 $I_0$.

The last parameter we investigate is the static friction coefficient  $\mu _s$. While this parameter has been measured experimentally in a previous study, using inclined-plane experiments (Gans et al. Reference Gans, Pouliquen and Nicolas2020), the measurement method was rather different from this set-up. However, after the initiation of the flow, one may suggest that the PBS coating could act like a lubricant, which could decrease the effective
 $\mu _s$ during the flow. An investigation of the effect of the rheological parameter
 $\mu _s$ is presented in figure 11. The distance of the front is plotted as a function of the time for an experiment of aspect ratio
 $a = 1$ and two different simulations with
 $\mu _s=0.4$ and
 $\mu _s=0.25$. We see that a decrease of
 $\mu _s$ leads to an increase of the velocity and of the run-out length.
Experimental and numerical front position  $L(t)$ of the collapse for
 $\ell _c= 2.8$ mm,
 ${\rm \Delta} \mu = 0.12$,
 $I_0 = 0.3$ and
 $a = 1$.

With this parametric study, we see that a change of  ${\rm \Delta} \mu$ and
 $\mu _s$ may have a significant impact on the dynamics of the collapse, and it may be possible to define an optimal set
 $(\mu _s, {\rm \Delta} \mu )$ to fit the experiments. Since, in the experiments, the PBS coating might change the frictional properties during the flow, we do not know if the apparent effect on
 $\mu _s$ and
 ${\rm \Delta} \mu$ is due to cohesion or not. These results suggest that a deeper investigation of the rheology of the CCGM is needed to fully understand its dynamical behaviour.



