


Kaolin-group minerals (KGMs) are among the most ubiquitous clay minerals found on Earth. Moreover, they are the only known minerals possessing a dioctahedral 1:1 phyllosilicate structure, and their chemical composition exhibits remarkably limited variability (Wilson, Reference Wilson2013). Nevertheless, the X-ray diffraction (XRD) patterns obtained from KGMs often display diverse features depending on the sample, which are primarily attributed to the type and density of stacking faults formed in the stacking of the dioctahedral 1:1 layer (Giese, Reference Giese and Bailey1988). In general, stacking faults or stacking disorder in phyllosilicates are closely related to the interlayer configurations that define their polytypes or are primarily caused by the intermixing of different polytypes at the monolayer level (Baronnet, Reference Baronnet and Buseck1992).
‘Standard polytypes’ (Bailey, Reference Bailey1969) of trioctahedral 1:1 phyllosilicates number 12, whereas those of dioctahedral 1:1 phyllosilicates can theoretically reach 36 (Zvyagin, Reference Zvyagin1967; Bailey, Reference Bailey1969, Reference Bailey and Bailey1988). However, only three standard polytypes (kaolinite, dickite and nacrite) have been identified as naturally occurring dioctahedral 1:1 phyllosilicates with platy KGMs. These polytypes can be divided into four groups defined by Bailey (Reference Bailey and Bailey1988), designated as Groups A, B, C and D, assuming that we do not consider the variation due to n × 120° rotation between adjacent layers. They are characterized by ±ai/3 shifts for Group A, ±ai/3 shifts with 180° rotation for Group B, ±b/3 or no shift for Group C and ±b/3 or no shift with 180° rotation for Group D between adjacent layers, where ai and b correspond to the edges of hexagonal and C-centred orthohexagonal unit cells, respectively. Each group exhibits a distinct interlayer structure and is expected to have different stability or formation conditions. Consequently, whether interlayer structures of different polytypic groups can coexist within a single crystal as stacking faults or irregularities remains an unresolved question.
High-resolution transmission electron microscopy (HRTEM) is considered the most effective method for unambiguously characterizing such stacking defects. For instance, Kogure et al. (Reference Kogure, Hybler and Ďurovič2001), using HRTEM images taken along the Yi direction as defined by Bailey (Reference Bailey and Bailey1988), demonstrated that a sample of cronstedtite (a trioctahedral 1:1 phyllosilicate rich in iron), predominantly belonging to Group C, contained stacking faults attributable to Group A. This was the first direct evidence of the coexistence of stacking structures of different polytypic groups within a single 1:1 phyllosilicate crystal. Furthermore, Kogure et al. (Reference Kogure, Hybler and Yoshida2002) revealed that the two polytypic groups present within a single cronstedtite crystal differed in their chemical compositions. In the case of KGMs, kaolinite and dickite belong to Group A and nacrite is classified into Group D, and their interlayer structures differ substantially. The possibility of these two groups coexisting within a single kaolin crystal has been a subject of ongoing debate. Ruiz Cruz (Reference Ruiz Cruz1996), based on infrared (IR) spectroscopy and differential thermal analysis (DTA) data, suggested the potential existence of mixed structures comprising dickite and nacrite. Similarly, Johnston et al. (Reference Johnston, Kogel, Bish, Kogure and Murry2008) and Kogure et al. (Reference Kogure, Elzea-Kogel, Johnston and Bish2010), based on low-temperature IR spectra and streaked electron diffraction patterns obtained along the Yi direction, proposed that the stacking structures of different polytypic groups might coexist in a single particle. In this situation, direct observation via HRTEM is the most reliable approach to substantiating such hypotheses. However, visualizing these stacking structures requires imaging the crystal structure of KGMs along the Yi directions, which demands a higher resolution than conventional observations along the Xi directions, as demonstrated by Kogure & Inoue (Reference Kogure and Inoue2005a,b). Moreover, KGMs are highly susceptible to electron beam damage, making such imaging extremely challenging (Kogure et al., Reference Kogure, Elzea-Kogel, Johnston and Bish2010).
For such situations, a novel imaging technique known as optimum bright-field scanning transmission electron microscopy (OBF-STEM) has recently been developed (Ooe et al., Reference Ooe, Seki, Ikuhara and Shibata2021). This method utilizes a segmented annular detector to capture both transmitted and diffracted beams, and it obtains phase contrast images with high signal-to-noise ratios even under low-dose conditions by applying appropriate phase shifts to the signals from individual segments and synthesizing them. This imaging technique has been applied successfully to elucidate the local structures of beam-sensitive materials, such as zeolites (Ooe et al., Reference Ooe, Seki, Yoshida, Kohno, Ikuhara and Shibata2023). In the present study, we employed this technique to observe stacking faults in nacrite, and, for the first time, we demonstrated that these faults arise from the intermixing of the stacking structure characteristic of Group A.
Materials and methods
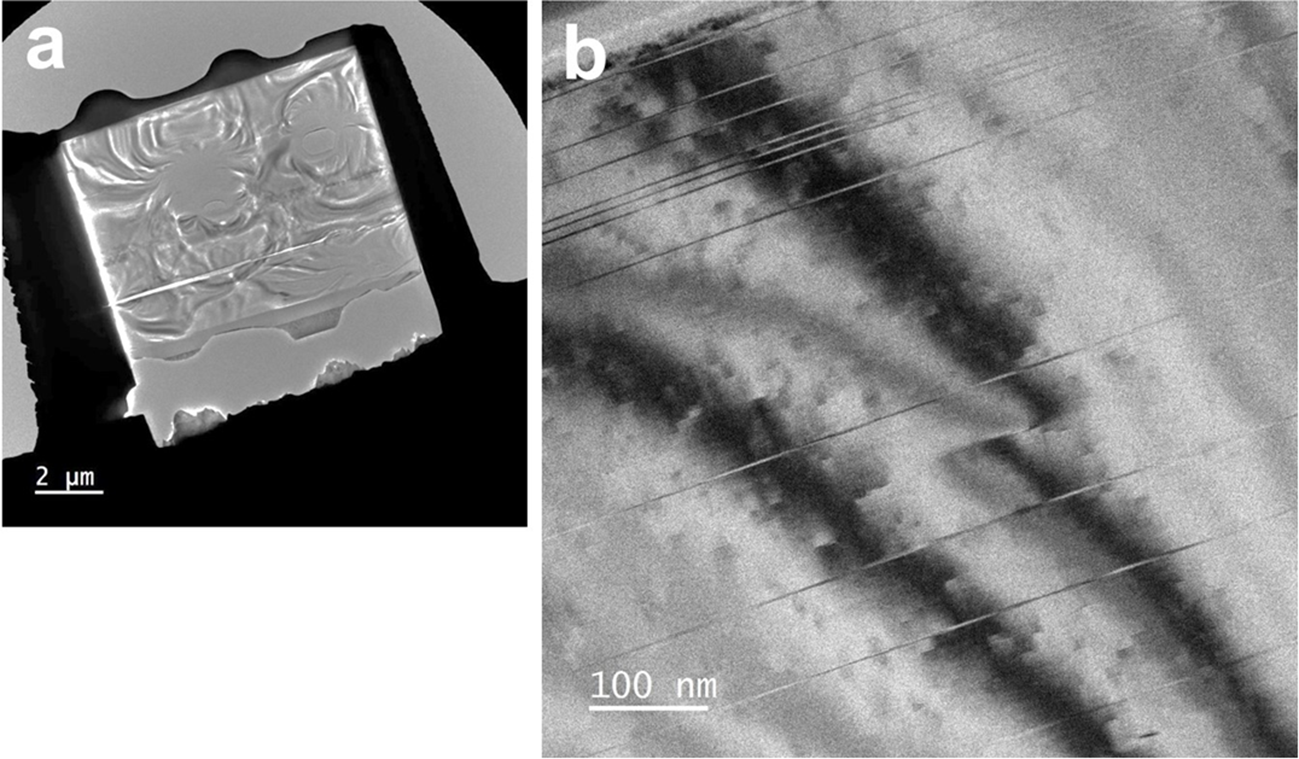
The specimen investigated was nacrite from Lodève, France (Buatier et al., Reference Buatier, Deneele, Dubis, Potdevin and Lopez2000), donated by the National Museum of Nature and Science, Japan (sample No. 19470). The studied sample was a millimetre-sized euhedral and platy crystal precipitated in a dolomite cavity. Buatier et al. (Reference Buatier, Deneele, Dubis, Potdevin and Lopez2000) suggested that the nacrite precipitated from a solution with high salinity at a relatively low temperature (80–100°C). After determining the crystal orientation using electron back-scattered diffraction (EBSD), cross-sectional thin films for TEM/STEM observations were prepared using a focused ion beam (FIB) instrument with a microsampling function (Hitachi High-Tech, FB-2100). Because OBF-STEM is effective for samples with sufficiently small thicknesses, we prepared FIB samples with inhomogeneous sample thicknesses by modulating the thickness of the tungsten (W) protection film deposited on the surfaces before FIB sputtering (Fig. 1a). Varying the tungsten film thickness often induced hole formation in the regions beneath the thinner parts, whereby the surrounding areas achieved a thickness appropriate for OBF-STEM imaging.
(a) Low‑magnification TEM image of a FIB specimen prepared from the surface of a single nacrite crystal. (b) BF-TEM image of the FIB specimen with the incident electron beam oriented nearly parallel to [130], showing a linear contrast arising from stacking faults.

Preliminary TEM investigations, such as bright-field (BF) imaging and selected-area diffraction (SAD), were performed using a JEOL JEM F-200 TEM device operated at 200 kV and a Gatan One-View CMOS (complementary metal oxide semiconductor) camera equipped with the TEM device. OBF-STEM images were obtained using an aberration-corrected 300 kV TEM device (JEM-ARM300F2 with a wide-gap polepiece) and an eight-segment detector (SAAF-Octa; Jimbo et al., Reference Jimbo, Hashiguchi and Ohnishi2020). As noted earlier, due to the beam sensitivity of KGMs, OBF-STEM imaging was performed at the minimum electron dose required to recognize all atomic columns within the structure. The OBF-STEM images described later were acquired using a probe current of 0.2 pA, a dwell time of 10 μs and a dwell (or signal sampling) interval of ∼0.06–0.09 Å, yielding an electron dose of ∼1.4–2.0 × 10³ e– Å–2 per frame. This value is comparable to that (1.2 × 10³ e– Å–2) used to record OBF-STEM images of a beam-sensitive zeolite using the same STEM instrument and acceleration voltage (Ooe et al., Reference Ooe, Seki, Yoshida, Kohno, Ikuhara and Shibata2023), and it is higher than that (3 × 10² e– Å–2) used to record conventional HRTEM images of halloysite with a lower magnification (Kogure et al., Reference Kogure, Mori, Kimura and Takai2011). Subsequent imaging of the same area resulted in severe degradation, suggesting that this electron dose represents the threshold for recording KGM images with all atomic columns fully resolved. The image resolution was 2048 × 2048 pixels, with an acquisition time of ∼40 s per frame. Distortions caused by specimen drift during image acquisition were corrected using Adobe® Photoshop®. Specifically, the rectangular images were scaled and sheared into parallelograms to accurately reproduce the original unit-cell geometry of nacrite.
Finally, we applied a local Wiener filter (HREM-Filter Pro, HREM Company; Kogure et al., Reference Kogure, Eilers and Ishizuka2008) to several of the acquired OBF-STEM images to reduce the random noise and enhance the presentation of the periodic structures in the images.
Results and discussion
OBF-STEM imaging along the Yi and Xi axes
Figure 1b presents a BF-TEM image of nacrite obtained with the incident electron oriented approximately along the [130] zone axis, which is one of the ±Yi axes. Several linear contrasts parallel to (001) are clearly observed, suggesting the possible formation of stacking faults. Buatier et al. (Reference Buatier, Deneele, Dubis, Potdevin and Lopez2000) investigated this nacrite specimen using TEM and demonstrated, from electron diffraction and lattice images, that a high density of stacking disorder involving ±120° rotations of the 1:1 layers around c* is common in the structure. However, such stacking disorder arising from ±120° rotations does not produce diffraction contrast when observed along the [130] direction, as shown in Fig. 1b. This is because the projections of the nacrite structure are nearly identical irrespective of such ±120° rotations. In contrast, stacking structures belonging to different polytypic groups yield distinct projections of the structure along this direction; therefore, their coexistence can be recognized as diffraction contrast (Kogure et al., Reference Kogure, Hybler and Ďurovič2001).
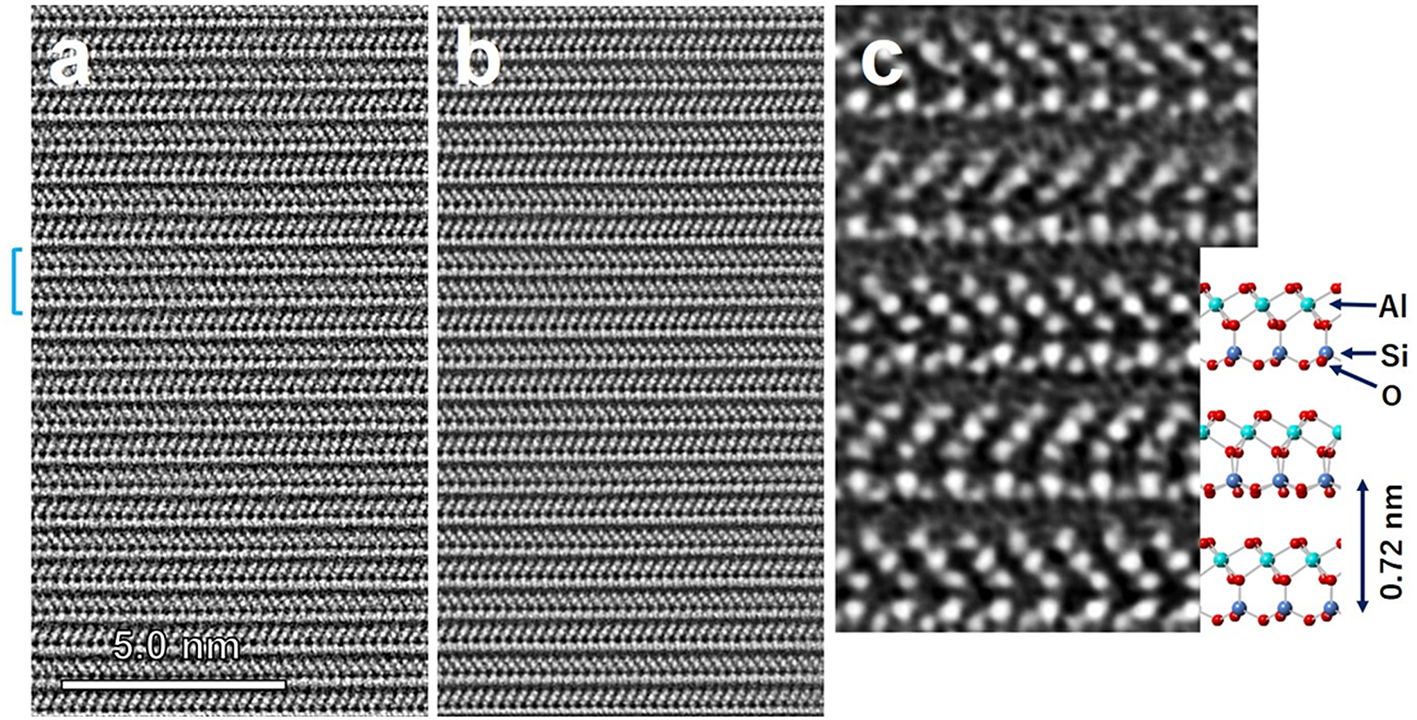
Figure 2a shows an unprocessed OBF-STEM image along the [130] zone axis containing one of these stacking faults near the centre of the field of view. The processed image after supressing the random noise is shown in Fig. 2b, and an enlarged portion aligned with the structural model of nacrite is presented in Fig. 2c. Even the oxygen columns within the nacrite structure are distinctively resolved, showing good correspondence with the nacrite structure. High-quality images were successfully captured around the edges of the FIB-milled holes in the specimen (Fig. 1a). Image formation in OBF-STEM relies on the weak-phase object approximation (WPOA; Ooe et al., Reference Ooe, Seki, Ikuhara and Shibata2021), which holds true only for extremely thin specimens. For observing phyllosilicate minerals along their layers at an acceleration voltage of 200 kV, a thickness of less than 10 nm is required to prevent contrast reversal, such as in the tetrahedral sheets (Kogure, Reference Kogure, Bergaya and Lagaly2013). This critical thickness is probably achieved only in the immediate vicinity of the hole. Note that ‘thickness’ here refers to the crystalline core, obtained by subtracting the thickness of the FIB-induced amorphous surface layer from the total sample thickness.
(a) Raw OBF‑STEM image of nacrite recorded along the [130] zone axis. The blue bracket on the left indicates the location of the stacking fault. (b) Image of the same area after correction for distortion caused by specimen drift during acquisition and noise reduction by filtering. (c) Enlarged view of a portion of (b) together with the corresponding structural model of nacrite.

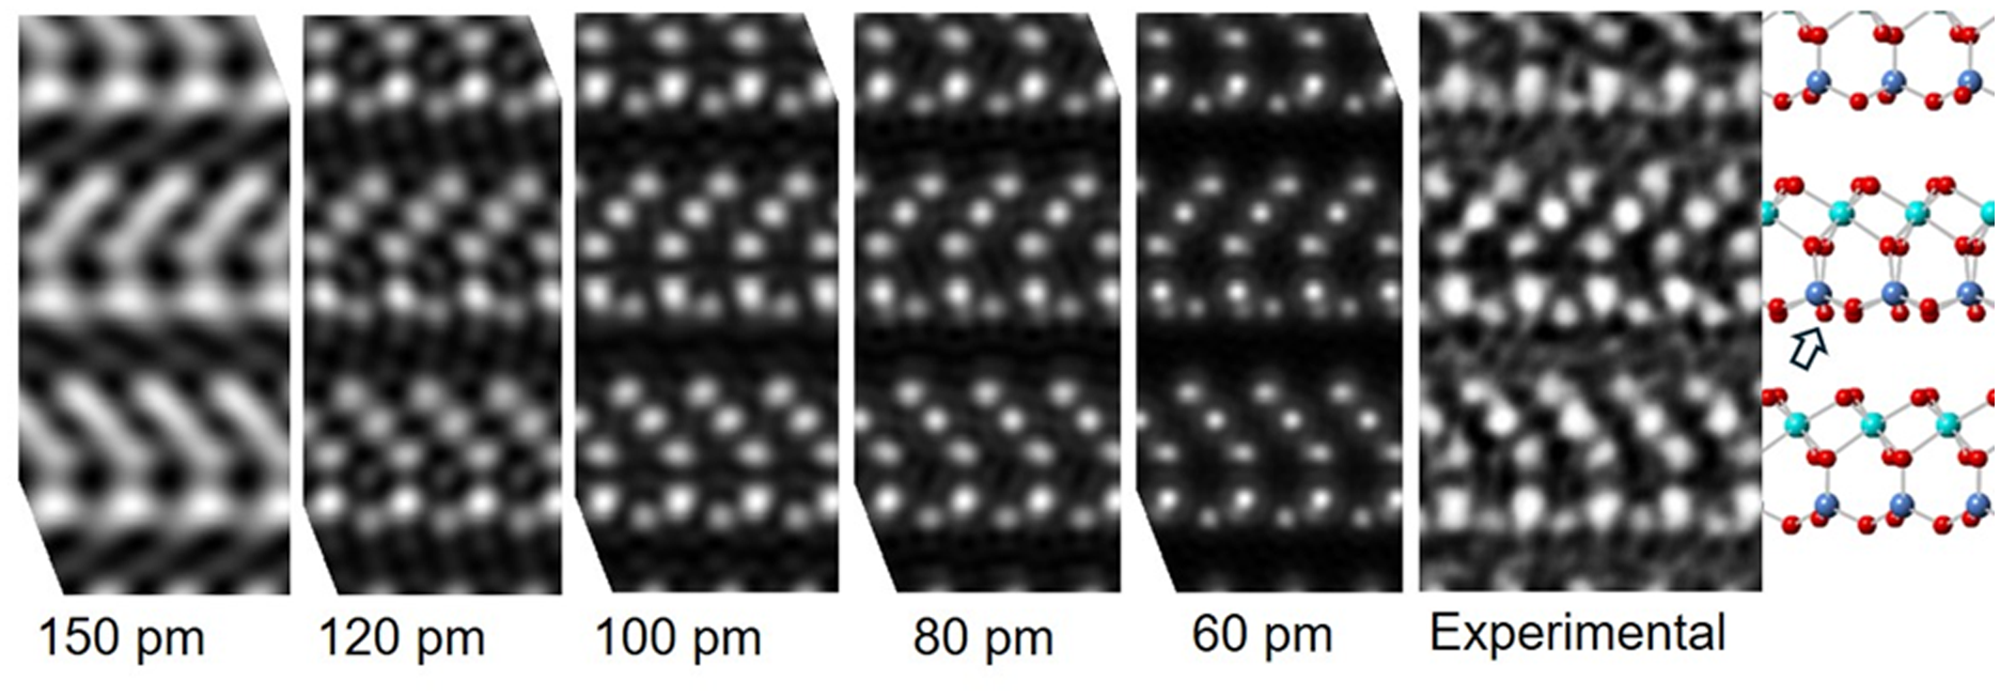
Except for the stacking faults indicated by the bracket on the left side of Fig. 2a, the orientations of the octahedral sheets in the 1:1 layers alternate between adjacent layers, confirming the two-layer periodicity characteristic of Group D polytypes such as nacrite. The aberration-corrected STEM employed (JEM ARM-300F2) has a nominal resolution of 59 pm (Jimbo et al., Reference Jimbo, Hashiguchi and Ohnishi2020). To evaluate the practical resolution of the present nacrite structural image, we compared it with Fourier-synthesized images calculated from diffraction waves of nacrite with h = –3k indices and several limit values of d-spacing using the crystallographic parameters of nacrite reported by Zheng & Bailey (Reference Zheng and Bailey1994) (Fig. 3). In this image, for instance, the basal oxygen column (indicated by the white arrow in the structure model in Fig. 3) closest to the silicon column is not resolved, suggesting an effective resolution of ∼100 pm.
Fourier synthesis of calculated diffraction waves with indices h = –3k and d-spacings down to the values shown below the images, together with the corresponding experimental OBF‑STEM image and structural model.

Figure 3 Long description
The image consists of a series of six diffraction pattern images followed by a structural model. The first five images display calculated diffraction patterns with decreasing resolutions labeled as 150 picometers, 120 picometers, 100 picometers, 80 picometers and 60 picometers from left to right. Each pattern shows a progressively clearer arrangement of bright spots as the resolution increases. The sixth image is labeled ′Experimental′ and shows a similar pattern to the calculated images. To the right of these images is a structural model depicting a lattice structure with atoms represented as colored spheres connected by lines. An arrow points to a specific part of the model, indicating a feature of interest.
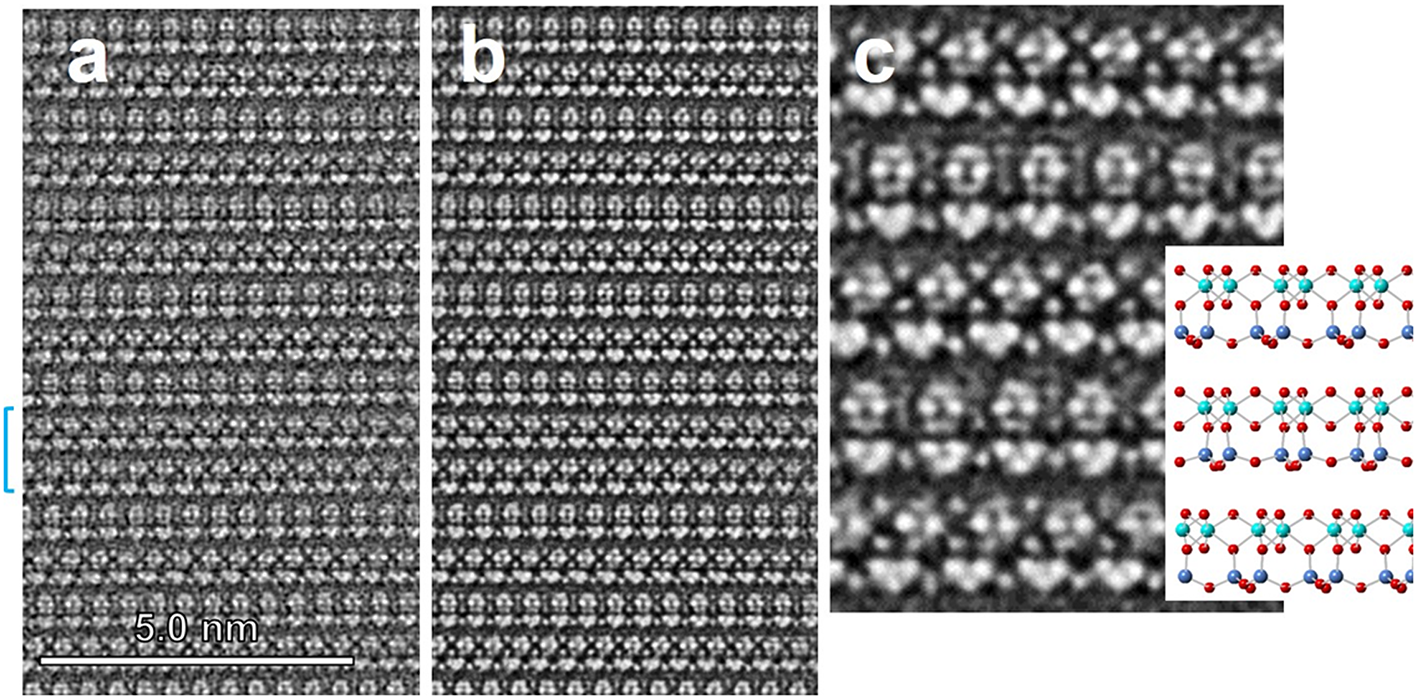
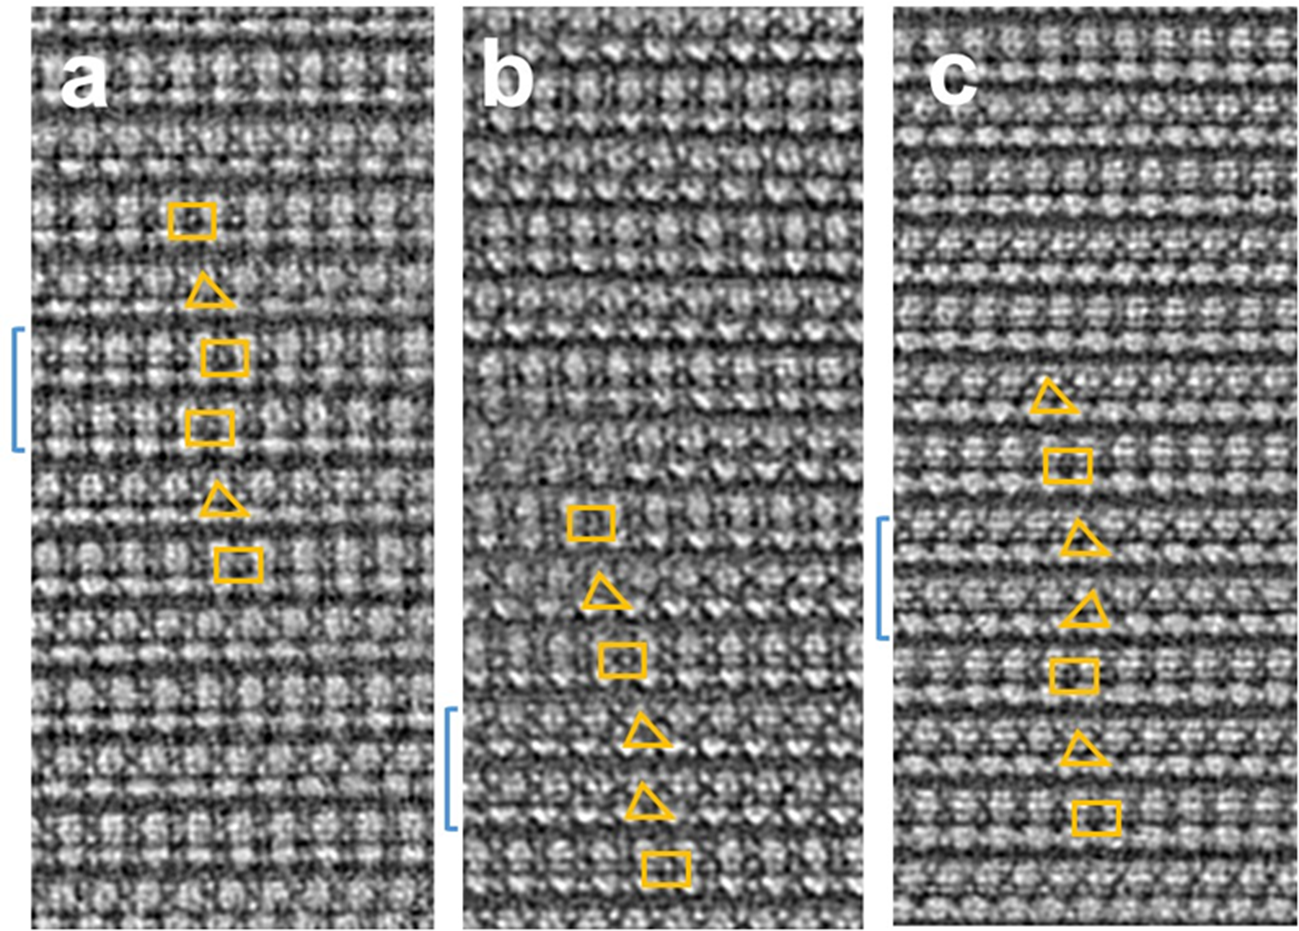
(a) Raw OBF‑STEM image of nacrite recorded along [110]. The blue bracket on the left indicates the location of the stacking fault. (b) Image of the same area after correction for distortion caused by specimen drift during acquisition and noise reduction by filtering. (c) Enlarged view of a portion of (b) together with the corresponding structural model of nacrite viewed along [110].

Figure 4 shows an OBF-STEM image of almost the same area as that in Fig. 2, obtained along the [110] zone axis, one of the ±Xi axes, achieved by rotating the specimen by 30° around c* from [130]. In this projection, a layer in which the atomic columns of Si and Al are vertically aligned and another in which the Si and Al columns are horizontally displaced by one-third of the periodicity alternate, resulting in a two-layer periodicity corresponding to the nacrite structure. The stacking disorder involving ±120° rotations reported by Buatier et al. (Reference Buatier, Deneele, Dubis, Potdevin and Lopez2000) is absent from this field of view, although the existence of such a stacking disorder was confirmed in other areas by conventional TEM imaging. The correspondence between this OBF-STEM image and the nacrite structure (Fig. 4c) will be discussed later.
Analysis of the stacking fault
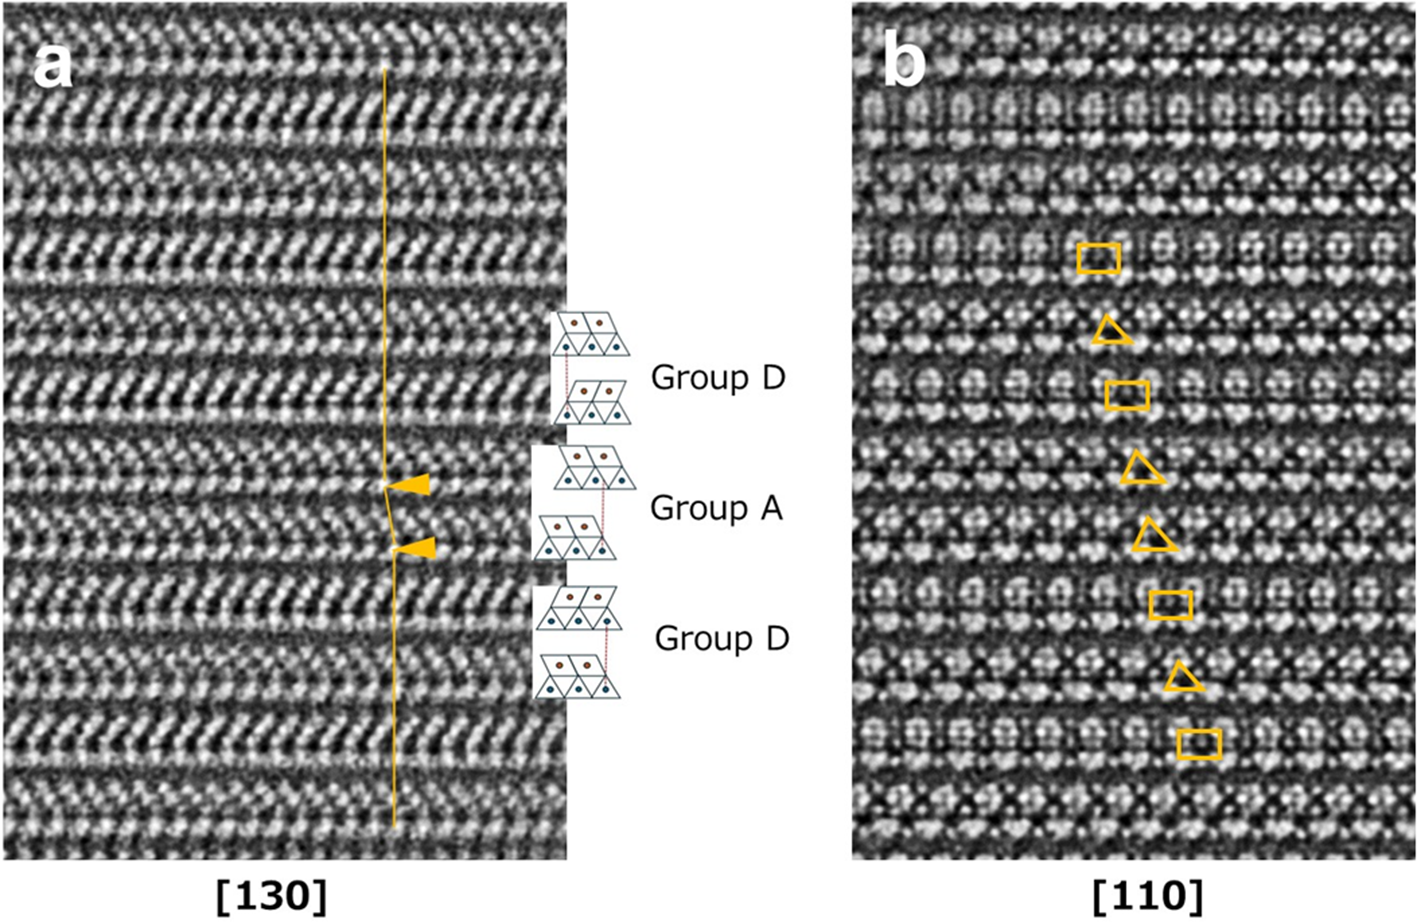
These OBF-STEM images, resolving the atomic columns, reveal the origin of the stacking faults observed in Fig. 1b (Fig. 5). Considering the image along the [130] direction (Fig. 5a), the fault exhibits two 1:1 layers, with the octahedral sheets oriented in the same direction, unlike the normal nacrite structure above and below the fault. Furthermore, the Si columns are displaced horizontally by one-third of the periodicity between the two layers, as indicated by the inserted line in Fig. 5a connecting the Si column in each layer. This displacement is only observed at the fault. This characteristic indicates that the stacking sequence of these two 1:1 layers at the fault belongs to Group A (Bailey, Reference Bailey and Bailey1988). During this study, we recorded two additional images along the same direction that successfully recorded other stacking faults, which showed identical features (Fig. S1), suggesting that most stacking faults in Fig. 1b formed by the insertion of the stacking sequence characteristic of Group A in nacrite.
(a) Processed OBF-STEM image along the [130] zone axis, including a stacking fault in the field of view, and structural models of Groups A and D corresponding to the image. The orange line in the image connects the contrast corresponding to the Si columns in the 1:1 layer between the upper and lower layers. A horizontal shift can be observed at the arrowheads – namely, at the stacking fault. (b) Processed OBF-STEM image along the [110] zone axis at the same view, containing the same stacking fault. See Figure S2 for the meanings of the triangular and rectangular symbols.

When viewed along the [110] direction (Fig. 5b), the two layers corresponding to the fault exhibit identical contrast, with the Al and Si atomic columns horizontally displaced within the 1:1 layers and a displacement observed between the two layers. Kogure & Inoue (Reference Kogure and Inoue2005a,Reference Kogure and Inoueb) used symbols or patterns (rectangles and two types of triangle whose apexes corresponded to the centre of Si pairs or Al pairs within a 1:1 layer) to more conveniently depict the stacking sequence and observed direction of kaolinite. Here, we present a similar diagram for nacrite, dickite and kaolinite (Fig. S2). By comparing this diagram and observing the contrast at the stacking fault in Fig. 5b, we concluded that the stacking sequence of the two layers at the fault corresponds to kaolinite observed along [ $\overline 1 $10]. Similarly, three additional images along the [110] zone axis of nacrite containing the stacking fault are shown in Fig. 6. Unlike the fault in Fig. 5, we did not record the corresponding [130] images for these faults. Hence, we assume that the stacking sequences at these faults belong to those in nacrite, dickite or kaolinite but not to those in other polytypes. The symbols of the two layers and their horizontal displacements at these faults are explained by kaolinite observed along [
 $\overline 1 $10] (Fig. 6a), kaolinite observed along [
 $\overline 1 $10] (Fig. 6b) and dickite observed along [100] (or [
 $\overline 1 $00]; Fig. 6c), respectively, when compared with the diagram in Fig. S2. Note that these are not explained by any of the patterns for nacrite, as shown in Fig. S2, indicating that the stacking faults in Fig. 6 are not a ‘micro-twin’ with ±120° rotation about c* as reported by Buatier et al. (Reference Buatier, Deneele, Dubis, Potdevin and Lopez2000). Although further observation and analysis of other specimens will be required to generalize our results, the present study provides the first demonstration that stacking sequences belonging to different polytypic groups can coexist within a single crystal of a dioctahedral 1:1 phyllosilicate. The results also imply that the stacking sequences of Groups A and D, which differ substantially in their features (layer rotation and interlayer shifts) in dioctahedral 1:1 phyllosilicates, are close in terms of energetic stability. This may explain why only Group A (kaolinite, dickite) and Group D (nacrite) polytypes, and not Groups B and C, have been discovered in KGMs or dioctahedral 1:1 phyllosilicates.
Three processed OBF-STEM images recorded along [110] of nacrite containing stacking faults that are indicated by blue brackets on the left. The triangle or rectangle on each 1:1 layer is the symbol of the layer, depending on the polytypes and six ±Xi viewing directions (see Figure S2).

Possibility of partial dehydroxylation of KGMs
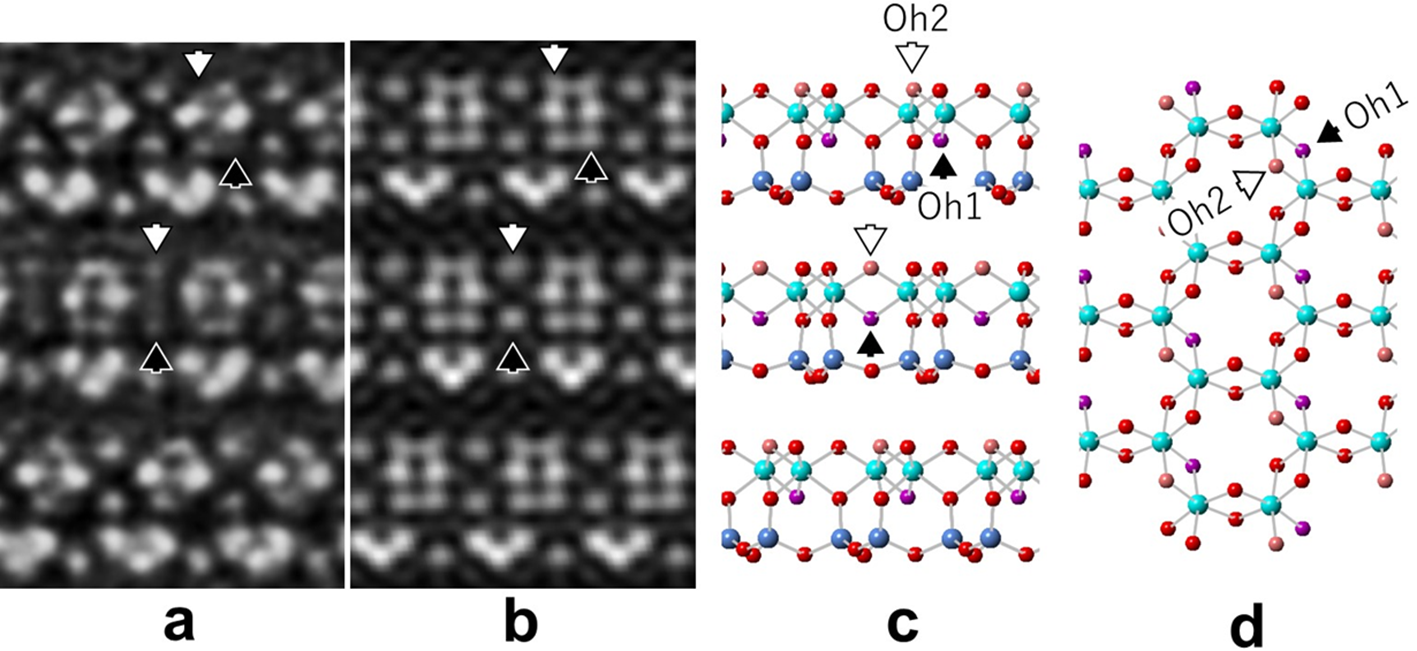
Finally, the contrast observed along the [110] (one of the Xi axes) direction of nacrite in Fig. 4 was examined in detail (Fig. 7). A comparison between the observed image (Fig. 7a) and the Fourier-synthesized image calculated from diffraction waves down to 100 pm (Fig. 7b) reveals that the contrast of the oxygen columns Oh1 and Oh2 (Zheng & Bailey, Reference Zheng and Bailey1994) is almost absent or significantly weaker than that of other oxygen columns. A plausible explanation for this result is that dehydroxylation, commonly induced by heating in dioctahedral 2:1 phyllosilicates such as muscovite and celadonite (Brigatti & Guggenheim, Reference Brigatti, Guggenheim, Mottana, Sassi, Thompson and Guggenheim2002), may also occur in dioctahedral 1:1 phyllosilicates due to electron irradiation or possibly during specimen preparation using a FIB. Kogure (Reference Kogure2007) and Kogure & Drits (Reference Kogure and Drits2010) reported that HRTEM contrasts of muscovite resemble those calculated from dehydroxylated muscovite rather than from normal muscovite, suggesting that electron irradiation in TEM can induce dehydroxylation similar to that normally associated with high-temperature treatment. In kaolin minerals, the inner hydroxyl (Oh1) and one (Oh2) of the three outer hydroxyls are separated by a distance of ∼240 pm, which is significantly shorter than the other hydroxyl separations (Fig. 7d). Therefore, it is conceivable that a water molecule was formed from these two hydroxyls and was subsequently released. The location of the residual oxygen atoms remains uncertain. In muscovite, the residual oxygen resides at the same height as the Al atoms in the octahedral sheet (Udagawa et al., Reference Udagawa, Urabe and Hasu1974); however, no such contrast is observed in Fig. 7a. The residual oxygen may be statistically distributed around the Oh1 and Oh2 positions. This finding highlights that high-resolution electron microscopy of hydroxyl-bearing crystalline specimens can induce dehydroxylation, thereby altering the original crystal structure. This possibility should be considered carefully in future studies aiming to determine the crystal structures of hydroxyl-bearing materials directly using ultra-high-resolution electron microscopy.
(a) Processed OBF-STEM image of nacrite recorded along the [110] direction. (b) Corresponding Fourier synthetic image from the calculated diffraction waves with indices h = –k and d-spacings ≥100 pm. (c) Structural model of nacrite along [110] corresponding to (a) and (b). (d) Top view of the uppermost octahedral sheet in (c). The black arrows indicate the inner hydroxyl (Oh1) within the 1:1 layer or the corresponding contrast, and the white arrows indicate one of the outer hydroxyls (Oh2) located closest to the inner hydroxyl.

Figure 7 Long description
Processed OBF-STEM image of nacrite recorded along the [110] direction, with white arrows indicating specific features. Corresponding Fourier synthetic image from calculated diffraction waves, with similar arrow indicators. Structural model of nacrite along [110], highlighting inner hydroxyl (Oh1) and outer hydroxyl (Oh2) positions. Top view of the uppermost octahedral sheet, with black arrows indicating the inner hydroxyl (Oh1) and white arrows indicating one of the outer hydroxyls (Oh2) closest to the inner hydroxyl.
Supplementary material
The supplementary material for this article can be found at https://doi.org/10.1180/clm.2026.10057.
Acknowledgements
We would like to thank the three anonymous reviewers who provided valuable comments. We are also grateful to Waka Tarora for the FIB operation of preparing thin-film samples for TEM.
Financial support
This work was supported by the Mitsubishi Foundation; the JST FOREST Program, Grant Number JPMJFR2361; and JSPS KAKENHI, Grant Number JP25H01448.
Competing interests
The authors declare none.
Disclaimer
Adobe and Photoshop are either registered trademarks or trademarks of Adobe in the United States and/or other countries.


 Open access

