


1. Introduction
Recovery of past climatic signals is one of the most important tasks in glaciological research. Deep ice-core studies have successfully revealed long-term (tens to hundreds of thousands of years) climatic change in Antarctica (e.g. Reference JouzelJouzel and others, 1987; Reference PetitPetit and others, 1997), at sites in central Greenland (e.g. Reference JohnsenJohnsen and others, 1997) and at mid-to low-latitude sites such as the Tibetan Plateau (Reference ThompsonThompson and others, 1989). However, explanation of the long-term climatic record requires an understanding of modern climate, so it is important also to fully understand climatic variation over recent decades to centuries. In recent years the International Trans-Antarctic Scientific Expedition (ITASE) has been investigating the variability of surface mass balance and climate over the Antarctic ice sheet during the past 200 years.
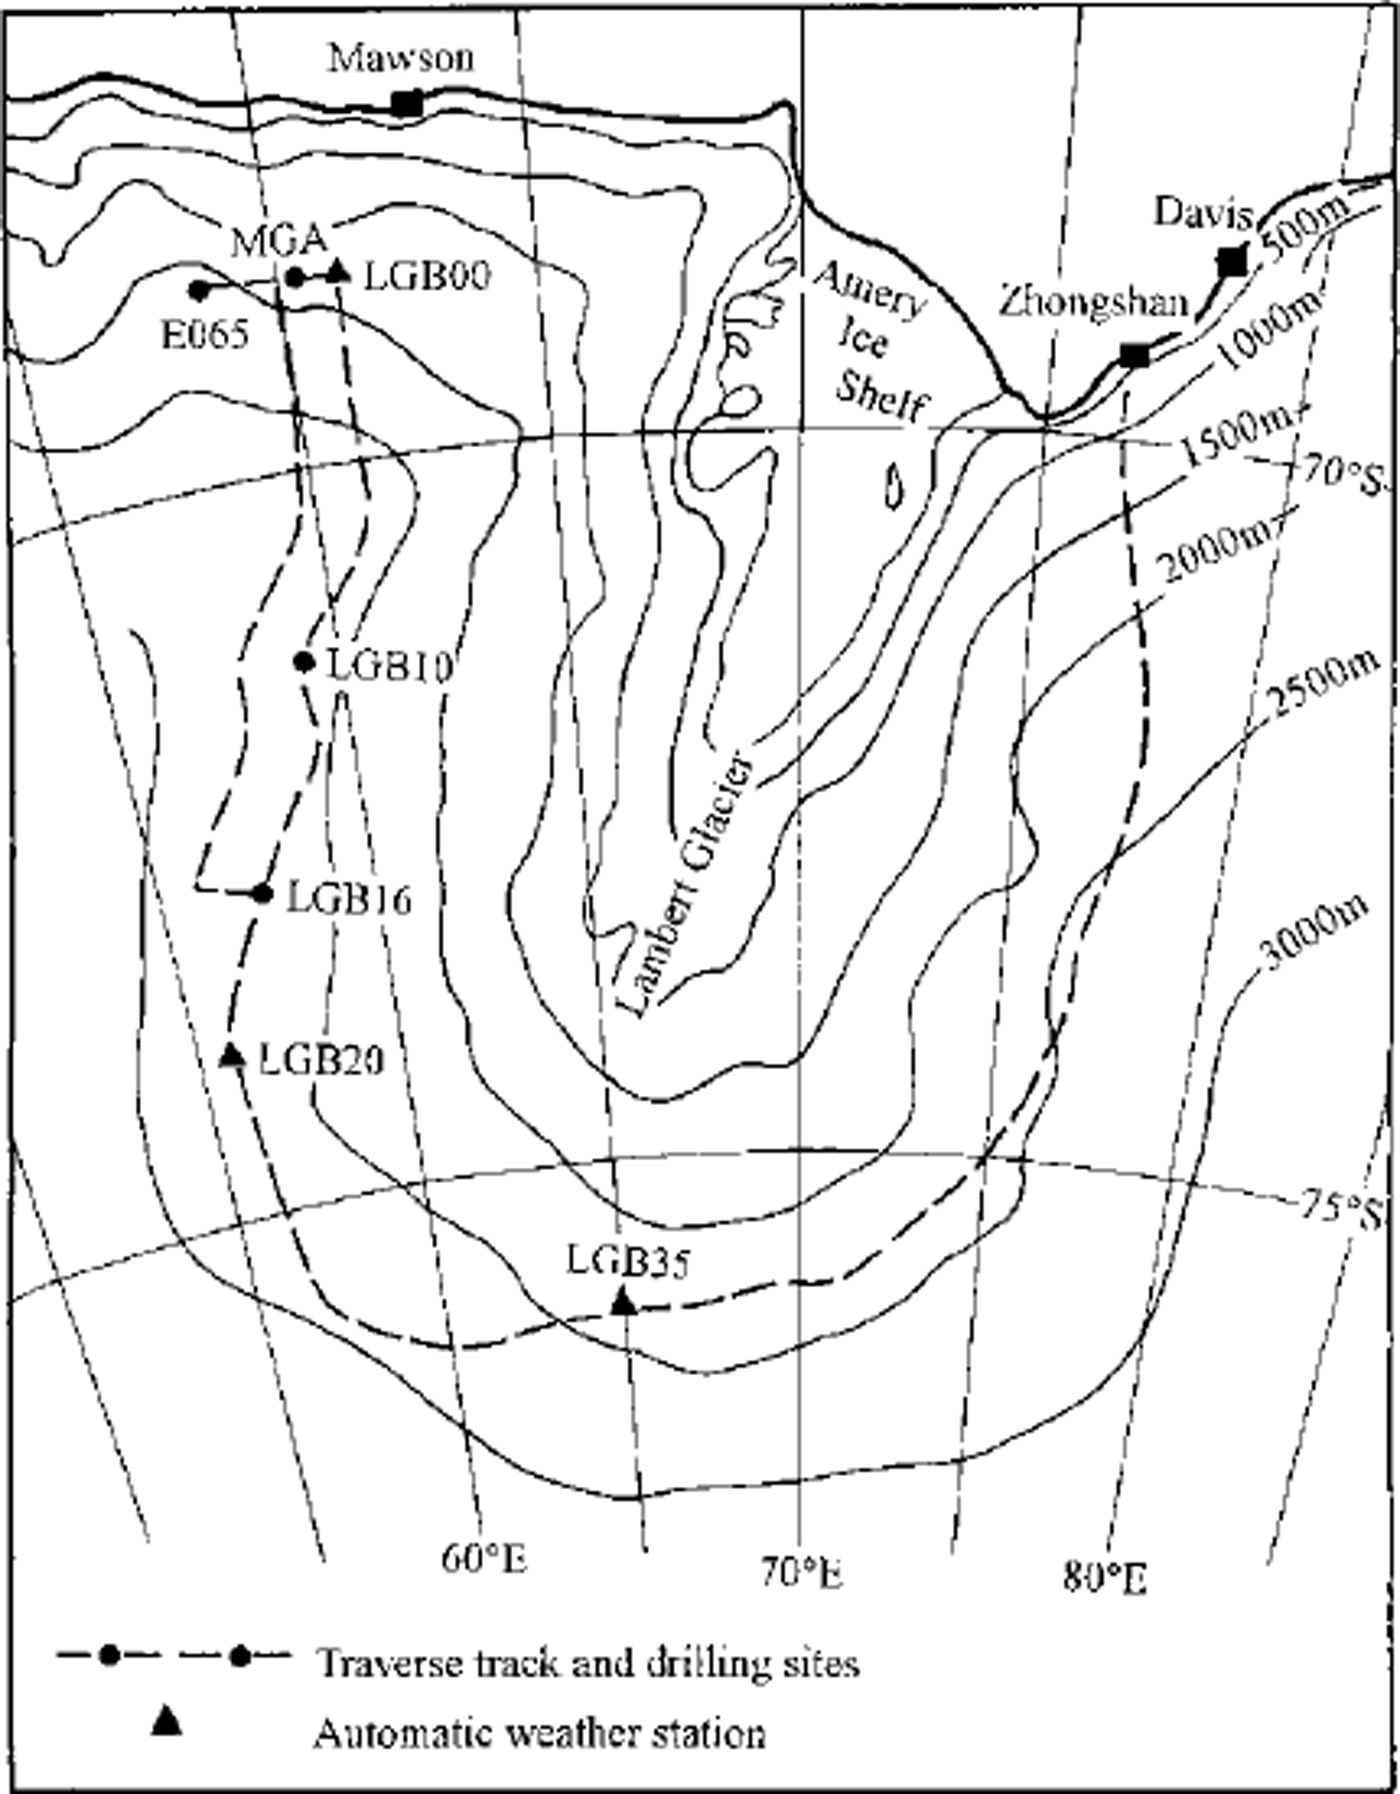
Joint Chinese/Australian measurements made during the Lambert Glacier basin traverses since 1990 have contributed to ITASE. During these repeated traverses, a number of snow/firn samples from shallow cores and snow pits were collected for isotope analysis along a route at about 2500 m a.s.l. (Fig. 1). Visible-stratigraphy observations were also made for these cores and pits. Additionally, some cores were measured for electrical conductivity. With these and other related data, such as the accumulation derived from cane measurements along the traverse route and temperature records from Mawson station, variations of snow accumulation and temperature over past decades can be examined.
Map of the Lambert Glacier basin showing traverse routes and sampling sites.
2. Sampling and Analysis
Figure 1 shows the Lambert Glacier basin traverse routes and the location of the sampling sites. The data used in this paper are taken from the traverses in the western part of the basin. Surface 2 m samples were taken from 2-5 m cores drilled every 30 km along the route between LGB00 and LGB35, and every 50 km along the offset line to the west Three cores about 20-30 m apart were taken with a Polar Ice Goring Office (PICO) hand auger at each site. Shallow cores 10-27 m deep were obtained at sites LGB00, LGB05, LGB10, LGB15, LGB16, LGB20, MGA, and E065. Snow pits 1.6-2.7 m deep were dug at LGB00, LGB05, LGB10, LGB16 and MGA. Accumulation cane measurements were made every 2 km along the traverse route over a period of 3-5 years (1990-93 for most sites, and 1989-94 or 1990-94 for some sites). At LGB00 a 50×50m2 cane net, consisting of six rows of six canes spaced 5m apart, was measured for 10 years (1983-93).
Visible stratigraphy was observed for every core and snow pit, but electrical conductivity measurements (EGMs) were made only on the 10-27 m cores. Surface 2 m snow samples were analyzed for both SD and δ18O, whereas the other cores were analyzed only for δ18O. The SD samples were collected uniformly from the top 2 m of a core (and at a few sites from snow pits). The δ18O samples were collected along the cores at a depth interval of 3 cm.
The «5180 measurements were made at the Antarctic GRG, University of Tasmania, Australia, except on the core drilled at LGB16, which was measured at the Laboratory of Ice Gore and Gold Regions Environment, Lanzhou, China. The SD measurements were made at the Laboratoire de Modélisation du Glimat et de l’Environnement, Saclay, France. The accuracy of individual SD and «5180 measurements is ±0.5‰ and ±0.15‰, respectively.
3. Present Accumulation-Rate Distribution
Figure 2 shows the present distribution of accumulation, and the surface elevation profile, between LGB00 and LGB16 along the western side of the Lambert Glacier basin. Accumulation data in this figure are from the cane measurements every 2 km along the route for the period 1990-93. Reference Higham and CravenHigham and Graven (1997) and Reference Higham, Craven, Ruddell and AllisonHigham and others (1997) report cane measurements for the total traverse route around the basin. However, the cane measurements to the east of LGB35 were made over only lyear (1994), and the section between LGB16 and LGB35 was not measured in the 1992-93 austral summer.
Variability of the snow-accumulation rate (in cm snow a−1) and the surface elevation along the traverse route between LGB00 and LGB16. Distance is shown as km from the coast. The accumulation data are derived from cane measurements every 2 km from 1990 to 1993. The thick line is a 21-point running average.
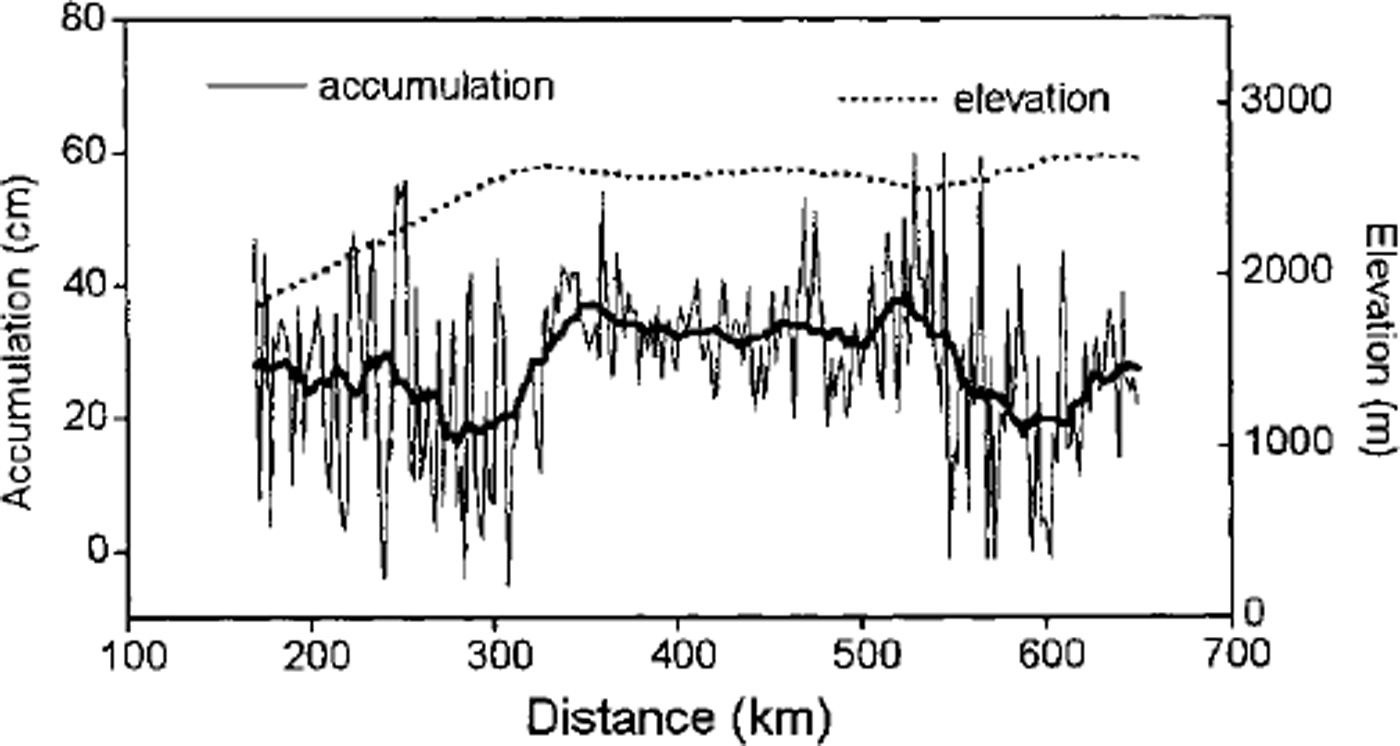
It can be seen from Figure 2 that, within the first 350 km of the coast, the accumulation rate varies greatly and has a relatively low average value. In this zone the ice-sheet surface is steep and katabatic winds are strong, which may explain the large variability of accumulation rate. The low accumulation rate near the coast is quite different from other areas of the coastal Antarctic ice sheet such as in Wilkes Land where the accumulation rate is highest near the coast (Reference GoodwinGoodwin, 1991). This suggests that intrusion of the locally derived maritime water vapour is not as intense in the Lambert Glacier basin as in other regions.
From 350 to 550 km, where the ice-sheet surface is flat with a constant elevation of about 2600 m a.s.l, the accumulation rate is relatively high and constant. Further inland, with increasing elevation and surface roughness, the accumulation rate decreases and the variability becomes large.
Figure 2 includes no data between the coast and 130 km inland (Mawson station to LGB00) because in this area a number of large nunataks influence the snow-accumulation distribution. Within 20 km of Mawson there are areas of net ablation and blue ice.
4. Variation of Accumulation Rate During Past Decades
When shallow firn cores are used to determine changes of accumulation rate with time, core-dating, or establishing a depth-time scale, is critical. In this study, isotope profiles, ECMs and visible stratigraphy were compared for each core, and the cane measurement data were taken as reference. Because we have several cores at each site, the annual-layer series determined from these data are believed to be reliable, especially at sites such as MGA where the accumulation rate is >200 kg m−2 a−1 (Reference Renjiawen, Allison, Higham and GoodwinRen and others, 1995). The dating shows that the cores 10-27 m deep cover a time range of 30-60 years.
Using this, a time series of annual accumulation over the past decades was determined for each core site. Figure 3 shows the accumulation-rate series for cores drilled at MGA and LGB16. At these two sites the accumulation rate has, overall, been decreasing since the 1930s. The other core sites show similar trends, but the average decrease varies from site to site, with a range of 16-37%. Since the late 1980s, however, there is evidence that the accumulation rate has generally increased.
Variability of the accumulation rate over past decades derived from MGA and LGB16 cores. The core dating has been determined from composite data on the isotope profile, visible stratigraphy, ECM and cane measurements (see text for details).
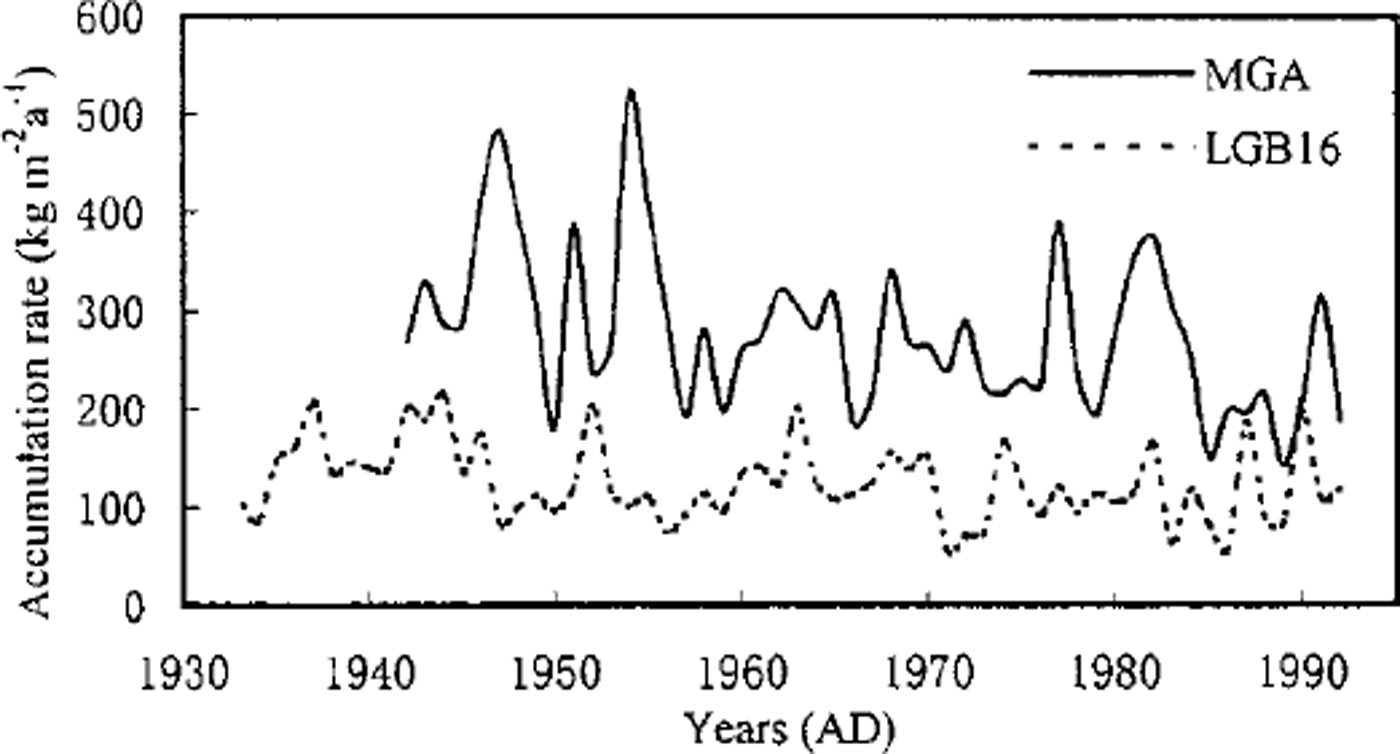
There have been many reports of an accumulation increase in past decades from other regions of Antarctica such as the Antarctic Peninsula (Reference Peel and MulvaneyPeel and Mulvaney, 1988), Wilkes Land (Reference Morgan, Goodwin, Etheridge and WookeyMorgan and others, 1991), the East Antarctic plateau (Reference Mosley-Thompson, Paskievitch and GrossMosley-Thompson and others, 1987), the South Pole (Reference Pourchet, Pinglot and LoriusPourchet and others, 1983; Reference Mosley-ThompsonMosley-Thompson and others, 1995), Dome G and Vostok (Reference Pourchet, Pinglot and LoriusPourchet and others, 1983). Hence, it is often accepted that the accumulation rate has recently been increasing all over Antarctica. On the other hand, decreasing accumulation rates have occasionally been reported, for example on the Mizuho Plateau (Reference Kameda, Nakawo, Mae, Watanabe and NaruseKameda and others, 1990), in Dronning Maud Land (Reference Graf, Reinwarth, Oerter, Dyurgerov and MillerGraf and others, 1990) and on the Siple Coast (Reference Bindschadler, Vornberger and ShabtaieBindschadler and others, 1993). This suggests that accumulation changes over the past decades are not uniform everywhere on the Antarctic ice sheet, and different magnitudes and periods of decrease from site to site, even within the Lambert Glacier basin, reveal the complexity of the accumulation change.
5. Relationship Between Isotopic Ratio of the Surface Snow and Mean Annual Temperature
Figure 4 shows the correlation between the temperature measured at 10 m depth in boreholes and the average stable-isotope ratios of the top 2 m of the surface snow. Both δ18O and δD have a good linear relationship with the temperature.
Correlation of stable isotopes (δ18O, top; δD, bottom) in the surface 2 m snow with the firn temperature measured at 10 m depth.

Reference Lorius and MerlivatLorius and Merlivat (1977) compiled a ^-temperature relationship from the data obtained along the route between Dumont d’Urville station and Dome C inTerre Adélie. That result has often been used in East Antarctic ice-core studies, especially at Dome C (Reference Lorius, Merlivat, Jouzel and PourchetLorius and others, 1979) and Vostok (Reference LoriusLorius and others, 1985; Reference JouzelJouzel and others, 1987). Qin and others (Reference Dahe, Riawen, Wenti, Petit, Jouzel and Stievenard1993, Reference Dahe, Petit, Jouzel and Stievenard1994) discussed the distribution of stable isotopes along the route of the 1990 International Trans-Antarctic Expedition. They found that even across the top of the East Antarctic plateau, the isotopic ratios appear to show changes where both elevation and temperature are almost constant. For example, δ18O and SD differ west and east of Vostok station, so different relationships between temperature and δ values were compiled for these two regions. Reference Renjiawen and AllisonRen and others (1998) compared these and showed that the 6-temperature gradients in the Lambert Glacier basin are closer to those east of Vostok.
6. Temperature Changes
As demonstrated above, we know that stable-isotope ratios in firn are dependent on and have a strong linear relationship with temperature. Hence, isotope profiles of shallow cores can reveal temperature changes over past decades. The δ18O profiles from three cores (MGA, E065 and LGB16) are shown in Figure 5 against derived time-scales. At MGA, cane accumulation measurements were made for several years in the 1970s, averaging 270 kg m−2 a−1. Using a core-derived dating scale, the accumulation rate for the same period from core analysis is 273 kg m−2 a−1 (Reference Renjiawen and AllisonRen and others, 1998). This is very close to the cane result and provides confidence in the timescale for MGA. E065 is only 80 km from MGA and has a similar accumulation rate. LGB16 is located further from the coast (650 km), where the surface is flat and the accumulation variability relatively low.
δ18O profiles for the MGA, E065 and LGB16 cores. The thick line is a 21-point running average of samples measured about every 3 cm. The time-scale is not determined from counting isotope peaks alone, but from comparison of those with visible stratigraphy, ECMs and cane data (see text for details).
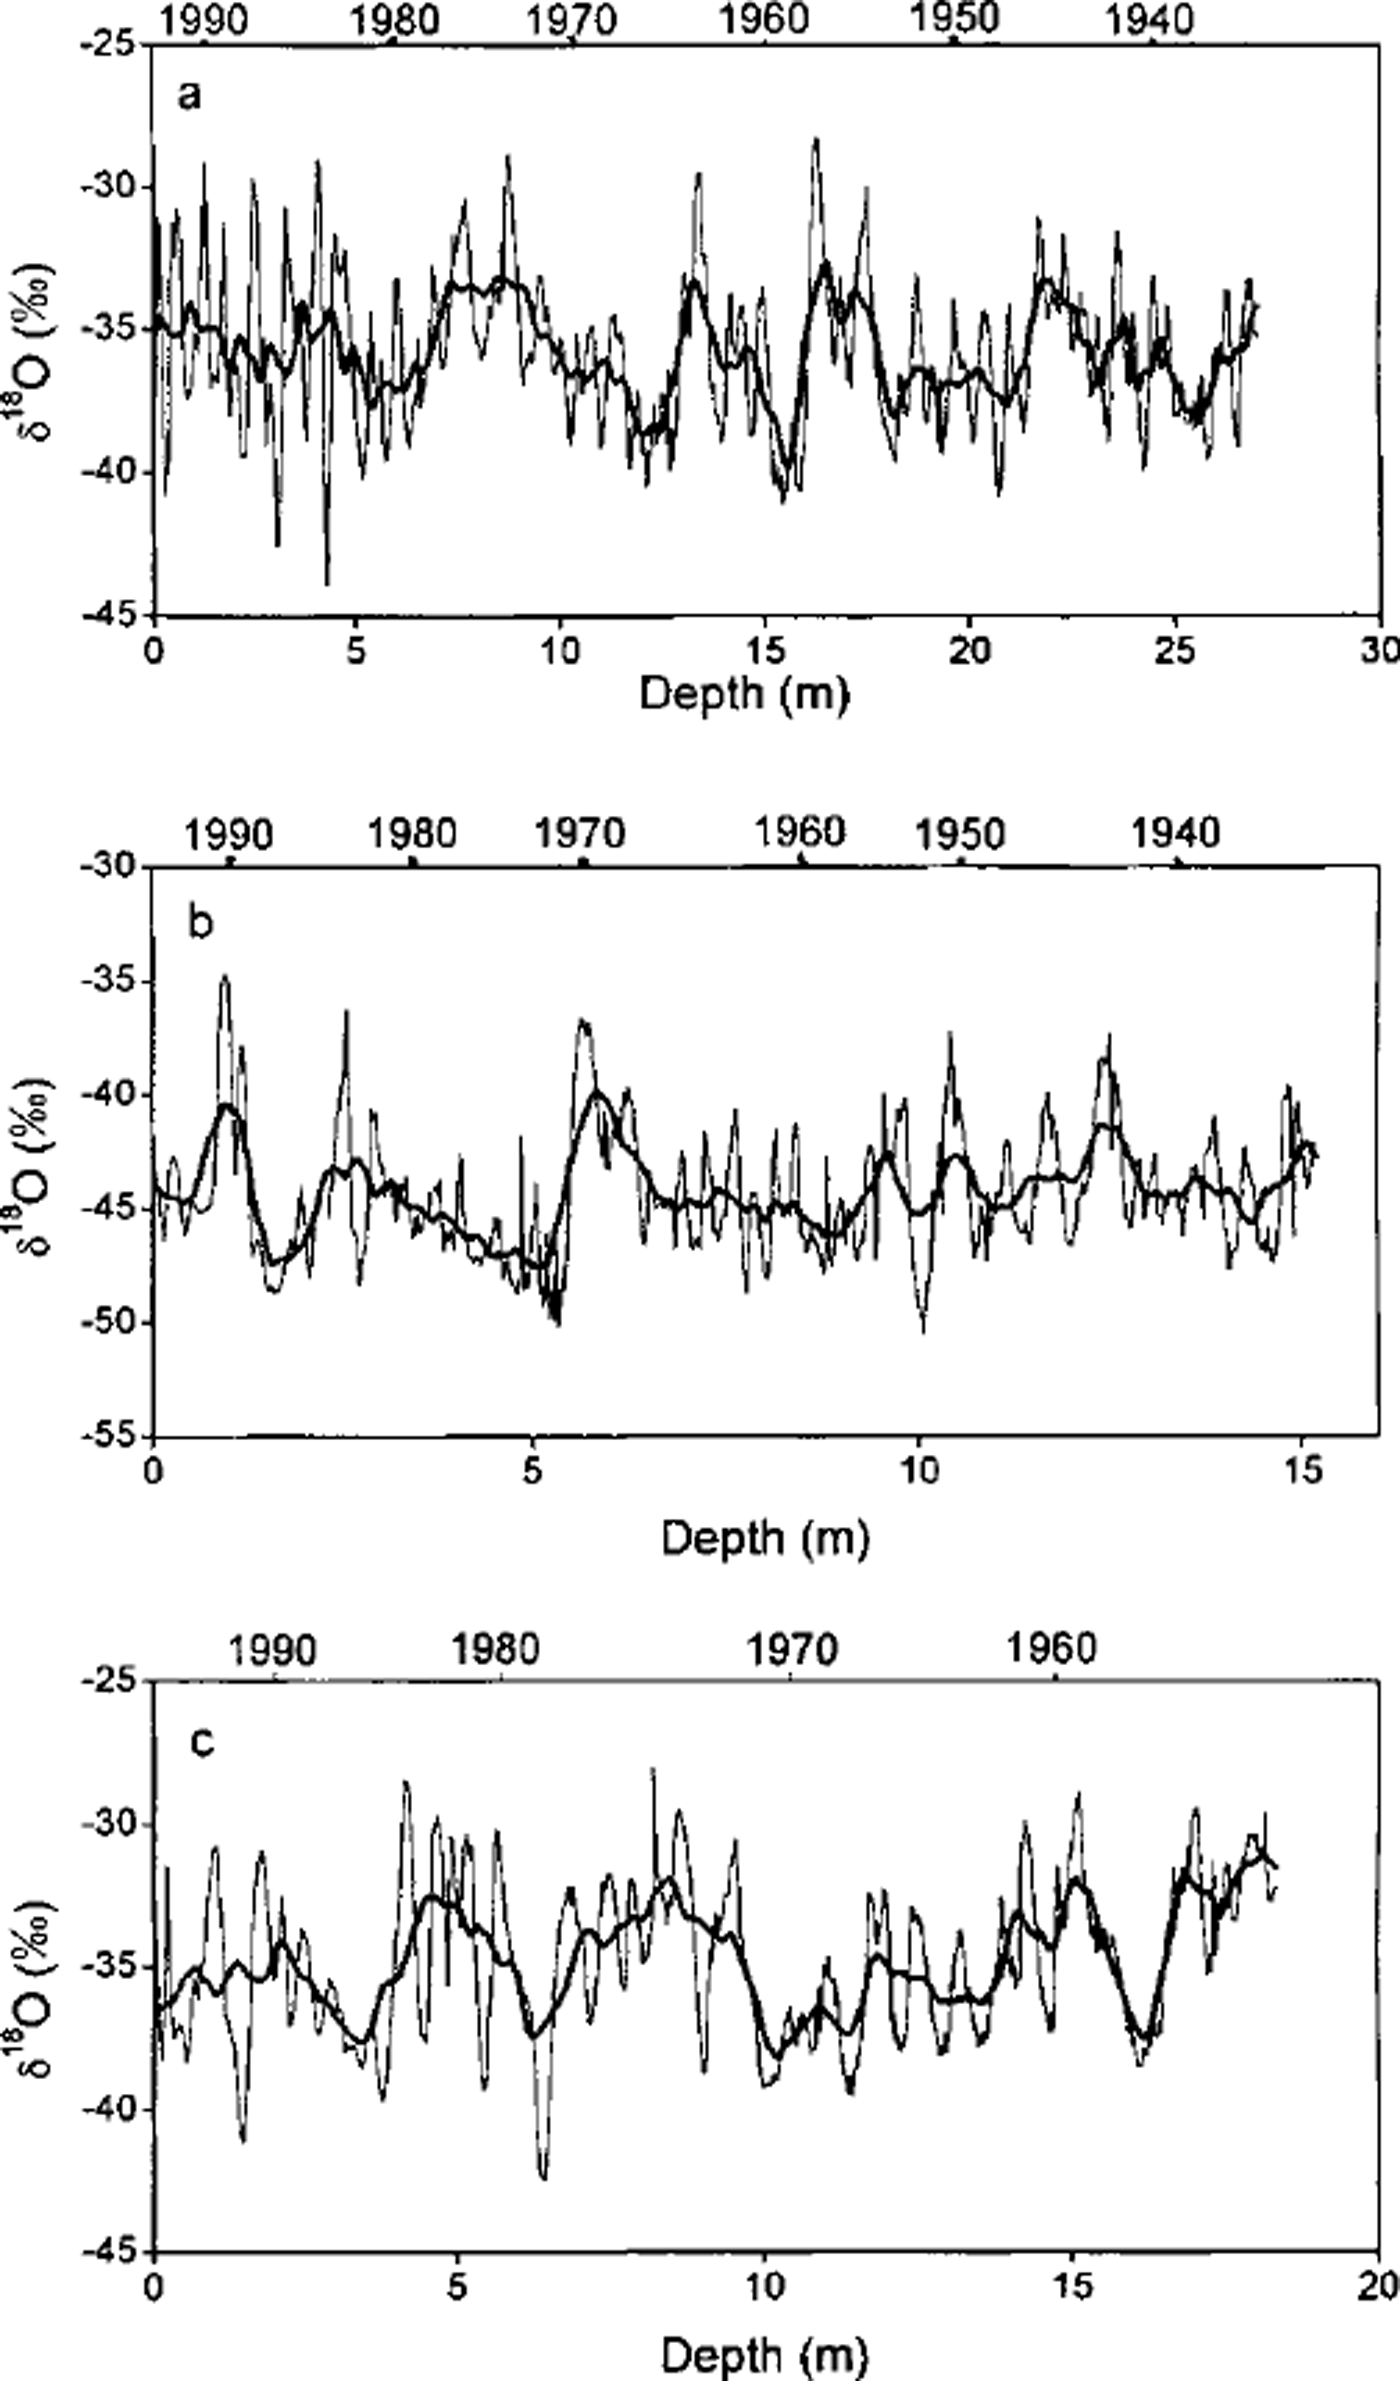
The isotope profiles in Figure 5 do not show a clear and uniform trend over the past several decades. The E065 core shows an apparent decrease in δ18O from the 1950s to the 1970s, but MGA does not. From E065 there is evidence of a recent warming starting in the mid-1980s, whereas at MGA it starts a few years earlier. In the LGB16 profile, there is no systematic change in δ18O from the 1930s to the 1960s, but a sudden cooling occurs around 1970, and there is a decrease in δ18O in the mid-1980s and again in the early 1990s. The other cores analyzed also do not show much consistency. Nevertheless, there is a common feature: δ18O has not noticeably increased overall in the past several decades, and may even have decreased.
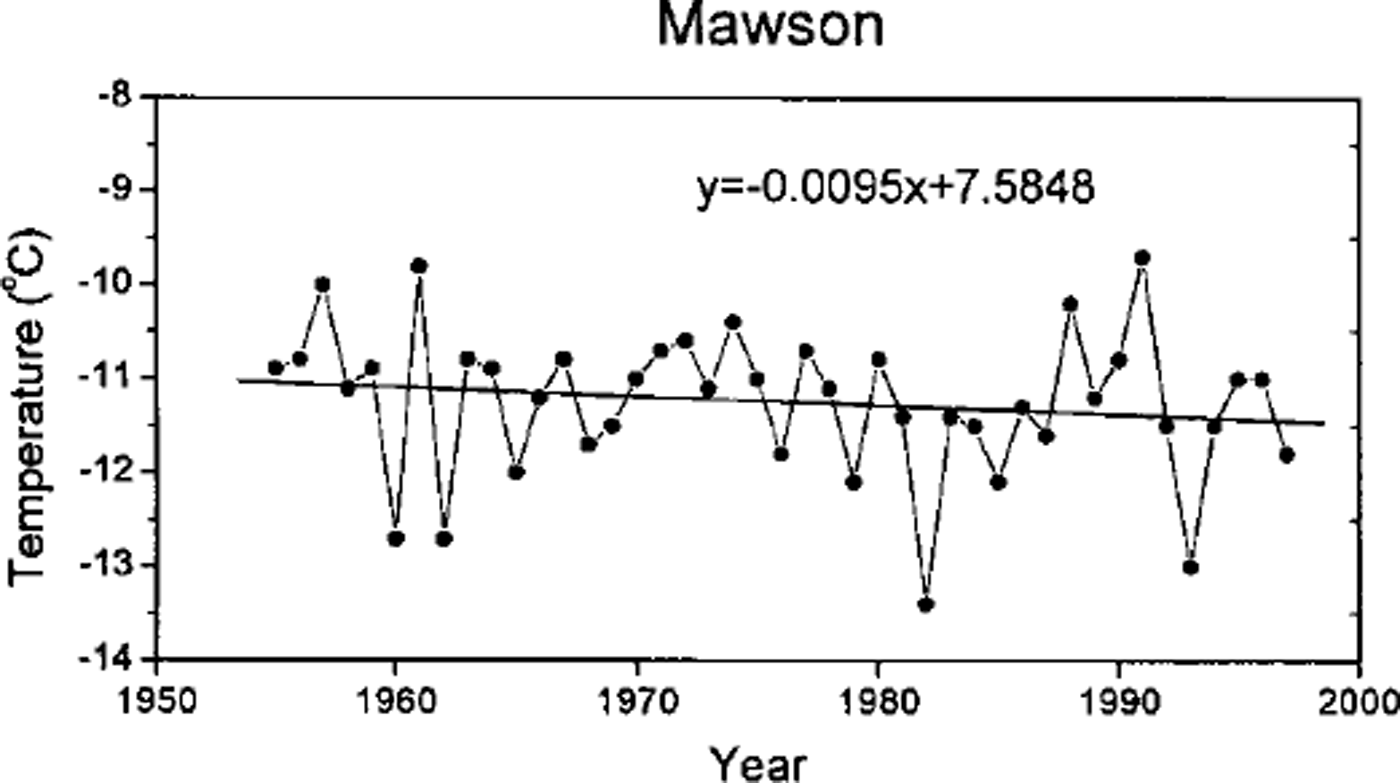
A worldwide warming over past decades has been extensively reported (Reference JonesJones, 1994; Reference Houghton, Filho, Callander, Harris, Kattenberg and MaskellHoughton and others, 1996). For the Antarctic region, there have also been many reports of temperature increase (e.g. Reference Pourchet, Pinglot and LoriusPourchet and others, 1983; Reference Peel and MulvaneyPeel and Mulvaney, 1988; Reference JackaJacka, 1990; Reference JonesJones, 1990; Reference Dahe and WentiQin and Wang, 1990; Reference Morgan, Goodwin, Etheridge and WookeyMorgan and others, 1991). To elucidate any link between temperature and decreased accumulation over the past decades in the Lambert Glacier basin, the temperature record at Mawson station is shown in Figure 6. The Mawson temperature has decreased since the 1950s. From this, and the isotope profiles discussed above, it can be tentatively concluded that the western part of the Lambert Glacier basin is an exceptional region, where temperature has been on the decrease (or at least there has been no significant increase) over past decades. This contrasts with the prevailing trend at the larger continental or hemispheric scale.
Mean annual temperature at Mawson station since 1954.
7. Conclusions
The distribution of the accumulation rate in the western Lambert Glacier basin has been derived from shallow cores, snow pits and cane accumulation data. The accumulation rate is not highest near the coast, in contrast to other areas such as Wilkes Land. There has been an overall decrease in the accumulation rate since the 1930s, although this decrease varies in amount (16-37%) from site to site. However, accumulation has generally been increasing since the late 1980s.
The mean «5180 and SD values in 2 m cores show a good linear relationship with the 10 m firn temperature. The slope of these relationships is similar to that along a route between Vostok and Mirny stations.
The isotope profiles for several 10-27 m cores from the region do not display a definite trend of temperature change over the past decades. A combination of temporal variability in the accumulation rate over this basin and the temperature record at Mawson station suggests that the western part of Lambert Glacier basin may have slightly cooled and become dryer since the 1930s. The potentially exceptional characteristics of the basin warrant more detailed study, and this should include deeper core drilling to reveal a longer history of climatic change over 100 years or so.
Acknowledgements
This work was supported by the National Natural Science Foundation of China (49271022), the Chinese Academy of Sciences (KZ951-A1-205) and the State Commission of Science and Technology of China (98-927-01-05). The Australian Antarctic Foundation provided part support for the first author tojoin the 1992-93 Lambert Glacier basin traverse.



