

Before Tim Scott, the American South had sent only two African Americans to the US Senate: Blanche K. Bruce and Hiram R. Revels, both of Mississippi (Foner Reference Foner1988). At the time of Scott’s 2013 appointment to the US Senate by Governor Nikki Haley, 132 years had passed since a black Southerner served in the upper chamber of the US Congress (i.e., Bruce in 1881). Like Bruce and Revels, Scott affiliates with the Grand Old Party (GOP); however, their shared party affiliation is perhaps all that Scott has in common with his Southern black Republican predecessors.
Scott did not take office and proceed to win election under the auspices of a Northern-engineered Republican Reconstruction-era electorate Footnote 1 (Black and Black Reference Black and Black2002). Only a small portion of adult-age South Carolinians is currently ineligible to vote; therefore, Scott’s support derives from a broad section of the general electorate. Furthermore, Scott owes his electoral success to white voters, not fellow black voters. He is a notable minority Republican in an overwhelmingly white-majority South Carolina GOP. Finally, Scott is a Deep South Republican, representing a party almost wholly distinct from and arguably antithetical to its Northern progenitor on matters of race. The GOP may be forever known as the “Party of Lincoln,” but its contemporary Southern cousin has been remarkably successful by embracing a strategy of racial conservatism (Phillips Reference Phillips1969) that has appealed to legions of white voters (Carmines and Stimson Reference Carmines and Stimson1989; Hillygus and Shields Reference Hillygus and Shields2009) and which primarily accounts for its current electorally dominant position throughout most of Dixie (Hood, Kidd, and Morris Reference Hood, Kidd and Morris2012)—especially the Deep South (McKee and Springer Reference McKee and Springer2015).
Within the context of contemporary Southern politics, the rise of Republican Tim Scott—an African American from a poor family who managed to climb the South Carolina electoral ladder—seems improbable. This study chronicled Scott’s political ascendancy because the electoral success of a black Republican can provide considerable insight on the current state of party politics in the American South. The article begins with a brief political biography, focusing particularly on the critical 2010 election to the US House of Representatives. Next, we use recent survey data from the Winthrop Poll to assess Scott’s coalition of supporters. We also evaluate the results of a survey experiment to determine whether placing Scott’s candidacy in two separate frames altered his approval. Finally, we conclude with a discussion of what the success of an African American Republican Senator in a Deep South state can impart about the complicated relationships among race, ideology, and partisanship in the contemporary American South.
THE RISE OF TIM SCOTT
A little more than a month after President Johnson signed the Voting Rights Act, on September 19, 1965, Tim Scott was born in North Charleston, South Carolina. He was raised by a single mother who worked long hours as a nurse’s assistant, and he got his first job when he was 13 (Barone and McCutcheon Reference Barone and McCutcheon2013). Preceding his political success—and likely directly contributing to it—Scott was a successful business entrepreneur who credited his good fortune to a Chick-fil-A franchise owner, John Moniz. He was a father figure who instilled in Scott the belief that rewards come with hard work, and Scott cited his influence in his brief speech at the 2012 Republican National Convention in Tampa, Florida (Barone and McCutcheon Reference Barone and McCutcheon2013).
Scott’s humble beginnings instilled in him a belief in economic individualism and a positive regard for the workings of the free market. Given his worldview, it is no surprise that Scott was embraced by Tea Party activists, who, like Scott, also place tremendous faith in the efficacy of free markets rather than the government. Of course, this philosophical outlook directly conflicts with the views of President Obama and most adherents of the Democratic Party—a party that represents the majority of voters along the lower end of the economic spectrum (Bartels Reference Bartels2008; Gelman et al. Reference Gelman, Park, Shor, Bafumi and Cortina2008). Scott catapulted into the national spotlight during the Great Recession, a fortuitous time for receiving strong backing from the growing ranks of Tea Party supporters who comprise a highly influential faction in the South Carolina GOP (Hood, Kidd, and Morris Reference Hood, Kidd and Morris2015; Huffmon, Knotts, and McKee Reference Huffmon, Gibbs Knotts and McKee2016).
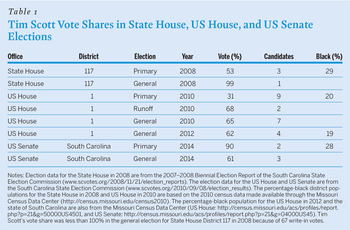
Scott’s political career began in 1995, when he won a special election for a seat on the Charleston County Council (CCC). Scott’s election was the first for a black Republican in any South Carolina office since Reconstruction—and this type of “first” would be repeated as he moved up the political-opportunity structure (Schlesinger Reference Schlesinger1966). Scott served on the CCC for 13 years Footnote 2 (1995–2008) before running for the open South Carolina State House District 117 seat in 2008. He faced two opponents in the GOP primary and won 53% of the vote, which ensured his election because he faced no opposition in the general-election contest (table 1).
Tim Scott Vote Shares in State House, US House, and US Senate Elections

Notes: Election data for the State House in 2008 are from the 2007–2008 Biennial Election Report of the South Carolina State Election Commission (www.scvotes.org/2008/11/21/election_reports). The election data for the US House and US Senate are from the South Carolina State Election Commission (www.scvotes.org/2010/09/08/election_results). The percentage-black district populations for the State House in 2008 and US House in 2010 are based on the 2010 census data made available through the Missouri Census Data Center (http://census.missouri.edu/census2010). The percentage-black population for the US House in 2012 and the state of South Carolina are also from the Missouri Census Data Center (US House: http://census.missouri.edu/acs/profiles/report.php?p=21&g=50000US4501, and US Senate: http://census.missouri.edu/acs/profiles/report.php?p=21&g=04000US45). Tim Scott’s vote share was less than 100% in the general election for State House District 117 in 2008 because of 67 write-in votes.
Scott’s biggest electoral challenge—and the race that launched him into the national spotlight—occurred in 2010, when he decided to run for the open US House District 1 seat, vacated by retiring Republican Congressman Henry Brown. Not only was there a crowded field in the GOP primary (i.e., eight opponents in addition to Scott), but also two of the contenders had an impressive political lineage: Carroll Campbell III—the son of former Governor Carroll Campbell, Footnote 3 and Paul Thurmond—the son of the legendary Senator Strom Thurmond. In the primary, Scott took a 31% plurality and faced off against Thurmond in the runoff. The runoff was a blowout, with Scott beating Thurmond by 30 percentage points.
How was Scott able to win this contest and be more appealing to Republican primary voters than his white opponents? Of course, there were many factors that contributed to Scott’s victory, but we identified the key dynamics of this important 2010 primary contest. First, Scott had active Tea Party support—from the likes of Sarah Palin and Jim DeMint. He was the candidate most aligned with the Tea Party, and he capitalized on the Tea Party wave that swept the country during the 2010 election cycle. Second, although the national Republican Party did not officially endorse a candidate, it was working to recruit and promote a diverse slate of candidates for the 2010 congressional contests; Scott received its support as well as key endorsements (Gardner Reference Gardner2010). Third, Scott held a special appeal for evangelical voters, an important constituency in his district—particularly in the Republican primary. He is a long-time member of Seacoast Church, a large multisite church based in Mount Pleasant, South Carolina. Fourth, Scott deliberately avoided talking about race in this contest. Reflecting on his victory, he remarked that the “relevance of me being black is really, fortunately, irrelevant” (Behre Reference Behre2010). Fifth, Scott was able to position himself to the right of Thurmond on fiscal issues, opposing all tax increases and earmarks (Gardner Reference Gardner2010). Assessing his victory, Scott noted that the “voters voted for a guy who they felt represented their values and their issues and their philosophy” (Behre Reference Behre2010). Finally, and perhaps most important, Scott had a history of representing a substantial share of US House District 1 voters during his time on the CCC and in the state legislature (Carson et al. Reference Carson, Crespin, Eaves and Wanless2011, Reference Carson, Crespin, Eaves and Wanless2012). Footnote 4
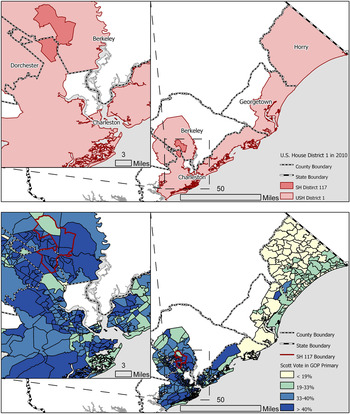
In winning the GOP nomination, Scott clearly benefited from the much higher vote shares in the parts of the district that he previously represented (i.e., the Charleston and Berkeley county areas including State House District 117).
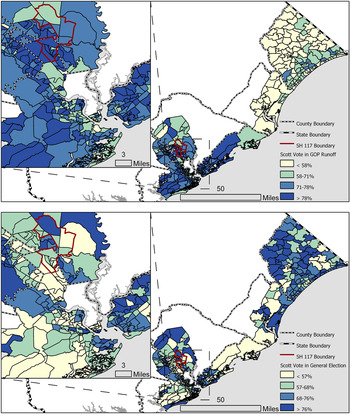
Figure 1 is a map of US House District 1 along with a map of Scott’s precinct-level vote shares in quartiles for the 2010 Republican primary. Figure 2 is a map of his precinct-level vote shares in quartiles for the 2010 GOP runoff along with a map of his vote shares in quartiles for the 2010 general election. To the left of each map is an inset that provides greater detail for the most densely populated Charleston and Berkeley county precincts. Also, the boundary of State House District 117 is highlighted because it was the most recent population that Scott represented when he ran for US House District 1. This visual progression of maps makes it clear where the geographic basis of Scott’s support resided. In winning the GOP nomination, Scott clearly benefited from the much higher vote shares in the parts of the district that he previously represented (i.e., the Charleston and Berkeley county areas including State House District 117). It is interesting, however—as shown in the general-election map in figure 2—that the areas of strength in the nomination contest were no longer as supportive of Scott in the general election because of the changing composition of the electorate. Indeed, Scott was strongest in the notably more rural and white Horry County (where he captured 69% of the vote)—the county in which he had the least support for capturing the GOP nomination.
US House District 1 in 2010: Maps of the District and Tim Scott Vote in the GOP Primary

US House District 1 in 2010: Maps of Tim Scott Vote in GOP Runoff and General Election

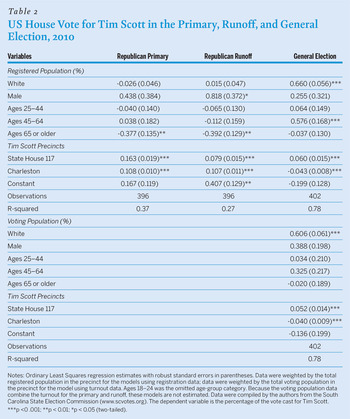
To more closely examine the critical 2010 congressional contest, we used precinct-level voting data for the 2010 Republican primary, the Republican runoff, and the general election. The dependent variable for each model was the vote percentage for Scott. Seven independent variables based on the registered population are included: percentage white, percentage male, percentage ages 25-44, percentage ages 45-64, percentage ages 65 or older (percentage ages 18–24 is the omitted category), a dummy variable indicating whether the precinct was located in an area that Scott had represented during his time on the county council (i.e., the CCC), and a dummy variable indicating whether the precinct was located in an area that Scott represented during his time in the state legislature (i.e., State House District 117).
As shown in table 2, the variables for the “Tim Scott” precincts were positive and significant in six of eight cases. The only exception was in the general election, when the Charleston dummy variable was negative and significant, reflecting the shift in support displayed in figure 2. It is also important that the percentage-white variable was positive and significant in the general-election models—a dynamic expected for any Republican contesting a general election. In the primary and runoff elections, the percentage voting is combined; therefore, we could not run a regression based solely on the voting population. We could do so with the general-election data, and this model is similar to the previous model based on the registered population (except that none of the age categories register significance). This account of the 2010 congressional elections for US House District 1 reveals that Scott’s representational ties to parts of the district elevated him to the GOP nomination. In the general contest, it was practically a certainty that a quality GOP nominee would prevail in a district that Republican John McCain won in 2008 with 57% of the presidential vote (Barone and McCutcheon Reference Barone and McCutcheon2011).
US House Vote for Tim Scott in the Primary, Runoff, and General Election, 2010

Notes: Ordinary Least Squares regression estimates with robust standard errors in parentheses. Data were weighted by the total registered population in the precinct for the models using registration data; data were weighted by the total voting population in the precinct for the model using turnout data. Ages 18–24 was the omitted age-group category. Because the voting population data combine the turnout for the primary and runoff, these models are not estimated. Data were compiled by the authors from the South Carolina State Election Commission (www.scvotes.org). The dependent variable is the percentage of the vote cast for Tim Scott.
*** p <0 .001; **p < 0.01; *p < 0.05 (two-tailed).
Scott did not draw a primary opponent in his 2012 reelection bid and carried 62% of the vote in the redrawn US House District 1 in the general election. In January 2013, Governor Haley appointed Scott to the US Senate seat vacated by DeMint, who unexpectedly resigned to head the Heritage Foundation. Haley selected Scott from a short list of candidates that included Representative Trey Gowdy, former state Attorney General Henry McMaster, former state First Lady Jenny Sanford, and state Department of Health and Environmental Control Director Catherine Templeton (Blake and Cillizza Reference Blake and Cillizza2012). Most experts expected Haley to name Scott; he was reportedly DeMint’s choice, and Scott’s appointment would make him the only African American in the Senate at that time and the first black Republican in the Senate since the late Edward Brooke of Massachusetts in the 1970s (Blake Reference Blake2012).
In November 2014, Scott ran in the special Senate election to retain his seat for the two years remaining on DeMint’s term. He drew an obscure primary opponent, Randall Young, who did not spend a single campaign dollar and lost 90% to 10%. The general election was a foregone conclusion, with Scott garnering 61% against his African American Democratic challenger Joyce Dickerson and third-party candidate Jill Bossi. A unique aspect of the 2014 contest was that there were two contested Senate elections on the ballot at the same time. In addition to the Scott election, incumbent Republican Senator Lindsey Graham was up for reelection. In a previous study, we discovered that the determinants of electoral support for Scott and Graham were nearly identical (Huffmon, Knotts, and McKee Reference Huffmon, Gibbs Knotts and McKee2016). In fact, one of the few differences was that Tea Party backers and racial conservatives were significantly more supportive of Scott, but Tea Party support and racial conservatism did not affect support for Graham (Huffmon, Knotts, and McKee Reference Huffmon, Gibbs Knotts and McKee2016).
Throughout his political career, Scott has never relied on a biracial coalition of voters to secure his tenure in public office. This was the winning formula for most Deep South Democrats in the 1970s and 1980s, when white voters continued to exit the party in favor of the GOP (Black and Black Reference Black and Black2002; Lamis Reference Lamis1984). African Americans constitute 28% of the Palmetto State’s population; the highest percentage of blacks that Scott has represented since 2008 was 29% in his state legislature seat (see table 1). Scott’s race seems to be the only distinguishing characteristic of his otherwise standard Republican coalition-building strategy. Nonetheless, it bears investigating which types of groups in the South Carolina electorate support Scott and, furthermore, which groups register their approval of his performance in office.
SURVEYING SOUTH CAROLINIAN OPINIONS ON TIM SCOTT
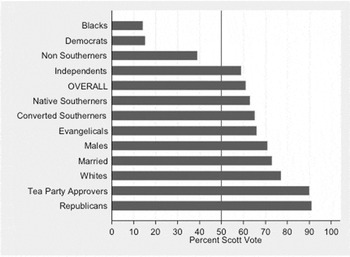
We begin by examining electoral support for Scott across a range of groups. The information in figure 3 is from the October 2014 Winthrop Poll, a survey that captured opinions of likely voters in South Carolina immediately before the 2014 election. For comparison, we also include Scott’s level of electoral support for the entire electorate (i.e., 61%), as indicated by “OVERALL” in figure 3.
Tim Scott US Senate Vote Across a Range of Groups
Source: Winthrop Poll, October 2014.

Scott had the lowest levels of electoral support from Blacks, Democrats, and Non-Southerners at 14%, 15%, and 39%, respectively. In fact, these groups were expected to provide limited support to a Republican candidate. At 59%, Independents indicated slightly less support than Scott received across the entire electorate. Also, 60% to 65% of Native Southerners, Evangelicals, and Converted Southerners indicated that they planned to vote for Scott. Married voters and Whites also showed considerable electoral support for Scott at 73% and 77%, respectively. Electoral support for Scott among Tea Party Approvers and Republicans was the highest, at slightly more than 90%.
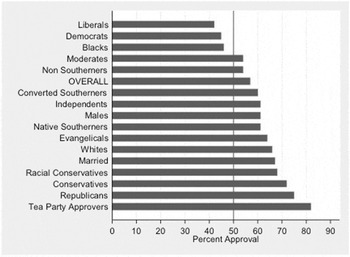
We now turn to the basic approval rating of Scott using results from the November 2014 Winthrop Poll. This general-population poll was conducted shortly after Scott’s successful election to fill the remainder of Senator DeMint’s term. The numbers reported in figure 4 represent the percentage of respondents who approved of Scott among various different groups. Liberals, Democrats, and Blacks had the lowest approval for Scott, less than 50%. Moderates and Non-Southerners also were below the overall approval level in the electorate (i.e., 57%), both at 54%. Five groups fell between the 60% and 64% approval range (i.e., Converted Southerners, Independents, Males, Native Southerners, and Evangelicals). Whites, Married respondents, and Racial Conservatives were in the next tier, with 66%, 67%, and 68% approving, respectively. The groups with the highest approval ratings for Scott were Conservatives, Republicans, and Tea Party Approvers.
Tim Scott Approval Across a Range of Groups
Source: Winthrop Poll, November 2014.

RESULTS OF A SIMPLE EXPERIMENT
In the previous analysis, Scott’s success as a minority politician in the Republican Party had much less to do with his race and far more with the public’s perception of him as a conservative—and perhaps carrying strong Tea Party credentials. To further test this relationship, we devised a survey-based experiment in which respondents’ positive or negative feelings about Scott were measured within one of two randomly applied frames. The experiment was included in an April 2014 general-population poll. The question and corresponding frames were as follows:
-
• “Now I’m going to read you the names of several public figures and groups. I’d like you to rate your feelings toward each one as very positive, somewhat positive, neutral, somewhat negative, or very negative. If you don’t know the name, please just say so…”
-
• Version 1: “United States Senator and Tea Party favorite Tim Scott.”
-
• Version 2: “United States Senator Tim Scott, the first African American Senator from South Carolina since Reconstruction.”
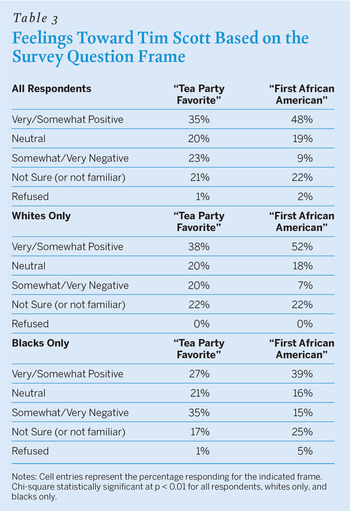
As table 3 demonstrates, the frames garnered significantly different responses. For all respondents, the Tea Party Favorite (TPF) elicited positive responses (i.e., “very” and “somewhat” combined) from only 35% of respondents, whereas the First African American (FAA) elicited positive responses from 48%. For Whites Only, the positive feelings increased from 38% for the TPF frame to 52% for the FAA frame. For Blacks Only—one of the primary groups not aligned with Scott—only 27% offered positive responses under the TPF frame, whereas 39% had positive feelings about the Republican senator under the FAA frame. In each case, there was a statistically significant difference in support for Scott across the two frames.
For all respondents, the Tea Party Favorite (TPF) elicited positive responses (i.e., “very” and “somewhat” combined) from only 35% of respondents, whereas the First African American (FAA) elicited positive responses from 48%.
Feelings Toward Tim Scott Based on the Survey Question Frame

Notes: Cell entries represent the percentage responding for the indicated frame. Chi-square statistically significant at p < 0.01 for all respondents, whites only, and blacks only.
We think these findings reveal much about racial politics in the modern South. Although whites are certainly more favorable toward Scott than blacks, the shift from the TPF frame to the FAA frame had similar effects across both racial categories. Looking at only the “very/somewhat” positive category for both frames, the increase was 14 percentage points for whites and 12 percentage points for blacks when moving from the TPF frame to the FAA frame. Thus, it clearly matters whether a respondent is prompted to view Scott within the lens of a factional group that is not widely popular versus the historic significance of an African American holding a US Senate seat in a Southern state. Of course, the racial gap in feelings toward Scott—irrespective of the frame—is tied primarily to the Senator’s allegiance to the GOP, a party of which few black South Carolinians approve or with whom they identify.
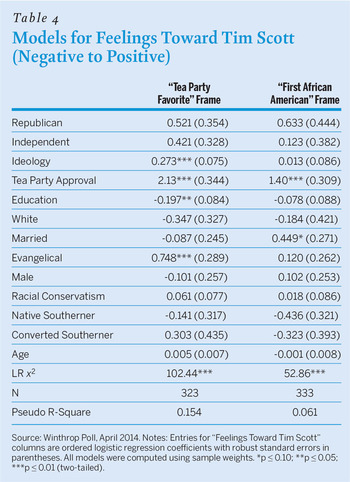
The data in table 3 suggest that the broader and politically historic framing of Tim Scott generates a more favorable impression of him. By contrast—although we demonstrate that respondents approving of the Tea Party are the most supportive of him (see figure 4)—this is a faction closely aligned with the Republican Party that is not representative of most GOP adherents, much less the broader South Carolina electorate. In other words, these data show that a directly applied Tea Party frame negatively influences support for Scott. To test this further, we modeled respondents’ feelings toward Scott. Because they were measured on a five-category-scale dependent variable (i.e., “very negative” to “very positive”)—rather than a dichotomous measure of approval or vote choice—we ran an ordered logistic regression. Table 4 estimated two models, with the only difference being that the first consists of respondents who received the TPF frame and the second is limited to respondents given the FAA frame.
Models for Feelings Toward Tim Scott (Negative to Positive)

Source: Winthrop Poll, April 2014. Notes: Entries for “Feelings Toward Tim Scott” columns are ordered logistic regression coefficients with robust standard errors in parentheses. All models were computed using sample weights. *p ≤ 0.10; **p ≤ 0.05; ***p ≤ 0.01 (two-tailed).
Our models account for many of the standard predictors of vote choice and approval, including dummy variables for Republicans, Independents, Whites, Married respondents, Evangelicals, and Tea Party supporters. We also include Ideology (i.e., “extremely liberal” to “extremely conservative”); and, given the unique brand of politics in the American South, we also added regional identity dummies for Native Southerners and Converted Southerners. These variables were based on how respondents answered the question: “Which of the following best describes your regional identity?” Respondents were given four choices: Non-Southerner, Converted Southerner, Native Southerner, and Not Sure. (For readers not familiar with the term, “Converted Southerner” is used to identify someone who relocated to the South and, over time, identifies as a Southerner.) In addition, we included a proxy for Racial Conservatism. This variable was created based on the response to the standard American National Election Studies question: “Do you feel that generations of slavery and discrimination do or do not make it difficult for blacks to work their way out of the lower class?” The response categories for this question were as follows: 1 = Strongly DO make it difficult; 2 = Somewhat DO make it difficult; 3 = Neutral [“Not Sure/Don’t Know” also comprise a 3 response]; 4 = Somewhat do NOT make it difficult; and 5 = Strongly do NOT make it difficult. We added two other frequently used demographic variables: Education and Age. Footnote 5
Because the idea of “positive” or “negative” feelings taps a concept similar to approval, we expected most of the variables to function as they would in an approval model—especially because we surveyed the general public, not only likely voters. As displayed in table 4, Tea Party Approval had a significant positive impact on support for Scott in both models, whereas Republican, Independent, White, Male, Racial Conservatism, Native Southerner, and Converted Southerner did not achieve statistical significance in either of the two models.
However, there were differences in the results for the two models. Specifically, Ideology was positive and significant in the TPF frame but not in the FAA frame. Even after controlling for several factors, ideological conservatives were more likely to view Scott positively when he was described as a “Tea Party Favorite.” Education also was statistically significant in the TPF model but not in the FAA model; however, this effect was negative. Higher-educated respondents were less likely to rate Scott positively when he was described as a “Tea Party Favorite.” Finally, the Evangelical variable was positive and significant in the TPF model but it did not achieve statistical significance in the FAA model. Evangelicals rated Scott more positively than non-Evangelicals when he was described as a “Tea Party Favorite” but not when he was described as South Carolina’s “first African American Senator since Reconstruction.” Footnote 6
CONCLUSION
In 2014, South Carolina had 11 statewide offices up for election, and there was two-party competition in eight of them. At 61% of the vote, Scott garnered the largest share of any candidate running statewide in a two-party contested race. By comparison, Governor Haley won 56% and Senator Graham amassed only 54%. Footnote 7 In terms of electoral performance, Scott proved to be the most popular candidate in these contested statewide elections. Furthermore, according to the exit poll of South Carolina voters, Haley captured 76% of the white vote and 6% of the black vote and Graham took 74% of the white vote and 6% of the black vote. Scott, the freshest face on the statewide South Carolina stage, was backed by 82% of whites and 10% of African Americans. Footnote 8
Tim Scott’s political rise is a remarkable story with broader implications for electoral politics in the American South. First, Scott is the genuine conservative article: his political philosophy closely matches the prevailing views of a wide swath of the South Carolina electorate. Second, his party affiliation and political positioning make him highly representative of the typical white Southern Republican; accordingly, he draws only modest black support. However, like the majority of white Republican politicians in the South—and particularly the Deep South—Scott draws an overwhelming share of the white vote. His core supporters hail from the most conservative segments of the Republican base, particularly self-identified conservatives and those approving of the Tea Party.
Scott’s electoral success makes us wonder about the possibility of other politically ambitious African Americans affiliating with the GOP. Recent scholarship, including this study, already makes it clear that white Republicans do not discriminate against high-profile (i.e., senatorial and gubernatorial) minority GOP candidates (Hood and McKee Reference Hood and McKee2015). If these contenders are appropriately conservative, then it seems that increasingly more can win Republican primaries and have a strong chance of winning the general-election contest, if the political setting is favorable (e.g., a red state). At present, there are a few black Republican state legislators serving in heavily Republican states such as Texas and Louisiana. In these deep-red contexts—and it does not get any redder than the Deep South—it is quite possible for African American Republicans to climb the electoral ladder much like Tim Scott. Footnote 9
ACKNOWLEDGMENTS
We presented an earlier version of this article at the 73rd Annual Meeting of the Midwest Political Science Association (MPSA). We thank our MPSA discussant Stella Rouse and the anonymous reviewers for their useful suggestions. We also thank Allie Briggs, the Social & Behavioral Research Lab Operations Manager, as well as Winthrop University and The West Forum on Politics and Policy, for their financial support. Finally, we are indebted to Richard McKenzie for producing the maps displayed in figures 1 and 2.