I. INTRODUCTION
Currently, the market for light emitting diodes (LEDs) is constantly growing and the state-of-the-art devices reach photon extraction efficiencies of about 80% for LEDs with active InGaN layers. Reference Krames, Shchekin, Mueller-Mach, Mueller, Zhou, Harbers and Craford1 Nevertheless, it is desirable to further increase the efficiency and reduce the production costs. For that, the reduction of droop, which is the decrease of efficiency with higher current densities, would be very desirable. The three-dimensional (3D) core–shell microrod structures represent one approach to reach this aim. Reference Waag, Wang, Fündling, Ledig, Erenburg, Neumann, Al Suleiman, Merzsch, Wei, Li, Wehmann, Bergbauer, Straßburg, Trampert, Jahn and Riechert2–Reference Jung, Bae, Lee, Kim, Lee, Honda and Amano5 The defect density of these structures is low due to their small footprint on the substrate. Beyond this, the small footprint improves the crystal quality irrespective of the substrate material. Additionally, the active area of microrod LED structures can exceed their substrate area because the InGaN quantum wells (QWs) are wrapped around the microrods. Since aspect ratios of 10–40 can be reached, this results in a drastic increase of the light emitting area, and hence to a drastic reduction of the current density at the same total currents, which also reduces the droop. Standard planar LEDs are currently grown in the c-axis GaN direction leading to polar InGaN-QWs. Therefore, their emission properties are influenced by the quantum confined Stark effect (QCSE) which results in band bending and the separation of electron and hole wave functions. Reference Takeuchi, Sota, Katsuragawa, Komori, Takeuchi, Amano and Akasaki6 For 3D structures, the growth of QWs on the nonpolar m-plane sidewalls of GaN cores reduces the impact of the QCSE due to the lack of spontaneous and piezoelectric polarization in this direction. Therefore, the better overlap of the wave functions leads to faster recombination dynamics Reference Waltereit, Brandt, Trampert, Grahn, Menniger, Ramsteiner, Reiche and Ploog7–Reference Seo Im, Kollmer, Off, Sohmer, Scholz and Hangleiter9 and at the same time increases the absorption. Reference Kölper, Sabathil, Römer, Mandl, Strassburg and Witzigmann10
For the optical characterization of LED structures, two types of laser systems are typically used. The time-integrated photoluminescence (PL) measurements are normally performed with continuous wave (cw) lasers, while for the time-resolved measurements a pulsed laser is necessary. Both methods give valuable complementary information. However, pulsed lasers with short pulses and low repetition rates can reach high pulse powers in the range of MW or even higher, which results in irreversible modifications of the GaN surface region. Reference Kim, Kim, Hetterich, Jones, Girkin, Bente and Dawson11–Reference Schneider13 Therefore, it is mandatory to study the impact of laser pulses on the integrity of the quantum structure under investigation.
In this paper, we study the changes of the PL intensity and the decay dynamics of 3D core–shell microrods and a 2D InGaN/GaN structure as a function of the energy density per pulse to gain insight into potential irreversible sample modifications. The time-integrated and time-resolved PL measurements were performed for different energy densities of the excitation pulses, and the PL spectra and their transients were compared for both the samples. Furthermore, we investigated the temperature dependence of the recombination dynamics of the InGaN luminescence for both structures and determined the decay time τ from the transients. The decay time τ is a compound of the radiative and nonradiative lifetimes of the excited charge carriers in InGaN
 $${1 \mathord{\left/ {\vphantom {1 \tau }} \right. \kern-\nulldelimiterspace} \tau } = {1 \mathord{\left/ {\vphantom {1 {{\tau _{\rm{r}}}}}} \right. \kern-\nulldelimiterspace} {{\tau _{\rm{r}}}}} + {1 \mathord{\left/ {\vphantom {1 {{\tau _{{\rm{nr}}}}}}} \right. \kern-\nulldelimiterspace} {{\tau _{{\rm{nr}}}}}}\quad .$$
The radiative lifetime as a function of temperature depends on the dimensionality d of the excess charge carriers according to Reference Langer, Klisch, Alexej Ketzer, Jönen, Bremers, Rossow, Meisch, Scholz and Hangleiter8
 $${\tau _{\rm{r}}} \propto {T^{{d \mathord{\left/ {\vphantom {d 2}} \right. \kern-\nulldelimiterspace} 2}}}\quad .$$
For two-dimensional structures like QWs, one can find a linear dependence of the radiative lifetime on the temperature for the recombination of electrons and holes and of free excitons. Reference Langer, Klisch, Alexej Ketzer, Jönen, Bremers, Rossow, Meisch, Scholz and Hangleiter8,Reference Feldmann, Peter, Göbel, Dawson, Moore, Foxon and Elliott14–Reference Rosales, Bretagnon, Gil, Kahouli, Brault, Damilano, Massies, Durnev and Kavokin17 The nonradiative lifetime is normally decreasing with increasing temperature and starts to dominate the decay dynamics after a certain temperature has been reached. Reference Langer, Klisch, Alexej Ketzer, Jönen, Bremers, Rossow, Meisch, Scholz and Hangleiter8,Reference Lefebvre, Allègre, Gil, Kavokine, Mathieu, Kim, Salvador, Botchkarev and Morkoç16–Reference Marcinkevičius, Kelchner, Kuritzky, Nakamura, Denbaars and Speck18 Consequently, we expect a decrease of the decay time τ for higher temperatures.
II. EXPERIMENT
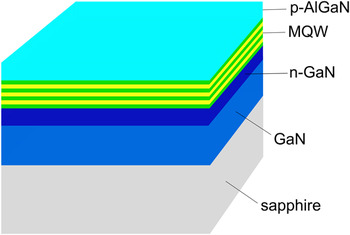
The LED structures were grown by metal organic vapor phase epitaxy (MOVPE) on GaN/Sapphire substrates in a 3 × 2″ Thomas Swan Close Coupled Showerhead system (AIXTRON Ltd., Herzogenrath, Germany). The planar structure consists of an n-GaN buffer layer grown directly on the substrate followed by a 3-fold InGaN/GaN multiquantum well (MQW). Mg-doped p-AlGaN, with an Al content of less than 10%, is used as a capping layer and as a barrier for the electrons in the MQW. The schematic structure of the sample is shown in Fig. 1.
Schematic structure of the planar sample.

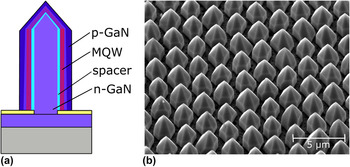
The 3D microrod sample was fabricated by continuous flux selective area MOVPE growth (SAG) through a SiO x mask on a substrate template previously overgrown with n-GaN. The core of the rods consists of n-doped GaN followed by a GaN spacer layer and a 5-fold InGaN/GaN MQW, which forms a shell mainly on the nonpolar sidewalls but also on the semipolar tips. The MQW is finally capped with a not intentionally doped GaN layer. The growth process is described in detail in Ref. Reference Wang, Li, Mohajerani, Ledig, Wehmann, Mandl, Strassburg, Steegmüller, Jahn, Lähnemann, Riechert, Griffiths, Cherns and Waag19. Figure 2(a) shows a schematic sketch of a single microrod structure, while Fig. 2(b) shows a scanning electron microscopy (SEM) image of the sample under investigation. The growth of the microrods is homogeneous over large areas of the sample with just slight differences in the geometrical dimensions. The diameter ranges from 1.7 to 1.9 µm, and the height varies between 2.6 and 3 µm.
(a) Schematic cross section of a microrod with core–shell configuration and (b) an SEM image of the investigated 3D sample, tilted by 40°.

The time-integrated PL measurements under continuous excitation were carried out with a HeCd laser (λ = 325 nm, P out = 20 mW) for a basic optical characterization, regarding the homogeneity and concentration of In in the QWs. Additional time-integrated and time-resolved PL measurements under pulsed excitation were performed using a femtosecond laser system (Solstice, Spectra Physics, Santa Clara, California) combined with an optical parametric amplifier (TOPAS-Prime, Light Conversion, Vilnius, Lithuania) with a pulse length Δt of ∼100 fs and a repetition rate of 1 kHz. The diameter of the laser spot on the sample was estimated to be ∼5 µm. The pulse power used for the excitation was varied from 0.02 to 46 MW (corresponding to an energy density of 0.01 J/cm2 to 23 J/cm2 per pulse) by using neutral density filters. The measurements were performed at room temperature and the laser system was tuned to λ = 325 nm to have a similar wavelength as the continuous HeCd laser resulting in the excitation of both the GaN layers and the InGaN QWs. For the detection of the time-integrated PL, an Acton SP2300 spectrometer (Princeton Instruments, Trenton, New Jersey) equipped with a liquid-nitrogen cooled charged-couple device camera was used. For the time-resolved PL measurements, a streak camera (SC-10, Optronis, Kehl, Germany) attached to the second output port of the same spectrometer was used. The sample was placed inside a continuous flow microcryostat such that the sample temperature could be controlled in the range of 77–300 K (cooling with liquid nitrogen).
III. RESULTS
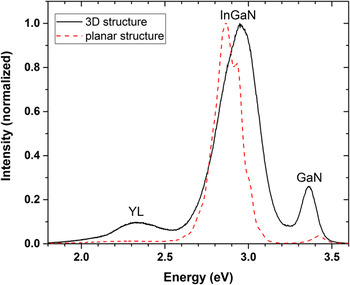
Figure 3 shows continuously excited time-integrated PL spectra of the 3D structure (solid curve) and the planar structure (dashed curve) obtained with the HeCd laser as the excitation source (photon energy 3.81 eV) at room temperature.
Normalized PL spectra of the 3D LED (solid) and planar structure (dashed) excited with the HeCd laser at room temperature.

Both the spectra are dominated by the InGaN luminescence peak (maximum at 2.95 eV for the 3D structure and at 2.87 eV for the planar sample, respectively). From these energy positions, indium concentrations of about 12 and 14% can be inferred. In the spectrum of the 3D structure (solid curve) also, the GaN luminescence is clearly visible at 3.36 eV, and at the low energy side of the InGaN band, the yellow defect luminescence (YL) can be identified. The YL is hardly visible in the spectrum of the planar sample (dashed curve) and the additional peak on the high-energy side at 3.42 eV is blue-shifted by about 0.06 eV compared to the energy position of the GaN peak of the microrod structure. It can be assigned to the top p-AlGaN layer of the planar sample with its Al concentration being well below 10%. The InGaN peak of the planar sample shows additional weak modulations which are most probably caused by the Fabry–Perot interference.
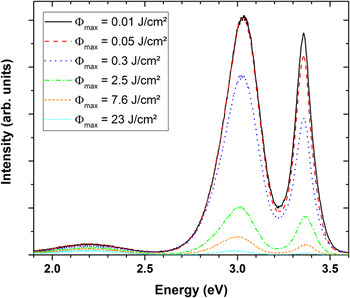
In Fig. 4, the PL spectra of the 3D sample taken under excitation with the fs-laser system are shown (room temperature, photon energy 3.81 eV, pulse length Δt = 100 fs). The spectrum shown as a solid curve was taken for an energy density of 0.01 J/cm2 per pulse (laser spot size ∼5 µm). Compared to the spectrum in Fig. 3 (also solid curve) taken under cw excitation, the energy positions of the GaN and InGaN peaks (Fig. 4: 3.36 and 3.04 eV, respectively) are almost identical, but the relative intensity of the GaN emission compared to that of the InGaN emission is substantially stronger for the spectrum taken under pulsed excitation. If the energy density per pulse is now increased to 0.05 J/cm2 for a few seconds and then reduced to the previous value of 0.01 J/cm2, we find a small but permanent change of the absolute intensity of the GaN emission band (long dashed curve). If we repeat this process but increase the energy density temporally to 0.3 J/cm2 before returning to the original 0.01 J/cm2, the permanent intensity reduction of the PL emission is drastically increased and now visible for both the GaN and InGaN luminescence bands (long dotted curve). It is important to stress that all the spectra shown in Fig. 4 were recorded using the same energy density of 0.01 J/cm2 per pulse and under the same conditions after the sample had been exposed (for a few seconds) to the energy density indicated for each spectrum in the figure.
PL spectra of the 3D LED structure excited with an energy density of 0.01 J/cm2 per pulse after excitation with the given maximum energy densities at room temperature.

For the 3D structure, the reduction of the PL intensity is similar for the GaN and InGaN peaks, the intensity ratio of the two luminescence peaks underlies just small variations, and the shape of the spectra is not influenced. For the planar structure, the PL intensity also decreases after excitation with more than 0.05 J/cm2, but there is also a significant change in the intensity ratio of the AlGaN and InGaN luminescence peaks after the maximum energy density was increased to 2.5 J/cm2. The decrease of the InGaN PL intensity is much more pronounced than the one of the AlGaN PL intensity. After the optically initiated high-energy density degradation, the AlGaN PL dominates the spectrum (not shown here).
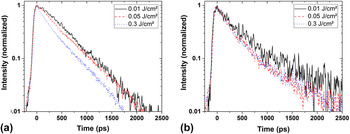
In addition to the time-integrated PL measurements, time-resolved studies were performed to characterize the PL decay dynamics and compare them for the 2D and 3D structures. Figure 5(a) shows the InGaN PL transients of the 3D microrod structure, and Fig. 5(b) shows the InGaN PL transients of the planar structure for different energy densities per laser pulse. For all transients, the intensity of the InGaN peak has been integrated over the energy range around the maximum where the intensity values are above (I max/e). The initial increase of the intensity for t < 0 ps is nearly identical for all spectra in the two graphs. For the 3D structure, the transients can be well fitted with a monoexponential decay
 $$I = {I_0}{e^{{{ - t} \mathord{\left/ {\vphantom {{ - t} \tau }} \right. \kern-\nulldelimiterspace} \tau }}}\quad ,$$
with the initial intensity I 0 at t = 0 and the decay time τ. For the lowest excitation energy density (0.01 J/cm2), a decay time of (526 ± 30) ps was determined and it reduces to (316 ± 30) ps as the energy density per pulse is increased to 0.3 J/cm2. The error is mainly determined by the temporal resolution of the Streak camera and the accuracy of the monoexponential fit of the transients (done with the MATLAB fitting tool, MathWorks, Inc., Natick, Massachusetts). The recombination dynamics of the planar structure, on the other hand, show a biexponential behavior
 $$I = {I_1}{e^{ - {t \mathord{\left/ {\vphantom {t {{\tau _1}}}} \right. \kern-\nulldelimiterspace} {{\tau _1}}}}} + {I_2}{e^{ - {t \mathord{\left/ {\vphantom {t {{\tau _2}}}} \right. \kern-\nulldelimiterspace} {{\tau _2}}}}}\quad .$$
InGaN PL transients of (a) the 3D structure and (b) the planar structure excited with 3.81 eV photon energy and with different energy densities per pulse.

The fast decay time τ1 reduces from (305 ± 50) ps to (166 ± 50) ps with increasing energy density, while the slow decay time τ2 stays roughly constant (4.1–4.6 ± 0.5) ns. Due to the biexponential behavior with twice the number of variables, the uncertainty of the fit is much higher than for the monoexponential one and therefore a larger error of about ±50 ps has to be assumed. The fast decay time of the planar structure is in the same order of magnitude as the decay time of the 3D LED, and in both cases, a reduction to about half of the value measured for the lowest energy density is observed.
As the results presented so far show that significant permanent modifications of the samples occur for energy densities above 0.25 J/cm2, an energy density of 0.05 J/cm2 was chosen for all further investigations to ensure that no irreversible modification was induced in the samples.
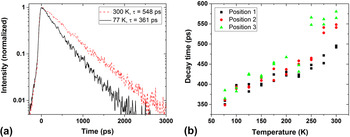
Figure 6 shows the temperature dependence of the PL decay in the InGaN QWs of the microrod structure. In Fig. 6(a), the transients measured at 77 K (solid line) and 300 K (dashed line) with a photon energy of 3.81 eV and an energy density per pulse of 0.05 J/cm2 are shown. The InGaN PL measured at 77 K decays faster than that at room temperature, with the decay times determined to be (361 ± 30) ps for 77 K and (548 ± 30) ps for 300 K from monoexponential fits, respectively. Figure 6(b) shows the decay times τ of the InGaN PL for temperatures between 77 and 300 K. For each temperature, two measurements were performed at three different positions on the sample (6 measurements in total for each temperature) to study the homogeneity of the structure and the repeatability of the determined decay time. At all three positions, the decay time of the InGaN PL becomes larger with increasing temperature with the smallest value being 348 ps (at 77 K) and the largest value being 581 ps (at 300 K), respectively. With an assumed error of ±30 ps for the individual decay times and in consideration of this error, the two calculated values of τ for each position and temperature coincide.
(a) InGaN PL transients of the 3D structure excited with 3.81 eV photon energy and an energy density of 0.05 J/cm2 at 77 K (solid) and 300 K (dashed) and (b) the InGaN PL decay time for different temperatures and three different positions on the sample.

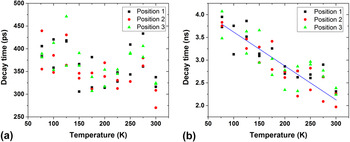
Also for the planar sample, the dependence of the InGaN PL dynamics on the temperature was investigated and the obtained transients were fitted with a biexponential function as described above. In Fig. 7(a), the short decay time τ1 of three different positions is shown for temperatures between 77 and 300 K and in Fig. 7(b) the long decay time τ2 for the same positions is shown. The sample was excited with laser pulses of 0.05 J/cm2 energy density and a photon energy of 3.81 eV. Again for every position and temperature, the measurement was performed twice.
(a) Short decay time and (b) long decay time of the InGaN PL at three different positions on the planar structure excited with 3.81 eV photon energy and an energy density of 0.05 J/cm2.

The short decay time [Fig. 7(a)] fluctuates and overall there is just a slight decrease with increasing temperature. In total, the values of the short decay times range between 270 and 471 ps. Each determined value has a measurement uncertainty of about ±50 ps. When comparing the scattering of decay times for each temperature as plotted in Fig. 7(a) with that in Fig. 6(b), we find that the repeatability in determining τ is much better for the microrod structure (monoexponential fit) than for the planar sample (biexponential fit required). For the microrod structure, the uncertainty mainly arises from the temporal resolution of the streak camera and the stability of the whole measurement system.
For the long decay time of the InGaN luminescence, a clear tendency is visible. The line in Fig. 7(b) is given as a guide to the eye. With increasing temperature, the long decay time is decreasing. Here, the values are between 4.1 and 2.0 ns with an error of ±0.5 ns.
IV. DISCUSSION
The measurements with the HeCd laser (Fig. 3) show that for this excitation the PL spectra of both samples are dominated by the InGaN luminescence band. The indium concentration estimated from the PL spectra in the planar structure should be around 2% higher than one of the 3D samples, which would not be surprising since growth conditions on the m- and c-plane differ substantially. For the microrod structure the GaN luminescence peak was clearly visible, whereas the AlGaN emission line of the planar sample only shows up as a much weaker emission maximum which can be explained by the different thicknesses of the respective layers (GaN capping in the 3D sample: 200 nm; p-AlGaN capping in the 2D sample: 20 nm).
The energy density dependent measurements shown in Fig. 4 revealed that irreversible modifications of the sample took place after a certain energy density threshold had been reached. Exciting the sample with an energy density of 0.3 J/cm2 for just a few seconds is enough to permanently change the luminescence intensity when going back to a low energy density of 0.01 J/cm2. The changes in the spectra are significantly more pronounced after excitation with 2.5 J/cm2 energy density per pulse. For the 3D sample, we see a clear drop of the intensity, and for the planar sample, in addition, the intensity ratio of the maximum AlGaN PL intensity to that of the InGaN PL changes completely (InGaN degrades much faster). In previous experiments, we could show modification thresholds for the c-plane GaN on Sapphire under radiation with a wavelength of 795 nm (below-band gap excitation) from a 1 kHz fs laser (∼120 fs pulse width) for different numbers of applied pulses per unit area. Reference Schneider13 For 100 applied pulses, permanent modifications of the crystalline structure could be observed above a threshold of 0.24 J/cm2, supporting the rough estimate of 0.3 J/cm2 given above. As the corresponding photon energy is larger (3.81 eV compared to 1.56 eV in the previous experiments), in particular larger than the GaN band gap, we expect the modification threshold to be even smaller than the estimated value.
All time-resolved PL measurements revealed a biexponential decay dynamic for the planar LED structure and a monoexponential one for the 3D structure. The biexponential transient can be explained by the QCSE. The QCSE, being caused by internal piezoelectric fields, leads to band bending and to the separation of electron and hole wave functions. Therefore, the probability of the recombination of electrons and holes decreases thus explaining the long decay time τ 2 . Directly after the excitation with the femtosecond laser pulses, the high density of photo-excited electron–hole pairs screens the piezoelectric fields, so that the QCSE vanishes which results in the observation of the fast initial decay time τ1. Reference Takeuchi, Sota, Katsuragawa, Komori, Takeuchi, Amano and Akasaki6 The transients of the 3D microrod structure can be well described by a monoexponential fit because the QWs in this structure are mainly grown on the nonpolar sidewalls of the GaN core, and thus the QCSE plays a minor role.
Furthermore, our analysis of the PL decay time of both samples for different energy densities of the excitation pulses shows that the decay time τ1 of the planar sample and the time constant τ of the 3D structure are reduced as the energy density is increased (Fig. 5). This could be attributed to the typical recombination processes in the electron–hole plasma which is generated at elevated excitation densities. Reference Jeon, Kozlov, Song, Vertikov, Kuball, Nurmikko, Liu, Chen, Kern, Kuo and Craford20 If more charge carriers are excited, the probability for the recombination process is higher. In the 2D structure, a higher charge carrier concentration screens the electric fields, thus reducing the QCSE which additionally reduces the decay time at the beginning of the recombination process. Reference Bai, Wang and Sakai21
The temperature dependent measurements of the recombination dynamics of the 3D microrod structure show an increase of the decay time for higher temperatures (Fig. 6). This behavior was demonstrated on three different positions of the sample and the decay time increased in total from 348 to 581 ps. For the individual positions, τ increased nearly linear with the temperature by a factor of about 1.5. This linear increase is in a good agreement with the temperature dependence of the radiative decay time τr mentioned in the Introduction, which leads to the assumption that the decay dynamics of InGaN in the 3D structure is mainly influenced by the radiative recombination of electrons and holes or free excitons and that the excess charge carriers are confined in the QWs. It also means that the microrod structure is more or less free of defects. A higher defect density would lead to more nonradiative recombination processes at higher temperatures and, thus, to a shorter decay time.
In contrast to the 3D sample, the planar structure shows faster decay times at higher temperatures (Fig. 7). While the short decay time τ1 [Fig. 7(a)] is just slightly influenced by the temperature, the long decay time τ 2 [Fig. 7(b)] clearly decreases in total from 4.1 ns to 2.0 ns. For the individual positions we found at 300 K about half the value of 77 K. This decrease of the decay time can be explained by the thermal activation of nonradiative recombination processes which dominate the decay dynamics at higher temperatures.
Our energy density dependent measurements show that GaN heterostructures, which are typically considered to exhibit good thermal and chemical stabilities, Reference Morkoç22 are relatively easily damaged under excitation with the femtosecond laser. In particular, for femtosecond laser systems with low repetition rates (e.g., 1 kHz systems) and average output powers of a few tens of milliwatts, the short pulse length of about 100 fs leads to high pulse powers being roughly 1010 times larger than the measured average power. However, reliable and reproducible measurements of the recombination dynamics in the InGaN QWs are possible if pulse powers well below the modification threshold are used.
The most striking observation in this work is the increase of the PL decay time for higher sample temperatures in the case of the 3D structure which is in strong contrast to the findings obtained with the planar sample. The results suggest that under the special excitation conditions used in this work, the radiative recombination from localization centers in the InGaN QWs are by far dominating the emission properties of the sample such that thermally activated nonradiative processes play only a minor role. As our results are obtained under excitation with intense femtosecond laser pulses with photon energies larger than the GaN band gap, they suggest that high-excitation conditions in both the MQW and the barriers of the sample favor the fast and efficient PL emission processes in the 3D structure with only little influence of defect states.
V. CONCLUSIONS
In summary, the recombination dynamics of electron–hole pairs in 2D and 3D InGaN/GaN based LED structures were studied after optical excitation with a femtosecond laser. It was found that the energy density per pulse has a strong influence on the recombination dynamics of both samples. In particular, energy densities in the range of 0.3 J/cm2 induced irreversible modifications of the samples. This was evidenced by a substantial and irreversible decrease of the intensities of the InGaN and GaN/AlGaN luminescence bands. Furthermore, with increasing energy density, the decay time of the microrod structure and the fast one of the planar sample decreased, caused by band filling effects.
The time-resolved measurements revealed a strong influence of the QCSE for the planar sample, but for the 3D structure with mainly nonpolar QWs it only plays a minor role. Furthermore, the temperature dependence of the recombination dynamics of the two samples is completely different. For the 3D microrod structure, the decay time increases for higher temperatures. This implies that the probability for nonradiative recombination processes remains low even at elevated temperatures. The reason could be either a low density of nonradiative defects or the presence of localization centers. For the planar sample, the decay time is decreasing due to thermal activation of nonradiative recombination processes.
We show the importance of choosing the appropriate energy density per laser pulse for the structures under investigation to get reliable measurements without irreversible modifications of the samples. Under our special excitation conditions with intense fs laser pulses, the radiative recombination processes in the m-plane InGaN QWs seem to dominate the emission properties of the microrod structure even up to room temperature, while nonradiative processes have just a little influence.
ACKNOWLEDGMENTS
This work has been supported by the DFG within the research unit FOR1616. The samples were grown by the team of the Epitaxy Competence Center ec2, Braunschweig. We acknowledge the technical assistance of A. Heidemann and K-H. Lachmund.