Introduction
The migration of many insects will advocate escaping a deteriorating environment, finding new resources, and avoiding competition and natural enemies (Dingle, Reference Dingle1972; Westbrook et al., Reference Westbrook, Nagoshi, Meagher, Fleischer and Jairam2016; Smith et al., Reference Smith, Hodkinson, Villellas, Catford, Csergo, Blomberg, Crone, Ehrlen, Garcia, Laine, Roach, Salguero-Gomez, Wardle, Childs, Elderd, Finn, Munne-Bosch, Baudraz, Bodis, Brearley, Bucharova, Caruso, Duncan, Dwyerh, Gooden, Groenteman, Hamre, Helm, Kelly, Laanisto, Lonati, Moore, Morales, Olsen, Partel, Petry, Ramula, Rasmussen, Enri, Roeder, Roscher, Saastamoinen, Tack, Topper, Vose, Wandrag, Wingler and Buckley2020). Among the features that determine whether the invasion is successful, genetic characteristics are among the most important (Lee, Reference Lee2002; Zhang et al., Reference Zhang, Jin, Zhang, Jiang, Liu and Wu2019). For instance, reduced genetic diversity is the general trend in a single long-distance invasive event, while not in multiple invasions from different sources (Wilson et al., Reference Wilson, Dormontt, Prentis, Lowe and Richardson2009). The mechanisms underlying this phenomenon, which in turn may facilitate adaption, include admixing, the emergence of cryptic genetic variation and hybridization (Yang et al., Reference Yang, Sun, Xue, Li and Hong2012; Parepa et al., Reference Parepa, Fischer, Krebs and Bossdorf2014; Exposito-Alonso et al., Reference Exposito-Alonso, Becker, Schuenemann, Reiter, Setzer, Slovak, Brachi, Hagmann, Grimm, Chen, Busch, Bergelson, Ness, Krause, Burbano and Weigel2018). Therefore, understanding the impact of evolutionary features on the population structure and diversification of an invading pest can improve our ability to predict its population dynamics changes (Sakai et al., Reference Sakai, Allendorf, Holt, Lodge, Molofsky, With, Baughman, Cabin, Cohen, Ellstrand, McCauley, O'Neil, Parker, Thompson and Weller2001; Porretta et al., Reference Porretta, Canestrelli, Bellini, Celli and Urbanelli2007). Such information is also critical to preventing further introductions of invasive species, as well as to control or eradicate them (Wei et al., Reference Wei, Shi, Gong, Jin, Chen and Meng2013; Arias et al., Reference Arias, Cordeiro, Correa, Domingues, Guidolin and Omoto2019).
The fall armyworm, Spodoptera frugiperda (J. E. Smith) (Lepidoptera: Noctuidae), is a native crop pest in South and North America (Bentivenha et al., Reference Bentivenha, Montezano, Hunt, Baldin, Peterson, Victor, Pannuti, Velez and Paula-Moraes2017). Spodoptera frugiperda adults have the capacity for long-distance migration (Early et al., Reference Early, Gonzalez-Moreno, Murphy and Day2018; Westbrook et al., Reference Westbrook, Fleischer, Jairam, Meagher and Nagoshi2019). The detection time-line suggested that this pest invaded Africa in 2016 (Goergen et al., Reference Goergen, Kumar, Sankung, Togola and Tamo2016; Otim et al., Reference Otim, Tay, Walsh, Kanyesigye, Adumo, Abongosi, Ochen, Sserumaga, Alibu, Abalo, Asea and Agona2018) and had gradually invaded many Asian countries from Africa in 2018 (CABI, 2019). Since then, fall armyworm was assumed to have invaded Pu'er, Yunnan Province of China in January 2019 from Myanmar (Wu et al., Reference Wu, Jiang and Wu2019; Zhang et al., Reference Zhang, Jin, Zhang, Jiang, Liu and Wu2019) and soon was reported from 25 other provinces of China with outbreaks of varying degrees in just a few months. Crop cultivation has provided large amounts of food sources for humans, while S. frugiperda caused major harm to a large number of crops, especially corn (Sena et al., Reference Sena, Pinto, Queiroz and Viana2003; Casmuz et al., Reference Casmuz, Laura-Juarez, Guillermina-Socias, Gabriela-Murua, Prieto, Medina, Willink and Gastaminza2010). In China, this invasive pest has spread to more than 2.84 million acres, and the actual damage area was 0.41 million acres just in 2019 (MARA, 2019).
Two kinds of strains, the corn-strain and the rice-strain of S. frugiperda, have been identified (Pashley et al., Reference Pashley, Johnson and Sparks1985). The corn-strain prefers corn and sorghum leaves, while the rice-strain prefers to eat rice and turfgrass (Pashley and Martin, Reference Pashley and Martin1987; Meagher and Nagoshi, Reference Meagher and Nagoshi2004; Nagoshi and Meagher, Reference Nagoshi and Meagher2004). Interestingly, these two types cannot be effectively distinguished by morphology and host plants (Nagoshi et al., Reference Nagoshi, Meagher and Hay-Roe2012), while molecular methods, including the analysis of genetic polymorphisms and mitochondrial haplotypes, can reliably distinguish them (Lu et al., Reference Lu, Adang, Isenhour and Kochert1992).
Mitochondrial DNA (mtDNA) sequencing as a genetic tool can reveal the origins of invasive populations, genotypes and paths of migration (Behura, Reference Behura2006; Nagoshi et al., Reference Nagoshi, Silvie and Meagher2007a; Valade et al., Reference Valade, Kenis, Hernandez-Lopez, Augustin, Mena, Magnoux, Rougerie, Lakatos, Roques and Lopez-Vaamonde2009). The mitochondrial cytochrome oxidase subunit I (COI) gene was one of the most commonly used molecular markers in mtDNA. Simple sequence repeats (SSR) markers (Arias et al., Reference Arias, Blanco, Portilla, Snodgrass and Scheffler2011; Pavinato et al., Reference Pavinato, Martinelli, de-Lima, Zucchi and Omoto2013), have also been frequently used as a marker method for agricultural pests to study genetic diversity and genetic structure. SSR markers have the advantage of detecting high levels of polymorphism even for closely related individuals (Chen and Dorn, Reference Chen and Dorn2010). For instance, studies in South America have distinguished haplotypes and studied the hybridization, structure and gene flow pattern of S. frugiperda through the COI gene and SSR markers (Pair et al., Reference Pair, Raulston, Sparks, Westbrook and Douce1986; Nagoshi et al., Reference Nagoshi, Silvie, Meagher, Lopez and Machados2007b; Arias et al., Reference Arias, Cordeiro, Correa, Domingues, Guidolin and Omoto2019). Furthermore, polymorphisms in triose phosphate isomerase (Tpi) gene (Nagoshi, Reference Nagoshi2010) can identify specific host strains of S. frugiperda (Nagoshi, Reference Nagoshi2012; Nagoshi and Meagher, Reference Nagoshi and Meagher2016). Therefore, it is first necessary to know its genetic diversity, genetic structure and diffusion pathways in controlling S. frugiperda of China.
In this study, we investigated the genetic structure and genetic diversity of 16 S. frugiperda populations in China by analyzing the COI and the Tpi gene, and by inference using microsatellite loci. To better understand the feeding behaviors of S. frugiperda, this pest was fed on both rice and corn leaves. Our goals were to determine (1) the genetic differentiation and diversity, (2) possible invasive patterns and (3) feeding behaviors of this pest in China.
Materials and methods
Sample collection and DNA extraction
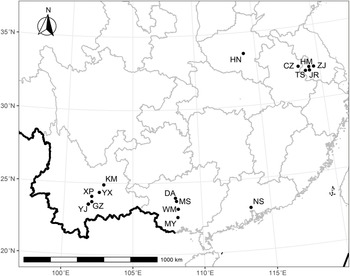
All 322 S. frugiperda samples were sampled in Yunnan Province (population numbers n = 5), Guangxi Province (n = 4), Jiangsu Province (n = 4), Anhui Province (n = 1), Henan Province (n = 1) and Guangdong Province (n = 1) (fig. 1 and Table S1). These samples were collected on corn except for two sites (Yuxi, Xinping) where larvae were collected on sorghum. Samples were collected between May 2019 and October 2020 (Table S1), when S. frugiperda migrated rapidly across the Chinese mainland. All S. frugiperda larvae were put in 1.5 ml tubes containing 95% ethanol and stored at −20°C. DNA was extracted with the Wizard SV Genomic DNA purification System (Promega) according to the manufacturer's instructions.
Map of sampling sites of S. frugiperda in China.

Identification of S. frugiperda strains through COI and Tpi genes
A mtDNA COI gene fragment was amplified in all S. frugiperda individuals (n = 322) and sequences searched against National Center for Biotechnology Information (NCBI; https://www.ncbi.nlm.nih.gov/genbank/) database for species identification (Table S2) (Levy et al., Reference Levy, Garcia-Maruniak and Maruniak2002; Nagoshi et al., Reference Nagoshi, Silvie, Meagher, Lopez and Machados2007b). The Polymerase Chain Reactions (PCR) were conducted as described by Nagoshi et al. (Reference Nagoshi, Silvie, Meagher, Lopez and Machados2007b) The PCR mixture contained 12.5 μl 2 × Taq PCR Master Mix ( + Dye) (TSINGKE Biotechnology Co., Ltd. China), 0.5 μl of COI-893 sense, 0.5 μl COI-1303 primer antisense, 1 μl of DNA made up to 25 μl with ddH2O. The PCR amplification conditions were set as follows: 94°C(1 min), 33 cycles at 92°C(45 s), 60°C(45 s), 72°C(1 min), and 72°Cfor 3 min as a final step. The PCR products were sequenced to obtain 410 bp fragments and SnapGene v.1.1.3 software (https://www.snapgene.com/) was used to detect the presence of EcoRV which only present in the rice-strain (Fig. S1). In this study, we compared the above 322 COI sequences with 55 COI sequences from Brazil (populations numbers n = 2) and Paraguay (n = 4) in South America from NCBI (accession numbers ranged from MK372747 to MK372820). We used the Mega 7.0 (Kumar et al., Reference Kumar, Stecher and Tamura2016) to align and trim all the mitochondrial sequences into 367 bp fragments based on the base quality and overlap COI region of Chinese and South American populations. The haplotype data file of the 367 bp fragments was generated using DnaSP v.6.0 software (Librado and Rozas, Reference Librado and Rozas2009). Finally, the haplotyping data results were imported into POPART software (Leigh and Bryant, Reference Leigh and Bryant2015) to obtain the network of COI haplotypes. Besides, the Tpi e4183 on the Z (sex) chromosome was selected for analysis (Fig. S2) and Tpi e4183 SNP is C for corn strain (Tpi-C) or T for rice strain (Tpi-R) in females. For males, there are more possibilities of overlap in the PCR process, which possess an overlapping C and T at e4183 (Nagoshi, Reference Nagoshi2010; Nagoshi et al., Reference Nagoshi, Koffi, Agboka, Tounou, Banerjee, Jurat-Fuentes and Meagher2017). In order to overcome this problem, two pairs of Tpi primers (Table S2) were used for PCR amplifications, including Tpi-282F, Tpi-412F and Tpi-850R (Nagoshi, Reference Nagoshi2010; Nagoshi and Meagher, Reference Nagoshi and Meagher2016). PCR amplifications for all segments were performed in a 25 μl reaction (the same as above) in the follow conditions: initial denaturation at 94°C (1 min), followed by 33 cycles of 92°C (30 s), 56°C (45 s), 72°C (45 s), and a final segment of 72°C for 3 min.
Microsatellites markers and genotyping
Sixteen populations of S. frugiperda were amplified using 8 microsatellite loci (Table S3), four of which were described in Pavinato et al. (Reference Pavinato, Martinelli, de-Lima, Zucchi and Omoto2013) and the other four loci were used in Arias et al. (Reference Arias, Blanco, Portilla, Snodgrass and Scheffler2011) The Hardy-Weinberg and linkage disequilibrium were estimated using Fstat v.2.9.3 (Goudet, Reference Goudet2002). Null alleles were tested using Micro-Checker 2.2.3 (Van-Oosterhout et al., Reference Van-Oosterhout, Hutchinson, Wills and Shipley2004). Microsatellite fluorescently labeled primers were customed for 8 microsatellite loci: FAM for Spf01 and Spf06, HEX for Spf05 and Spf343, ROX for Spf09 and Spf670, TAM for Spf918 and Spf1502. Microsatellites loci were amplified in PCR reaction and the specific reaction system is as follows: 12.5 μl 2xTaq PCR Master Mix ( + Dye), 0.5 μl of primer sense, 0.5 μl primer antisense, 1 μl of DNA and made up to 20 μl with ddH2O. PCR amplification procedure was the same as above (COI sequence) and the PCR products were sent to TSINGKE Company for polymorphism evaluation performed on an ABI PRISM 3730xl DNA Analyzer (Applied Biosystems®). Subsequent data processing and genetic polymorphism analysis were performed using GenAlEx 6.503 software (Peakall and Smouse, Reference Peakall and Smouse2012) and FSTAT v.2.9.3 (Goudet, Reference Goudet2002). A Mantel test was performed between genetic distance and geographic distance to detect an Isolation-by-Distance (IBD) effect, with over 104 permutations of significance tests.
Population genetics and diversity analysis
Based on the eight microsatellite loci, 320 individuals from the 16 populations were selected for analysis (table 1). We calculated allele number (NA), observed heterozygosity (HO), expected heterozygosity (He), fixation index (F), SHANNON Index (I), effective number of migrants successfully entering a population per generation (Nm) among 8 loci and 16 populations using GenAlEx 6.503. Allele richness (AR) of 16 populations were calculated by Fstat v.2.9.3. Tests of Hardy-Weinberg equilibrium were applied in Genepop version 4.7.5 (Rousset, Reference Rousset2008).
The genetic diversity index of 16 S. frugiperda populations

N, Sample number; NA, Allele number; AR, mean allelic richness over eight microsatellites (based on n = 10); HO, Observed heterozygosity; He, Expected heterozygosity; F, Fixation Index; I, Shannon Index; *** : Significant deviation from Hardy-Weinberg equilibrium (P < 0.001).
Analysis of Molecular Variance (AMOVA) and Principal Coordinates Analysis (PCoA) in 16 populations were obtained using GenAlEx 6.503. The Unweighted Pair-group Method with Arithmetic Means (UPGMA) cluster analysis of these populations was analyzed by MEAG7.0. Population differentiation including genetic differentiation coefficient (FST) and gene flow as estimated based on effective number of migrants (Nm) were obtained through SSR data (Pritchard et al., Reference Pritchard, Stephens and Donnelly2000; Falush et al., Reference Falush, Stephens and Pritchard2003, Reference Falush, Stephens and Pritchard2007). The ancestral population proportions of the invasive S. frugiperda were inferred using the STRUCTURE software with Length of Burin Period = 105 and Number of MCMC Reps length after Burin = 106. The K (Evanno et al., Reference Evanno, Regnaut and Goudet2005) values were set between 1 and 10 and repeated 10 times to obtain the possible number of populations. We performed Structure Harvester (Earl and vonHoldt, Reference Earl and vonHoldt2012) to identify the best K value and ran CLUMPP (Jakobsson and Rosenberg, Reference Jakobsson and Rosenberg2007) to get Q-matrix files of groups and individuals, and then used Distruct 1.1 (Rosenberg, Reference Rosenberg2004) to draw the final figure.
The recent migration rates among the sixteen populations were inferred by BayesAss 3.0.4 software (Wilson and Rannala, Reference Wilson and Rannala2003). Then we combined 10 long-running trace files to calculate mean migration with a burn-in of 5 × 10⁷ according to Tracer 1.6 (Rambaut et al., Reference Rambaut, Drummond, Xie, Baele and Suchard2018), and plotted the heatmap of the migration rates matrix using Origin.2018 (https//www.originlab.com).
Bioassays
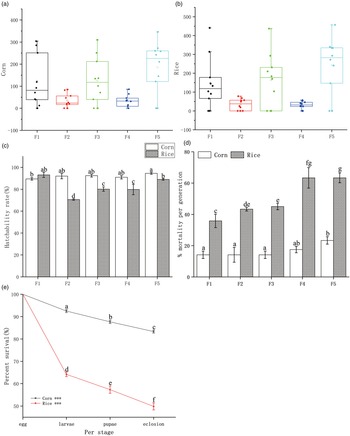
Additional S. frugiperda first instar larvae collected from Tangshan population (TS; see Table S1) in Jiangsu province were fed on corn leaves or rice leaves to examine their feeding characteristics. These first instar larvae originally fed on corn were individually put into test tubes to prevent them from attacking each other (Outer diameter × length: 18 mm × 180 mm) and then we randomly selected 40 developmentally synchronous larvae to feed on corn leaf disks (10 cm in length) and rice leaves (10 cm in length) respectively. Sufficient leaves from both rice and corn plant hosts were provided every other day to ensure the growth of larvae. We treated these larvae as the F1 generation and it took almost one month from hatching to laying eggs, so we obtained the F5 generation about five months later. The larvae were fed at 25 ± 0.5°C, and 60 ± 5% relative humidity and under a 14:10 (light:dark) condition (Busato et al., Reference Busato, Grutzmacher, Garcia, Giolo, Zotti and Stefanello2005). The bioassays including survival and mortality were carried out with 40 samples from the egg stage to eclosion for each generation. To obtain egg production and hatchability, we put single female and male adults together under dark condition for 7 days (24 h × 7 days). Three replications were conducted for each treatment. All significant differences between groups and treatments were analyzed with the SPSS 21.0 software (IBM Inc., Chicago, IL, USA) by two-way ANOVA of variance and followed by the LSD test for multiple comparisons (P < 0.05). These experimental data mainly included egg production, hatchability and mortality of different generations under two feeding treatments and survival rate at different periods under two feeding treatments.
Results
COI fragment haplotype network and molecular identification
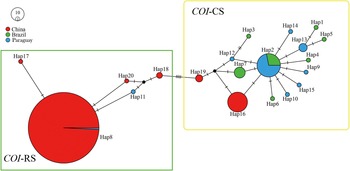
The haplotype network of 377 samples (322 individuals from China and 55 individuals from Brazil and Paraguay) based on COI sequences showed that the rice- and corn-strains were separated into two distinct groups (fig. 2). A total of 20 different haplotypes were found based on partial sequences of COI genes (Hd of COI-RS = 0.453, Hd of COI-CS = 0.639), with six haplotypes belonging to China, of which four (i.e., Hap8, Hap17, Hap18, Hap20)were rice (i.e., COI-RS; Fig. 2) and two (i.e., COI-CS; Fig. 2). The COI-RS Hap8 was the main haplotype detected in China of which also shared with Paraguay, which differed from the Paraguay Hap11 by a single substitutional step. In the COI-CS haplotype, Hap16 was the most common haplotype detected in China, and differed from Hap2 group consisted of native Brazil and Paraguay FAW also by a single base substitutional step.
Haplotype network diagram based on COI fragments. Circles represent haplotypes and the sizes represent the frequencies. (China: red, Brazil: green, Paraguay: blue). COI-RS: rice-strains; COI-CS: corn-strains.

We further used the Tpi gene for molecular identification, which is another method for typing S. frugiperda. Tpi e4183 SNP is C for corn strain (Tpi-C) or T for rice strain (Tpi-R) and an overlapping C and T at e4183 for heterozygous strain (Tpi-h). DNA from 50 larvae were randomly selected for PCR amplification followed by sequencing. Based on polymorphisms at the Tpi e4183 SNP, 43 of 50 larval samples belonged to the corn strain (Tpi-C), six samples showed heterozygous polymorphisms (Tpi-h), and the remaining one was Tpi-R. The haplotype of more than 80% of the larvae was Tpi-C (fig. 3), which was consistent with samples collected from corn and sorghum fields.
Frequencies (y-axis) of Tpi gene and haplotypes composition (x-axis).

Genetic diversity in different S. frugiperda populations
The genetic diversity of 16 S. frugiperda populations were analyzed based on microsatellite data. For these 320 individuals, the average number of effective alleles (NA) of S. frugiperda among the 16 geographic populations was 6.836, ranging from 4.125 to 9.125 (table 1). The allele richness (AR) per population ranged from 3.625 to 6.000 (table 1), indicating the alleles in the collection are abundant. Effective number of migrants (Nm) were > 1 (Table S4), which revealed sufficient gene flow to negate the effects of genetic drift (Wright, Reference Wright1931). Observed heterozygosity (Ho) was lower than expected heterozygosity (He) in all populations except for NS (table 1). The apparent heterozygosity differed from the expected heterozygosity in most of the groups, revealed diminished genetic diversity and departures from the Hardy-Weinberg equilibrium which were verified by global tests in Genepop (table 1). The GZ population from Yunnan Province had more alleles and higher genetic diversity. Generally, gene flow and FST value are inversely proportional. FST ranged from 0.018 to 0.153 whereas the lowest gene flow was between ZJ and NS, and the highest between CZ and JR (Table S5).
Population structure of S. frugiperda
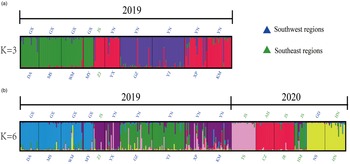
Based on STRUCTURE analysis, 3 genetic clusters (K = 3) can best explain the observed allelic frequencies of 10 populations collected in 2019 (fig. 4a and Fig. S3a). An admixture analysis of S. frugiperda genotypes with STRUCTURE revealed a strong genetic structure of 16 populations collected between 2019 and 2020 (fig. 4b). Delta K reached its maximum value at K = 6 (Fig. S3b). The composition of six different colors indicates that all samples can be divided into 6 groups, including the genetic characteristics of individuals from different geographical groups.
Genetic structure of S. frugiperda populations based on eight microsatellite markers. (a) The genetic structure of 10 S. frugiperda populations collected in 2019. (b) The genetic structure of 16 S. frugiperda populations collected in 2019 and 2020. The colored bars represent the composition of the inferred populations. red, P1; purple, P2; green, P3; blue, P4; pink, P5; yellow, P6. Labels above the colored bars represent provinces and labels below the colored bars represent population codes. Province: GX, Guangxi; JS, Jiangsu; YN, Yunnan; AH, Anhui; GD, Guangdong; HN, Henan. Population codes: DA, Duan; MS, Mashan; WM, Wuming; MY, Mingyang; ZJ, Zhenjiang; YX, Yuxi; GZ, Ganzhuang; YJ, Yuanjiang; XP, Xinping; KM, Kunming; TS, Tangshan; CZ, Chuzhou; JR, Jurong; HM, Huangmei; NS, Nansha; HN, HeNan (Luohe).

As YN was the first province in which S. frugiperda was found, it showed a high degree of admixture among five populations (fig. 4). GX and YN were the provinces that were initially invaded by S. frugiperda. The main clusters in these two provinces were different, which suggests that GX and YN were invaded by different sources. The population structures at the ZJ and HM sites in JS province were similar to the population structure of YN, which may suggest that JS and YN samples shared a common origin (fig. 4b). The TS population in JS province and the NS population in GD province consisted of almost a single color composition, while other populations were admixed. As we avoided sampling siblings by collecting one larva per plant (each plant was at least 1 m apart from the others), the single population composition maybe the result of additional single founder events derived from other independent invasions. The genetic structures of the four populations from different hosts (YX and XP on sorghum, ZJ and KM on corn) were basically similar.
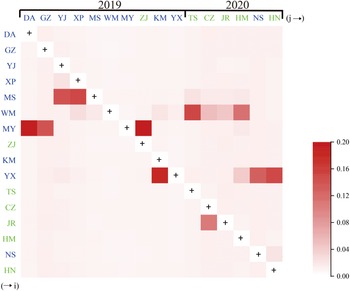
Based on the results of BayesAss, most populations lacked strong recent gene flow (the mean value of m ranged from 0.0077 to 0.1889), except for a few with asymmetrical strong gene flow. For example, the migration rates were high from GZ to MY, from YJ to MS, from ZJ to MY, from TS to WM and from HN to YX (fig. 5), which was consistent with the STRUCTURE that the recipient populations exhibited mixed ancestral population proportions. The most mixed population proportions of XP, KM and GZ populations, without any signal of recent Chinese population immigration (fig. 5), may be the results of long-term gene flow before invading China. The recent migration rate detected in distantly separated populations (from HN to YN and JS to GX) might suggest recent gene flow in last several ancestors.
Heatmap of migration rate among 16 populations of S. frugiperda across China. Note that ‘j --> i’ is the fraction of individuals in population i that are migrants derived from population j per generation. Dark color indicates that the gene flow level of the (j) – (i) population is high, while the light color is the opposite. The scale represents the range of migration rate among 16 populations.

Principal coordinate and genetic distance analyses
A UPGMA cluster analysis using the Nei's standard genetic distance showed that the ZJ population in Jiangsu has the farthest genetic distance from the remaining 15 populations (fig. 6a and Table S6), while the shortest genetic distance existed in GZ and YJ, CZ and JR populations. In addition, no evidence of a correlation between genetic distance and geographic distance was found by the Mantel test based on an Isolation-by-Distance analysis in 2019 (R 2 = 0.5718, P = 0.8973) (Fig. S4a). Similarly, there was no correlation between genetic distance and geographic distance combining 2 years (R 2 = 0.2467, P = 0.7517) (Fig. S4b). According to a PCoA analysis (fig. 6b), the first two principal coordinates, PC1 and PC2, accounted for 19.83 and 17.44% of the molecular variation, respectively. ZJ population was far from other populations, suggesting it has a unique origin. CZ from Anhui was similar to JR and TS from Jiangsu because of the close distance and frequent gene flow between them.
UPGMA and PCoA analysis of 16 S. frugiperda populations in China. (a) UPGMA cluster analysis using the Nei's standard genetic distance indices for S. frugiperda. (b) PCoA analysis in different sites of China.

Population differentiation
AMOVA results revealed that 51.9% (P < 0.001) of molecular variance among populations and 48.1% (P < 0.001) within populations (table 2). FST among the 16 populations revealed that 81.67% of S. frugiperda groups were moderately differentiated (Table S7).
AMOVA analysis of the 320 S. frugiperda individuals using the SSR alleles

Fixation Index F: 0.519 P < 0.001.
Bioassay data analysis
For all five generations, egg production by adults that were fed on corn leaves (fig. 7a) or rice leaves (fig. 7b) was not significantly different by both the error bars and two-way ANOVA (LSD test: F 1,20 = 1.61, P = 0.219). For each generation except F1, the hatchability rate was significantly higher for females fed on corn leaves than on rice leaves (LSD test: F 1,15 = 133.02, P < 0.05; Fig. 7c). For each generation, the mortality of S. frugiperda fed on rice leaves was significantly higher than on corn leaves (LSD test: F 1,20 = 80.36, P < 0.05; Fig. 7d). Throughout the developmental stages, the survival rate of S. frugiperda fed with corn leaves was significantly higher than that of S. frugiperda fed with rice leaves (LSD test: F 1,12 = 2569.82, P < 0.001, fig. 7e). Whether feeding on rice leaves or corn leaves, there was an interaction between developmental stage and survival rate (LSD test: corn: F 2,12 = 38.17, P < 0.001; rice: F 2,12 = 93.29, P < 0.001, fig. 7e). The percentage of survival from egg stage to larval stage decreased significantly than the other two stages according to the results of pairwise comparisons (P < 0.001 for both feeding treatments, fig. 7e).
Ecological effects of S. frugiperda under rice and corn leaves feeding treatments. (a) and (b) Box diagram of egg production per generation under rice and corn leaves feeding treatments. (c) Hatchability rate per generation of S. frugiperda. (d) Mortality per generation of S. frugiperda. (e) The percent survival per stage of S. frugiperda. The letters above the error bars represent whether there is a significant difference between groups and treatments. Different letters represent there is a significant difference and containing the same letter indicates no significant difference between groups and treatments.

Discussion
China is one of the world's largest corn and rice-growing countries due to its many regions that have a warm and suitable climate. As a result, these regions are ripe for colonization by S. frugiperda. Thus, further research on the migration and harm of S. frugiperda infestation is needed. The results of molecular identification of S. frugiperda using the COI gene showed that most of them were rice-strains and a few were corn-strains, while the identification results of the Tpi gene showed that corn-strains accounted for the majority and a small proportion were rice-strains. The conclusions drawn by the Tpi gene tend to be consistent with the sampled host plants, which suggests that the Tpi gene can be useful for the rapid and accurate identification of Chinese S. frugiperda. These larvae were all collected from corn and sorghum, but the rice-strain was also found, so we should pay more attention to the potential damage of this pest in rice fields.
Microsatellites are widely used molecular markers in population genetics and can be used to infer the invasion routes of many invasive insects (Yang et al., Reference Yang, Sun, Xue, Li and Hong2012). Microsatellite SSR markers were used to study the current gene flow and genetic structure of different geographical populations of S. frugiperda in China. In a short period of time after being reported in China, five microsatellite loci of S. frugiperda showed moderate differentiation, and three loci showed obvious differentiation (Table S4). Compared with the genetic diversity of S. frugiperda in South America (Arias et al., Reference Arias, Cordeiro, Correa, Domingues, Guidolin and Omoto2019), the higher average value of inbreeding coefficient and the lower mean allelic richness of Chinese invasive populations reflected the evolutionary history of this recently introduced pest with limited founding populations. To obtain more accurate population genetics of S. frugiperda, it will be necessary to analyze larger numbers of samples from a larger number of outbreak areas, especially Southeast Asia and northern China. Most of the S. frugiperda populations had moderate population differentiation which was much higher than that of the migrant white-blacked planthopper in local China (Sun et al., Reference Sun, Jiang, Wang and Hong2014), raising the possibility that the populations of this notorious pest in China were not established by a single panmictic introduction. The Nm for the populations were >1 but < 4, suggesting that there was sufficient genetic diversity to nullify the effects of genetic drift however they were nevertheless not large enough to be considered as a panmictic population (Wright, Reference Wright1931). Based on the moderate population differentiation and low recent gene flow among most populations, a scenario that multiple populations of S. frugiperda underpinned the pest's introductions to China and then spread across mainland China multiple times was a more parsimonious explanation than an assumption of a single introduction.
This scenario was further supported by the strong genetic structure of the 16 populations. At the early stage of the 2019 invasion, the strong and distinct genetic structure of populations in Yunnan province where S. frugiperda was first found in China (Wu et al., Reference Wu, Jiang and Wu2019; Zhang et al., Reference Zhang, Jin, Zhang, Jiang, Liu and Wu2019) suggested at least two independent groups had established in YN before 2020. The additional genetic composition of GX populations further suggested multiple sources of this invasive pest. There was a high possibility that these different invasive populations of YN derived from Myanmar based on the three-dimensional trajectory analytical approach (Chen et al., Reference Chen, Yang, Zhan, Li, Wang, Liu and Hu2020b). However, this conclusion needed more genetic evidence covering populations from the Southeast Asia. While adding 6 populations (TS, CZ, JR, HM, NS and HN) collected in 2020, 3 more genetic compositions were suggested by STRUCTURE (best K = 3 vs. K = 6, fig. 4b). As new population structure formation typically required many generations under limited gene flow, the new genetic structure of TS, CZ, JR, NS and HN populations indicated complex population evolutionary history and insufficient field sampling of S. frugiperda in 2019. The consistent genetic competent between HM population in 2020 and YN populations in 2019 suggested that the HM population potentially originated from Yunnan province. The obvious differences in the population genetic structures in Guangxi and Yunnan possibly corresponded to the previously two predicted migratory routes in China originated in Myanmar and Indochina respectively (Chen et al., Reference Chen, Wu, Liu, Chen, Jiang and Hu2020a; Li et al., Reference Li, Wu, Ma, Gao, Wu, Chen, Liu, Jiang, Zhai, Early, Chapman and Hu2020), but these invasive populations couldn't be the descendants of a single introduction linked to Africa, further suggesting likely independent introduction of S. frugiperda in Southeast Asia. Even if there was no gene flow between the above-mentioned different sources of S. frugiperda, the new composition of populations in 2020 could not have been formed in such a short time. Hence, there were at least three independent introductions of S. frugiperda into China after our sampling in 2019. Moreover, distantly separated populations (HN, NS; ZJ, YX) appeared to share the same hypothetical ancestral genetic clusters, which may mean that these populations have similar origins. Four populations separated by short distances (TS, JR; HM, ZJ) exhibited distinct genetic background, which further indicated the complexity of the genetics of the Chinese S. frugiperda populations, and suggested this region of the country could represent a biosecurity hotspot for the accidental introductions of this and potentially other alien species. Despite of invading one year earlier, the HM and ZJ populations that shared the same ancestors with Yunnan did not become the major S. frugiperda in Southeast of China, which could be due to potentially high levels of genetic variability of this pest in Asia, assuming the establishment of Chinese populations involved other Asian populations (Wu et al., Reference Wu, Qi, Chen, Ma, Liu, Jiang, Lee, Otuka and Hu2021), that there were other possible origins beyond Myanmar and Indochina, as well as agricultural trades with other countries including direct trade between China and S. frugiperda's native range countries. All these hypotheses need a broader population genetic studies and if possible, using the whole genome SNPs. The genetic distance between different populations was demonstrated by UPGMA and PCoA results (fig. 6). Both UPGMA and PCoA analyses revealed a close genetic relationship in adjacent populations as well as some geographically distant populations, such as NS and HN, which was likely caused by long-distance migration or separate introductions from the same source populations of S. frugiperda. All the populations in the southeast of China, except for HM, exhibited large genetic distance (fig. 6) and distinct population structure with southwest, indicating the invading of S. frugiperda from new sources had continued in 2020.
Associating with Asian monsoon climate, S. frugiperda relied on the southeast wind to damage the domestic crops along two paths northward in summer and with the effect of the northwest wind. Meanwhile, this pest does not survive prolonged freezing, which explains why it had not gone beyond Yunnan and Guangxi provinces which are the northern boundary of overwintering S. frugiperda in China. Because S. frugiperda is severely destructive and does not undergo diapause, it is vital to do a long-term study on S. frugiperda of these two provinces in the future. The invasion of S. frugiperda in China caused serious damage to different domestic crops in just one year. In early 2020, S. frugiperda broke out again in Yunnan and Guangxi when control measures were insufficient (Cui et al., Reference Cui, Li, Wang and He2020). Besides, this pest in Guangxi, Yunnan, Jiangsu, Anhui, Guangdong and Henan had six different regional structures (fig. 4b), which was different from another migratory pest Plutella xylostella which is distributed in different areas of China (Wei et al., Reference Wei, Shi, Gong, Jin, Chen and Meng2013). Due to the abundant genetic resources of the invasive S. frugiperda populations, insecticides should be carefully applied in pest control to avoid the rapid development of resistance. For well-established populations in Guangxi and Yunnan, comprehensive measures combining prevention and pesticide control should be adopted. In other crop-growing areas in China, especially cornfields, monitoring and prevention throughout the year will be extremely important.
Combining genetics and ecology, we can understand this pest from multiple perspectives and provide guidance for the follow-up pesticide control. In the host leaf-feeding bioassay experiment, the survival rate of S. frugiperda was higher when fed on corn leaves than on rice leaves (P < 0.001, fig. 7d and e) suggesting that this pest had a higher fitness on corn leaves than on rice leaves. This could explain why the rice-strain showed a preference to feed on corn leaves. Moreover, the larval stage had the highest mortality rate under both treatments, which indicated the importance of this stage for the prevention and elimination of this pest. Therefore, future biological indicators researches (e.g., weight of larvae at different stages) and the development of pesticides should target the larval stages that could lead to more effective control of S. frugiperda.
In conclusion, this population genetic analysis revealed distinct population structures in field populations of S. frugiperda to support multiple introductions of this pest in China, and revealed potential biosecurity weakness at regional levels underpinned the spread of this pest. Further studies with more samples and loci from the Americas, Asia, and Africa will be necessary to better understand its outbreak process, and to help with the development of effective and sustainable management strategies for this pest.
Supplementary material
The supplementary material for this article can be found at https://doi.org/10.1017/S0007485322000190
Acknowledgements
We thank Xiao-Li Bing, Yao Wang and Hui Chen of the Department of Entomology, Nanjing Agricultural University (NJAU) for the collection of S. frugiperda. We also thank Pei-Jiong Lin, Bing-Yao Wang, Xiao-An Liu, Hui-Bin Li and Chang-Wu Peng of NJAU for excellent technical support. The use of trade, firm, or corporation names in this publication is for the information and convenience of the reader. This work was supported by the grant-in-aid from the National Key Research and Development Project of China (no. 2016YFC1201200).