


Introduction
The orography of general circulation models (GCMs), in mountainous regions, differs significantly from the real orography. The maximum elevation of the Alps is 600 m a.s.l. with a T42 truncation (grid mesh about 280 km), and 1200 m with a T106 truncation (grid mesh about 100 km), which is a rather high resolution for present-day GCMs. Under these conditions, analyses of GCM output in these regions are not easy, especially for snow cover that depends strongly on elevation. In this paper, we describe a procedure that allows the extrapolation of meteorological data, at elevations above (or below) the model orography, to provide input data for the Crocus snow model (Reference Brun, David, Sudul and BrunotBrun and others, 1992) at several elevations (up to 2000 m above the model orography). This allows easier comparisons between snow-cover simulations derived from GCMs (with various orography and resolution) and observations.
The first part of the paper describes the procedure. After a short presentation of the GCM runs used, the paper focuses on the simulation of the snow cover in the Mont-Blanc region (French Alps). The temperature and precipitation estimated by the procedure are validated against existing datasets. In the second part of the paper, the simulated snow cover is compared to the present snow climatology calculated by Reference Martin, Brun and DurandMartin and others (1994).
The Extrapolation Procedure
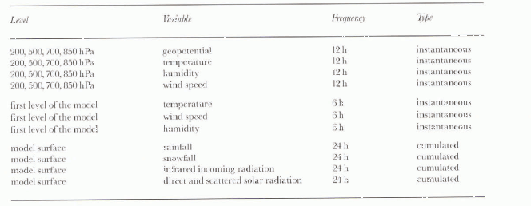
This extrapolation procedure calculated the hourly meteorological input data for Crocus: air temperature, wind speed, humidity, precipitation, direct and scattered-downward solar radiation, and thermal incoming radiation. These data were reconstructed for a given region (defined by latitude and longitude) at the model surface and at elevations ranging from 900 m to 3000 m with a 300 m vertical step. The procedure used the standard GCM outputs as given in Table 1. It was inspired by SAFRAN, the meteorological analysis system used operalionally for snow monitoring in the French Alps (Reference Durand, Brun, Mérindol, Guyomarc'h, Letaffre and MartinDurand and others, 1993). SAFRAN uses sophisticated analytical methods to derive the meteorological input data of Crocus from various sources: meteorological-model outputs, satellite data, snow-network and meteorological-station observations. In the present case. the problem was simplified as the only source of information was the GCM.
GCM data used as input data by the meteorological analysis procedure.
Air temperature, wind speed and humidity
In mountains comprising isolated peaks (like the Alps), the surface layer is generally well mixed with the free air (Reference BarryBarry, 1990). The air temperature was linearly interpolated from altitude levels above the surface of the model. Below, a lapse rate of −0.006°C m−1 was used. Humidity was also interpolated from altitude levels. Wind speed was kept at its surface value at all levels because, in this rase, boundary-laver effects are apparent.
Precipitation
Daily rain and snowfall data were only available for the model surface. Hourly precipitation was first estimated at this level, being deduced at upper levels in a second step. A maximum of four one-hour precipitation events was allowed, depending on the quantities simulated by the GCM. The amount and aggregational state of each event were determined from GCM data (i.e., rain, snow, temperature and humidity). At the other levels, hourly precipitation was kept constant, rain turning to snow if the air temperature was lower than 0°C. Precipiiation increased with altitude (the typical vertical gradients for the French Alps are 1-3% 100 m−1).
Radiation terms
Radiation terms at all levels (direct and scattered-down-ward solar radiation and thermal incoming radiation) were calculated using the SAFRAN radiation code. This code was derived from the one used in the GCM of Météo-France: ARPEGE/Climat (Reference Ritter and GeleynRitter and Geleyn, 1992). It requires vertical profiles of temperature, humidity and cloudiness as input data. All these input variables were given by the GCM. However, there was insufficient information to reconstruct a detailed cloudiness profile. An iterative process is required to adjust cloudiness and cloud-height data until the daily surface-radiation terms match the values of the GCM.
Application to GCM Outputs
Description of the runs
A total of three runs were investigated. The first two were conducted using ARPEGE/Climat, the Météo-France atmospheric GCM described by Reference Déqué, Dreveton, Bratin and CariolleDéqué and others (1994). The first was a five-year run with prescribed climatological sea-surface temperatures (SSTs). The resolution of this spectral model is T42, corresponding to a 300 km grid mesh at mid-latitudes. The second was a five-year run with a T106 truncation (grid mesh about 100 km at mid latitudes).
The third run was constituted by the European Centre for Medium-Range Weather Forecasts (ECMWF) Re-analyses (with only the first five years), using a T106 truncation. Despite the relatively low resolution, this was not a GCM run because meteorological analyses were performed every 6h. Meteorological fields are therefore much more realistic than in GCM runs. Precipitation amounts and radiation data were deduced from 21 h Forecasts, based on the 0000 h and 1200 h UTC analyses. This run can be considered as intermediate between low-resolution GCM runs and sophisticated local models, like SAFRAN. In this paper, these runs and the corresponding snow simulations are called T42, T106 and Re-analyses. The data neeessary to run the extrapolation procedure were extracted for the three runs and interpolated for the Mont-Blanc region (45.9° N, 6.9° E). The procedure and the snow model were then run to produce meteorological and snow-cover data.
Temperature validation
The mean January temperature at several elevations, for all the experiments considered here, were compared to the operational analyses of the ECMWF and SAFRAN data (Table 2 for January). SAFRAN uses operational analyses and air temperatures from high-elevation sites. The difference between these two datasets was usually small (<2°). More surprising was the difference between the two data-sets and the Re-analyses temperature, which were colder, especially at low altitudes. This is probably due to differences in the parameterisation of the model boundary layer in winter (the July temperature is much more closely aligned to SAFRAN and operational data).
Mean January air temperature (°C) at 1200, 2100 and 3000 m a.s.l for the T42,T106, and Re-Analyses runs compared to the Operational ECMWF analyses and SAFRAN data.
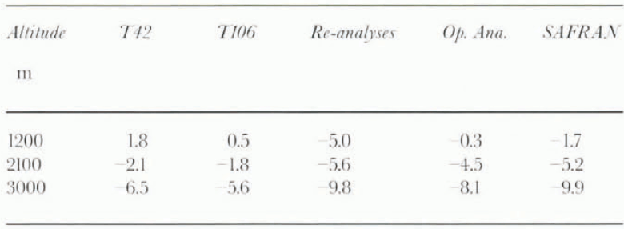
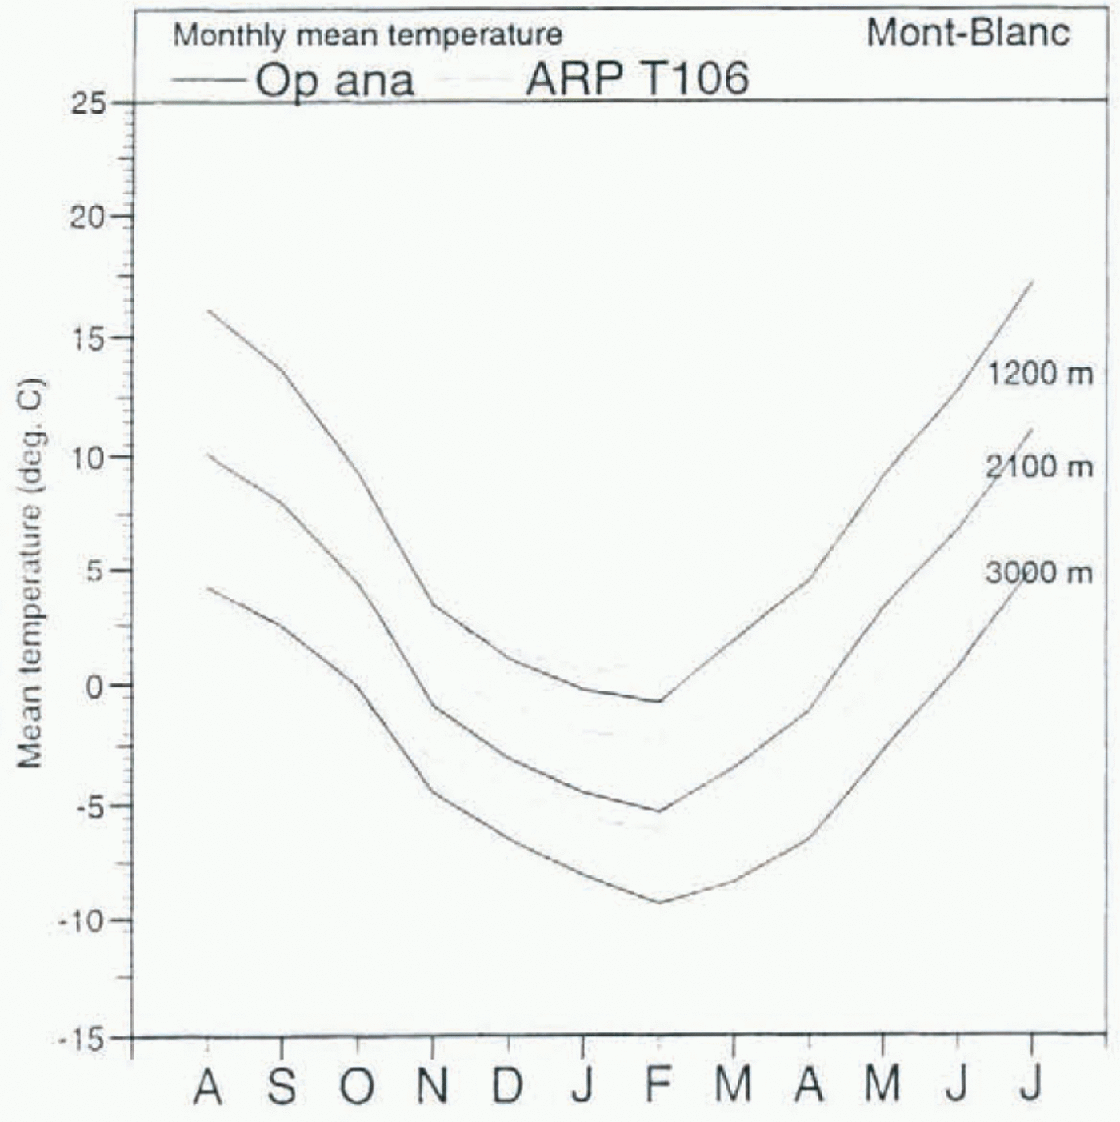
Both T106 and T42 runs were too warm in January, but the temperature overestimation was present throughout the winter season: up to 4°C for the T106 run at 3000 m (Fig. 1). These discrepancies would result in an underestimation of snowfall and an enhanced snowmelt during spring.
Mean monthly air temperature (°C) of the operational ECMWF analyses and the T106 run at various elevations.
Precipitation validation
Precipitation amounts analysed by SAFRAN between 1981 and 1991 were used as a reference (amounts derived from operational analyses were not available). These data were based on precipitation measured at meteorological and climatological stations, and included a vertical gradient. Total precipitation amounts were 1200 mm a−1 for the T42 run, 1800 mm a−1 for the T106 run, and 900 mm a−1 for the Re-analyses, compared to 1200 mm a−1 at 1200 m a.s.l. for SAFRAN. It seems that the precipitation increase between the T42 and the T106 runs was due to different orography. The Re-analyses run had too little precipitation.
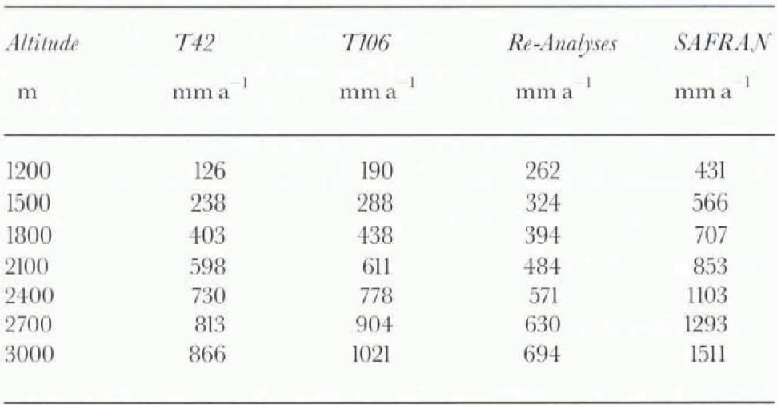
The mean annual snowfall (in mm a−1) was compared to the SAFRAN-analysed snowfall data presented in Table 3. The observed vertical gradient in SAFRAN data ( + 1% 100 m−1) was applied to the GGM data to facilitate further comparisons. The GCM-derived snowfalls were consistently underestimated when compared to the SAFRAN data. Because of too-high temperatures, this deficit was especially marked at lower elevations for the T42 and T106 runs (>50%). This was not the case for the Re-analyses, because of the colder temperatures. At high elevations, the deficit was less important for T106 and T42, because the total precipitation was higher in these runs than in the Re-analyses.
Mean annual snowfall (SWE in mm a−1) for the T42, T106, and Re-Analyses runs compared to SAFRAN data. A vertical gradient (+1% 100 m−1) is included in the total GCM-derived precipitation.
Snow-Cover Simulations
Seasonal snow cover at various elevations
The mean snow water-equivalent (SWE) for the Mont-Blanc region at various elevations was compared to the reference SAFRAN/Crocus climatology in Figure 2. At lower elevations (1500 m and 1800 m), the SWE of the T42 and T106 runs was too low because of the temperature bias. This bias was also visible al high elevations, where the snow-melt season began earlier than in the SAFRAN/Crocus data.
Mean SWE simulated for the T42, T106 and Re-Analyses runs compared to the SAFRAN/Crocus climatology.
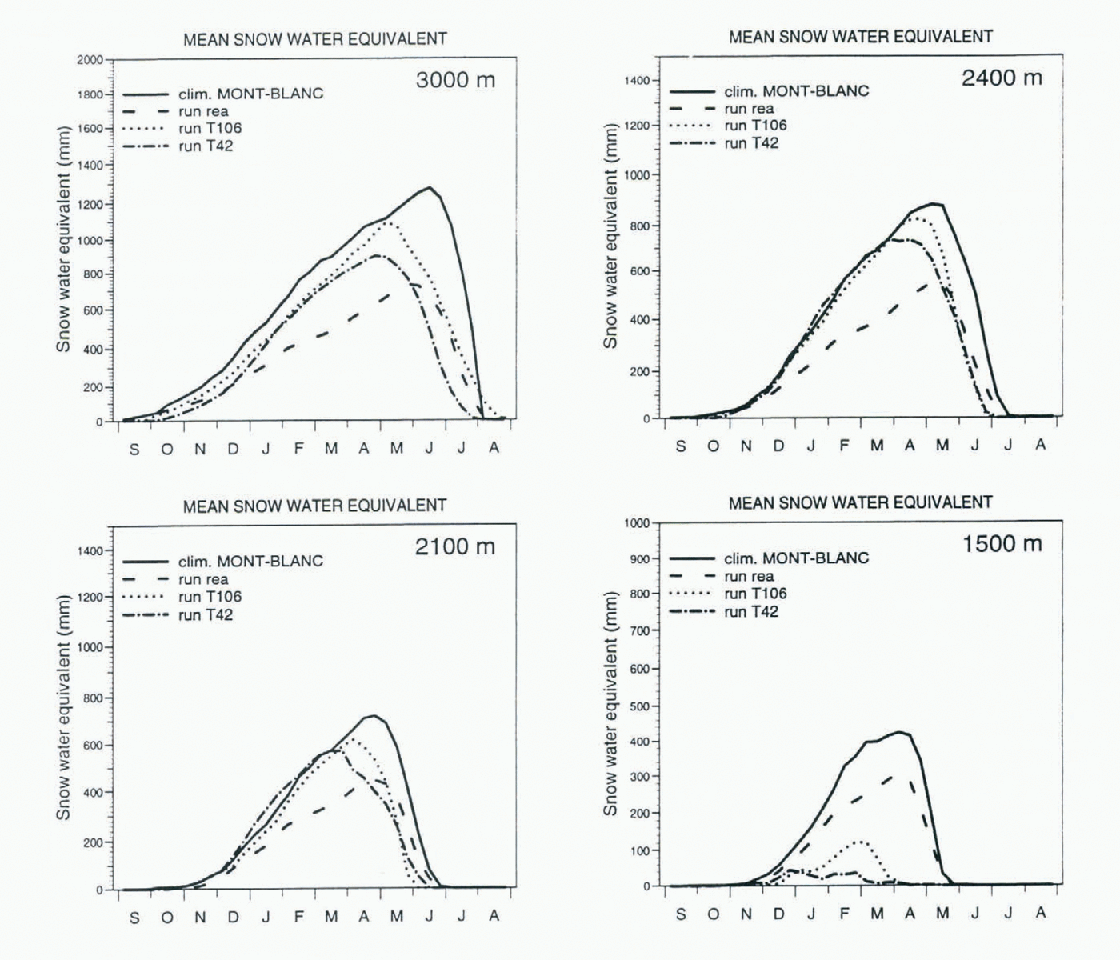
For the Re-analyses runs, the results were better at middle elevations, because both temperature and snowfall were in agreement with the climatology. But at high elevations, despite the fact that the beginning of the snowmelt season was well reproduced, the SWE was poorly reproduced because the simulated total precipitation was strongly underestimated.
Equilibrium line in the Mont-Blanc region
The equilibrium line is defined as the lowest elevation where snow remains all year. It is a good validation parameter, despite the fact it is not easy to obtain from terrain data, because of local effects. Its determination is based on data from glaciers. In the Mont-Blanc region it is generally accepted that this line lies between 3000 and 3200 m a.s.l.
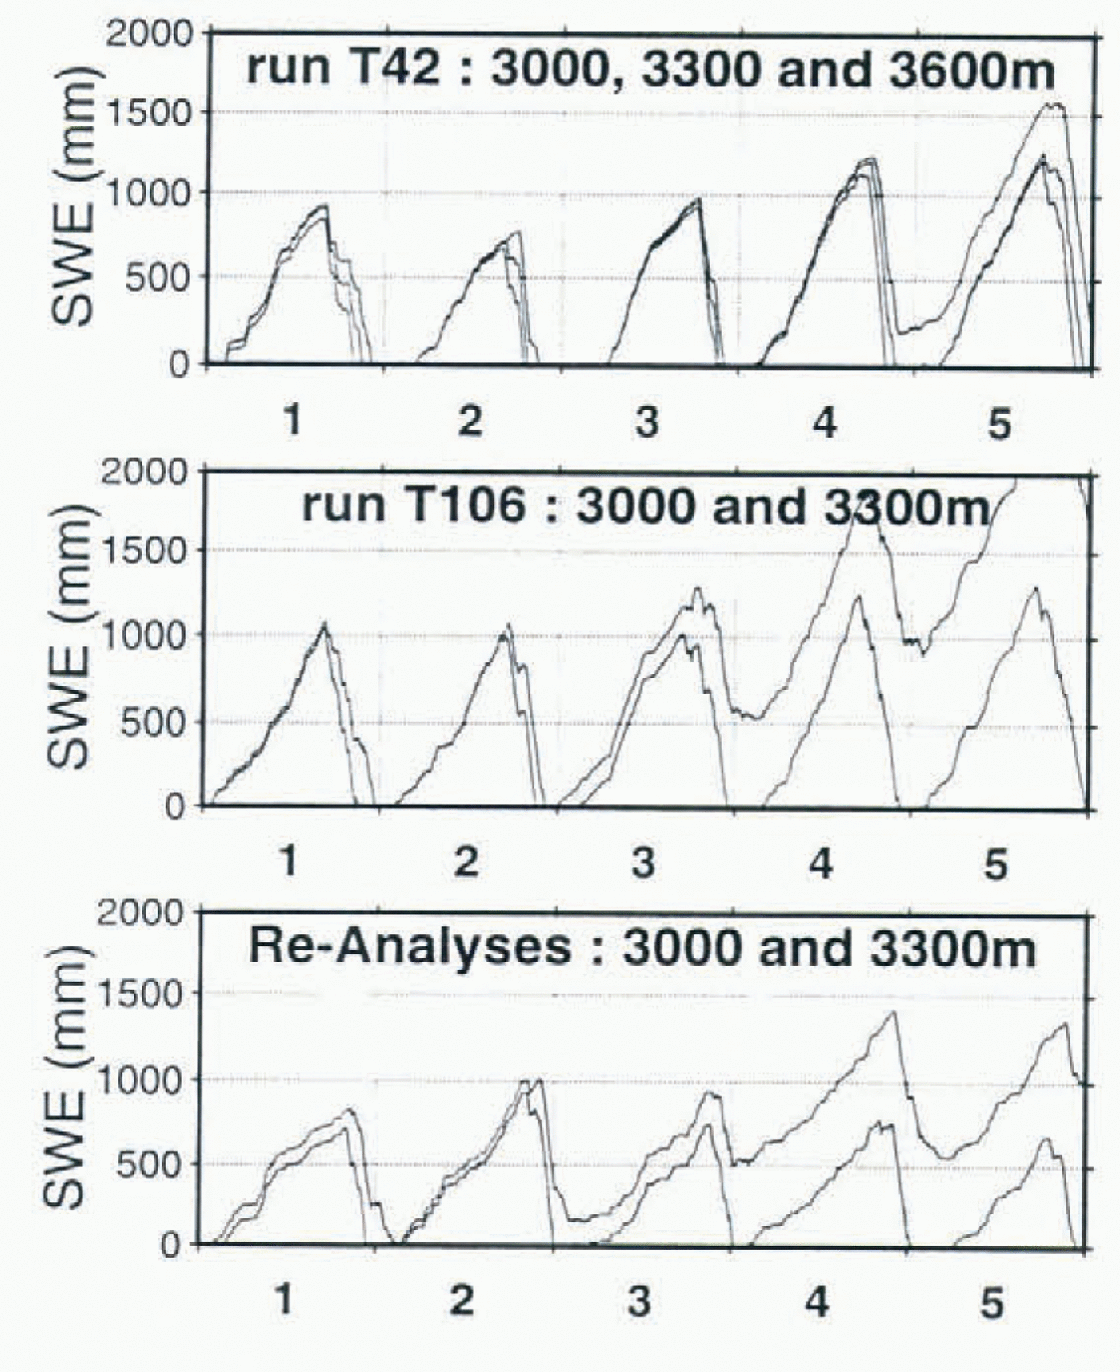
The absence of re-initialisation in the runs meant that the altitude of this line could be checked easily. In the T42 run (Fig. 3), because of badly reproduced snowfalls and temperature, the simulated equilibrium line was near 3600 m. In the T106 simulation, despite a snow-free period during the two first summers, the SWE at 3300 m, at the end of live annual cycles, was 1500 mm, which placed this line between 3000 and 3300 m. In the Re-analyses, the equili-brium line was also found between 3000 and 3300 m. Assuming precipitation and temperature are not too badly reproduced by the GCM, these simulations show that it is possible to find the height of the equilibrium line reasonably accurately.
SWE for the T42, T106 and Re-Analyses runs at 3000, 3300 m (and 3600 m for T42 run) during five annual cycles
Conclusion
The procedure simulating the snow cover above GGM orography was validated against reference data from the Mont-Blanc region. This method has severe limitations because of the coarse input data (e.g. daily time-Steps for precipitation and radiation fluxes). Based only on interpolated GCM outputs, it was not able to reproduce some of the highly variable features of the snow cover found in mountains like the Alps. Nevertheless, the large-scale data were sufficiently accurate to simulate the main features of the northern French Alpine snow cover. Simulation of the middle-elevation snow cover was very sensitive to small temperature errors (T42 and T106 runs). At high elevations, the simulations were less sensitive to temperature and precipitation errors and it was possible to determine the equili-brium line from GCM data with reasonable accuracy. The Re-analyses were not successful in reproducing the snow cover because of the cold temperatures at low elevations and the strong underestimation of precipitation.
This method was used as a “low reference” for testing a downscaling method to reconstitute the Alpine snow cover (Reference Martin, Timhal and BrunMartin and others, 1997). It can be used to compare GCM runs with different resolution and orography. It is hoped that it will be used with low-resolution paleoclimate runs to determine variations of the equilibrium line of ice sheets where orography is badly reproduced (e.g. Scandinavia).



