Introduction
In the marine environment, global climatic changes often cause a shift in the geographic distribution and abundance of species (Rivadeneira & Fernández Reference Rivadeneira and Fernández2005; Parmesan, Reference Parmesan2006; Mieszkowska & Sugden, Reference Mieszkowska and Sugden2016; Sanda et al., Reference Sanda, Hamasaki, Dan and Kitada2019). The fauna of the rocky intertidal zone is an excellent model to investigate the impacts of global change on biota since the ecosystem is common worldwide, although it can be patchy in the Tropical Eastern Pacific compared with temperate East Pacific regions (Fenberg & Rivadeneira, Reference Fenberg and Rivadeneira2019). For intertidal invertebrates, the rocky shore is a harsh habitat with strong selection pressure from both physical (e.g. heat and desiccation stress) and biological (e.g. competition for space) factors (Tomanek & Somero, Reference Tomanek and Somero2002; Helmuth et al., Reference Helmuth, Mieszkowska, Moore and Hawkins2006). Thus, intertidal organisms are sensitive to environmental alterations and show early responses to climate change (Helmuth et al., Reference Helmuth, Mieszkowska, Moore and Hawkins2006; Hawkins et al., Reference Hawkins, Moore, Burrow, Poloczanska, Mieszkowska, Herbert, Jenkins, Thompson, Genner and Southward2008, Reference Hawkins, Sugden, Mieszkowska, Moore, Poloczanska, Leaper, Herbert, Genner, Moschella, Thompson, Jenkins, Southward and Burrows2009). Barnacles are representative organisms on rocky shores and are an ideal model for studying biogeography of intertidal assemblages as they are sessile, highly abundant and have wide distribution along rocky shorelines (Dawson et al., Reference Dawson, Makretsov, Blows, Driver, Provenzano, Le Quesne, Baglietto, Giles, Mclean, Callagy, Green, Ellis, Gelmon, Turashvili, Leung, Aparicio, Huntsman and Caldas2010; Chan & Lee, Reference Chan, Lee and Lawrence2012). The geographic distribution of adult intertidal barnacles is dependent on planktonic larval for dispersal in ocean currents and range shifts are easily detected (Chan et al., Reference Chan, Tsang and Chu2007; Reference Chan, Akihisa and Lee2008a; Chan & Lee, Reference Chan, Lee and Lawrence2012).
The effects of climate change on distributions of marine species have been extensively studied in the UK with the support of long-term monitoring coupled with a time-series modelling project ‘Marine Biodiversity and Climate Change' (MarClim) (Mieszkowska & Sugden, Reference Mieszkowska and Sugden2016). In the UK, distribution patterns of intertidal communities in the Western English channel over the past 70 years show that global warming has enhanced survival, expanded ranges and abundance of warm-water species (e.g. the barnacle Chthamalus stellatus) and has reduced the abundance of cold-water species (e.g. the barnacle Semibalanus balanoides) (Southward et al., Reference Southward, Hawkins and Burrows1995; Thompson et al., Reference Thompson, Crowe and Hawkins2002; Mieszkowska et al., Reference Mieszkowska, Burrows, Pannacciulli and Hawkins2014; Mieszkowska & Sugden, Reference Mieszkowska and Sugden2016). In the Eastern Pacific, the intertidal owl limpet Lottia gigantean and the barnacle Tetraclita rubescens extended its northern range several hundreds of km from San Francisco, USA, due to the interaction of the migration of maladapted genes to peripheral regions and with reduced selection under environmental changes including heat waves (Dawson et al., Reference Dawson, Makretsov, Blows, Driver, Provenzano, Le Quesne, Baglietto, Giles, Mclean, Callagy, Green, Ellis, Gelmon, Turashvili, Leung, Aparicio, Huntsman and Caldas2010; Sanford et al., Reference Sanford, Sones, García-Reyes, Goddard and Largier2019). Compared with the Atlantic, including the UK and the Eastern Pacific, the effect of climate change on the distribution of intertidal species in the Indo-Pacific has received relatively little attention. In the west Pacific, the acorn barnacle Hexechamaesipho pilsbryi has expanded its distribution into tropical waters due to increased water temperatures and a shift in ocean currents (Chan et al., Reference Chan, Hsu and Southward2008c; Tsang et al., Reference Tsang, Wu, Ng, Williams, Chan, Chu, Held, Koenemann and Schubart2011). One of the invasive barnacles from European waters, Perforatus perforatus, was introduced to Korean waters and it is expected its range will be expanded (Choi et al., Reference Choi, Choi, Kim and Hong2013). Comparable changes in species composition can affect vertical zonation, geographic distribution and gene flow among populations of intertidal organisms (Southward, Reference Southward1991; Southward et al., Reference Southward, Hawkins and Burrows1995; Thompson et al., Reference Thompson, Crowe and Hawkins2002; Helmuth et al., Reference Helmuth, Mieszkowska, Moore and Hawkins2006; Mieszkowska et al., Reference Mieszkowska, Hawkins, Burrows and Kendall2007; Yorisue et al., Reference Yorisue, Ellrich and Momota2019).
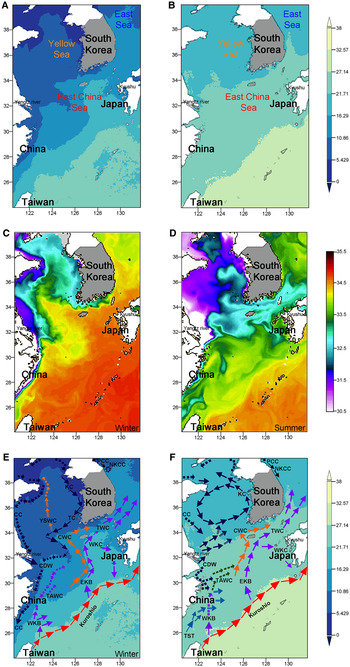
The Indo-West Pacific region displays the highest marine biodiversity in the world (Roberts et al., Reference Roberts, McClean, Veron, Hawkins, Allen, McAllister, Mittermeier, Schueler, Spalding, Wells, Vynne and Werner2002). The region is characterized by the presence of marginal seas and complex oceanographic current systems and the biogeography of species are affected by different hydrographic regimes and also geological events (Tsang et al., Reference Tsang, Chan, Wu, Ng, Chatterjee, Williams and Chu2008; Dong et al., Reference Dong, Wang, Han, Ke, Zhan, Nakano and Williams2012; Chan et al., Reference Chan, Kolbasov, Hirose, Mezaki and Suwae2014; Ni et al., Reference Ni, Li, Kong and Yu2014; Yu et al., Reference Yu, Wang, Wang, Huang and Dong2014; Wang et al., Reference Wang, Tsang and Dong2015; Wu et al., Reference Wu, Tsang, Chan and Chu2015; Ma et al., Reference Ma, Chow, Wong, Chen, Ip, Schubart, Tsang, Chan and Chu2019). The Korean Peninsula is surrounded by three marginal seas; the Yellow, East China and East Seas. Kim (Reference Kim1973, Reference Kim1977) divided the coastal waters of the Korean Peninsula into three biogeographic regions; the Yellow Sea on the west coast, the Korean Strait on the South Coast and the East Sea on the east coast in consideration of species diversity, geographic distribution and abundance patterns of intertidal assemblages. Kim (Reference Kim1982) and Cha et al. (Reference Cha, Buddemeier, Fautin and Sandhei2004) further separated Jeju Island from the Korean Strait region as a fourth biogeographic zone, based on the geographic distribution of marine crab and sea anemone assemblages. However, more recent oceanographic studies based on differences in temperature, salinity and zooplankton biomass (Rebstock & Kang, Reference Rebstock and Kang2003; Han & Lee, Reference Han and Lee2020; Figure 1) revealed three oceanographic zones, including the Yellow Sea, East China Sea and East Sea. The division of these three oceanographic zones were also supported by Spalding et al. (Reference Spalding, Fox, Allen, Davidson, Ferdaña, Finlayson, Halpern, Jorge, Lombana, Lourie, Martin, McManus, Molnar, Recchia and Robertson2007) who defined Korean waters as being located in the Northern Temperate Pacific Province, with three distinct ecoregions, the Yellow Sea, the Sea of Japan (=East Sea) and East China Sea ecoregions.
Oceanographic map of the South Korea and adjacent waters, generated from the Giovanni database, NASA, USA. (A, B) Horizontal distributions of seasonal mean sea surface temperature and the contour lines of mean sea surface temperature in winter and summer in the period of 2016–2018 are shown by dashed lines; (C, D) Horizontal distributions of seasonal mean salinity; (E, F) Seasonal surface circulation for winter and summer in Korea, modified from Lie and Cho (Reference Lie and Cho2016). CC, Chinese Coastal Current; CDW, Changjiang Diluted Water; CWC, Cheju Warm Current; EKB, Eastern Kuroshio Branch; KC, Korean Coastal Current; TAWC, Taiwan Warm Current; TC, Yellow Sea Transversal Current; TWC, Tsushima Warm Current; WKB, Western Kuroshio Branch; WKC, Western Kyushu Current; YSWC, Yellow Sea Warm Current; PCC, Primorye Cold Current; NKCC, North Korea Coastal Current.

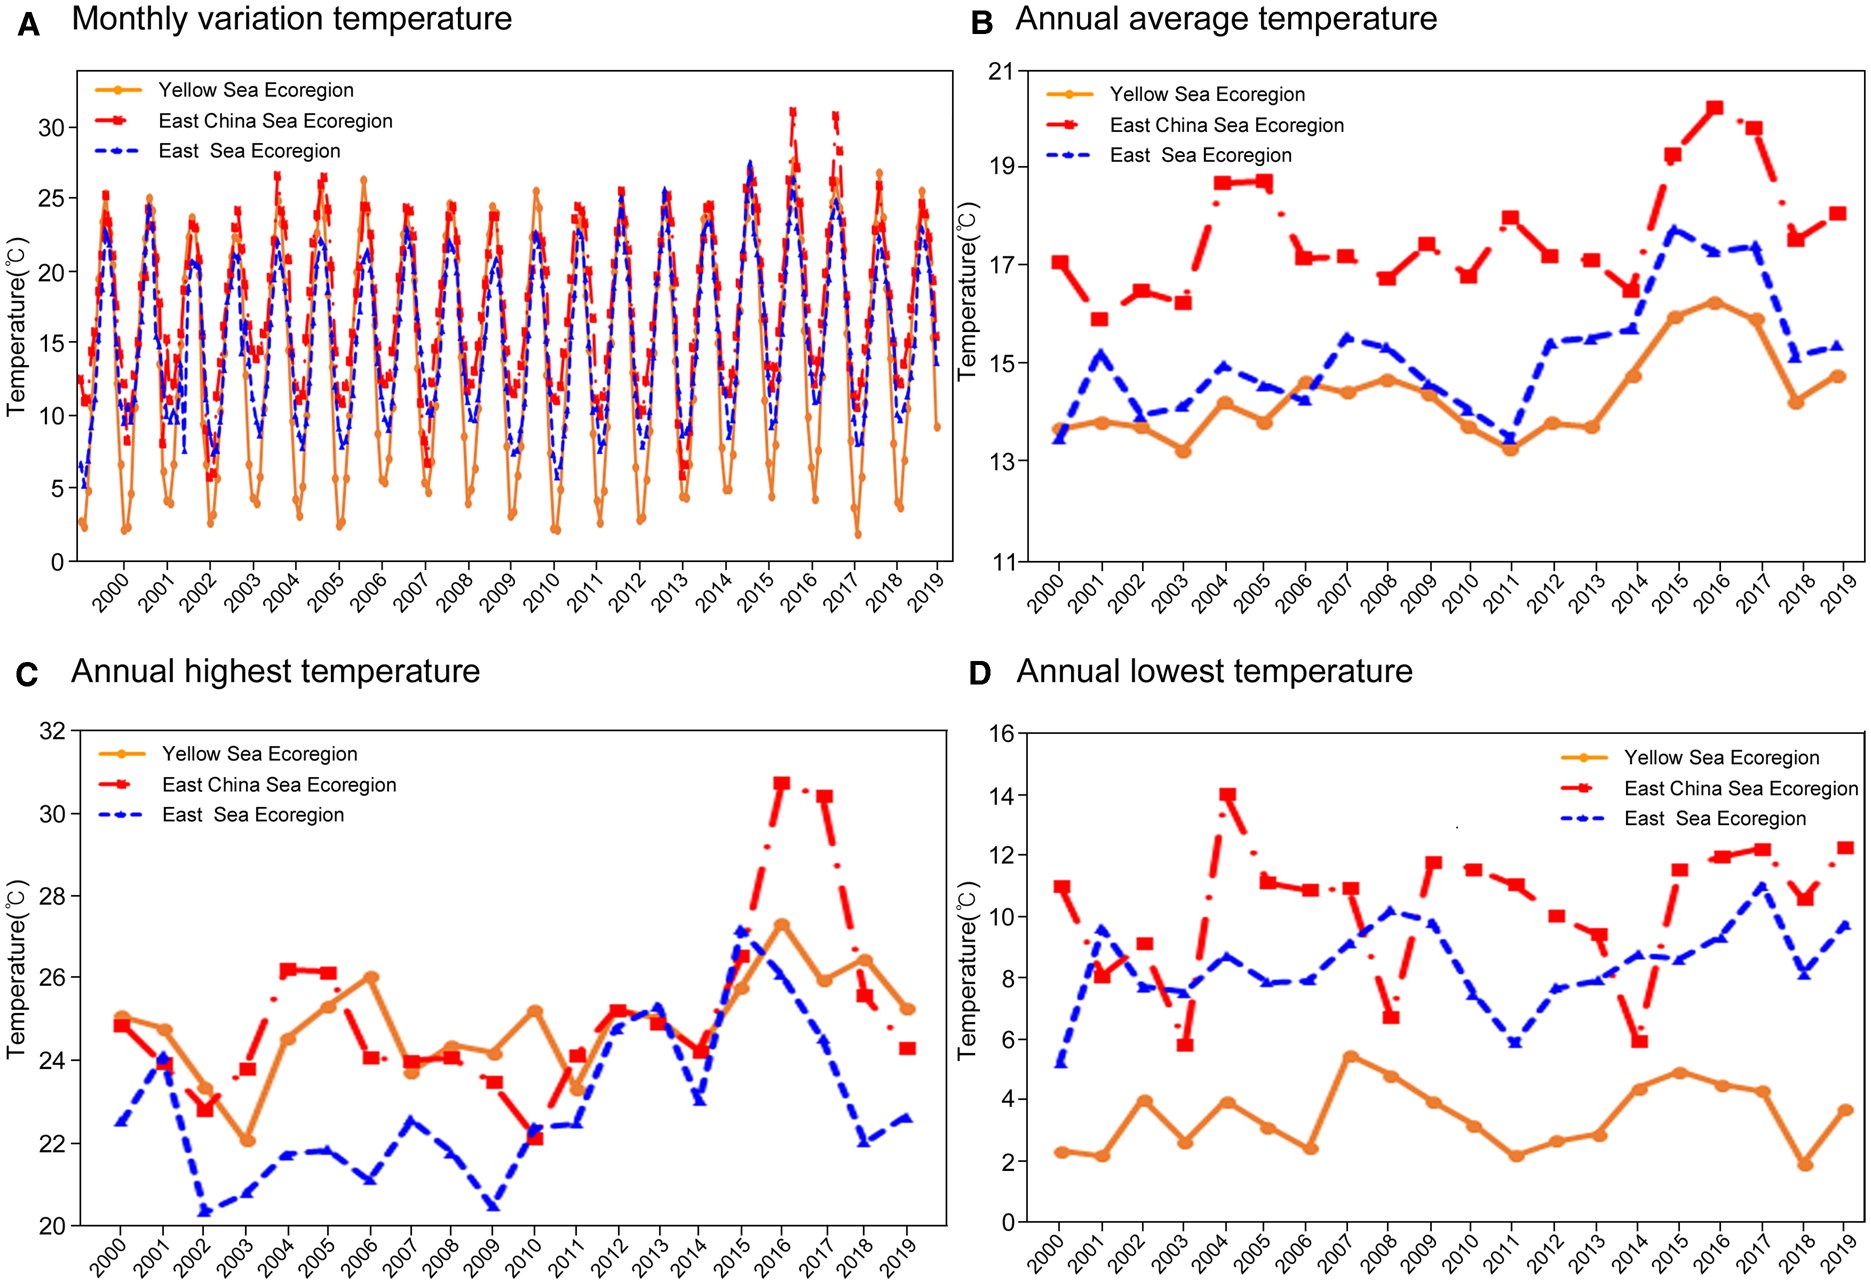
Under the influence of global climatic change, seawater temperature in the world has an increasing trend of 0.05°C per decade (Intergovernmental Panel on Climate Change, 2019). In the last 51 years, an increase of 1.23°C has been recorded, with an especially prominent increase in Korean waters some 2.5 times greater than the global trend (Belkin, Reference Belkin2009; Han & Lee, Reference Han and Lee2020). Seawater temperature in all three ecoregions showed an upward trend from 1968 to 2018 (Han & Lee, Reference Han and Lee2020; Figure 2). It is important to survey the distribution patterns of intertidal barnacles along the coastlines of these oceanographic ecoregions. Such patterns can be compared with historical records (i.e. taxonomic records and previous literature, see Mieszkowska & Sugden, Reference Mieszkowska and Sugden2016) to assess changes and will provide data with which to predict future distribution changes assuming continued global climatic warming (Hawkins et al., Reference Hawkins, Moore, Burrow, Poloczanska, Mieszkowska, Herbert, Jenkins, Thompson, Genner and Southward2008).
Variation in sea surface temperature recorded by Korea Hydrographic and Oceanographic Agency (2017), at Incheon (Yellow Sea ecoregion), Tongyeong (East China Sea ecoregion) and Sokcho (East Sea ecoregion) sites. (A) Monthly temperature, (B) average annual temperature, (C) highest annual temperature, (D) lowest annual temperature from 2000–2017. Note there is an obvious increase in all temperature parameters from 2010–2018.

In the present study, we conducted a survey of intertidal and shallow water barnacles at 44 locations in South Korea, following the boundary definition of the three marine ecoregions in Rebstock & Kang (Reference Rebstock and Kang2003) and Spalding et al. (Reference Spalding, Fox, Allen, Davidson, Ferdaña, Finlayson, Halpern, Jorge, Lombana, Lourie, Martin, McManus, Molnar, Recchia and Robertson2007). Distribution patterns of native and invasive species were displayed on oceanographic maps including sea surface temperatures, chlorophyll a concentrations and salinity. We hypothesize that the biogeography of barnacle species assemblages is different among different marine ecoregions in the Korean Peninsula.
Materials and methods
The Korean oceanographic ecoregions, study sites and sampling
The west and south-west coasts of the Korean peninsula are under the influence of the Yellow Sea. Spalding et al. (Reference Spalding, Fox, Allen, Davidson, Ferdaña, Finlayson, Halpern, Jorge, Lombana, Lourie, Martin, McManus, Molnar, Recchia and Robertson2007) considered this region as the Yellow Sea ecoregion, which is characterized by cold and saline water in winter and warm and low salinity water in summer. During the winter, the coastline bordering the Yellow Sea ecoregion is affected by the Korean Coastal Current flowing from the northern part of the Peninsula. This current brings in low seawater temperature (below 10°C in winter) (Figures 1A & 2). The Yellow Sea ecoregion shows a slightly higher chlorophyll a concentration than the other two ecoregions due to the influence of the coastal current. In summer, the Coastal Current is weaker due to the influence of monsoon wind stress (Jacobs et al., Reference Jacobs, Hur and Riedlinger2000; Koh & Khim, Reference Koh and Khim2014; Wu et al., Reference Wu, Shen, Zhu, Zhang and Li2014; Lie & Cho, Reference Lie and Cho2016). Further, the Yellow Sea receives a substantial input of fresh water from the Yangtze River, which can lower salinity to 31–32‰ (Figure 1C, D). The East China Sea ecoregion is affected by the Cheju and Tsushima Warm Currents which branch from Kuroshio (Nitani, Reference Nitani1972; Guan, Reference Guan1994). As a result, this region experiences warmer seawater and high salinity (Figure 1).
The southern coastlines and Jeju Island bordering the East China Sea are affected by the Cheju and Tsushima Warm Currents. This region experiences warmer seawater and high salinity (Lim et al., Reference Lim, Lee, Jeung, Noseworthy, Jung and Choi2019). This ecoregion was named the East China Sea ecoregion (Spalding et al., Reference Spalding, Fox, Allen, Davidson, Ferdaña, Finlayson, Halpern, Jorge, Lombana, Lourie, Martin, McManus, Molnar, Recchia and Robertson2007). The east coast of the Korean Peninsula faces the East Sea and is influenced by the Primorye and North Korean Cold Currents from the north and the Tsushima Current from the south (hereafter named as East Sea ecoregion). The hydrography of the East Sea ecoregion is characterized by both low water temperature and high salinity. The East Sea ecoregion is affected by the cold North Korean Coastal Current from the north in both summer and winter (Figure 1E, F). Average sea surface temperatures vary from 10°C in winter to 25°C in summer (Korea Hydrographic and Oceanographic Agency, 2017, accessed online 30 March 2020; Figure 2).
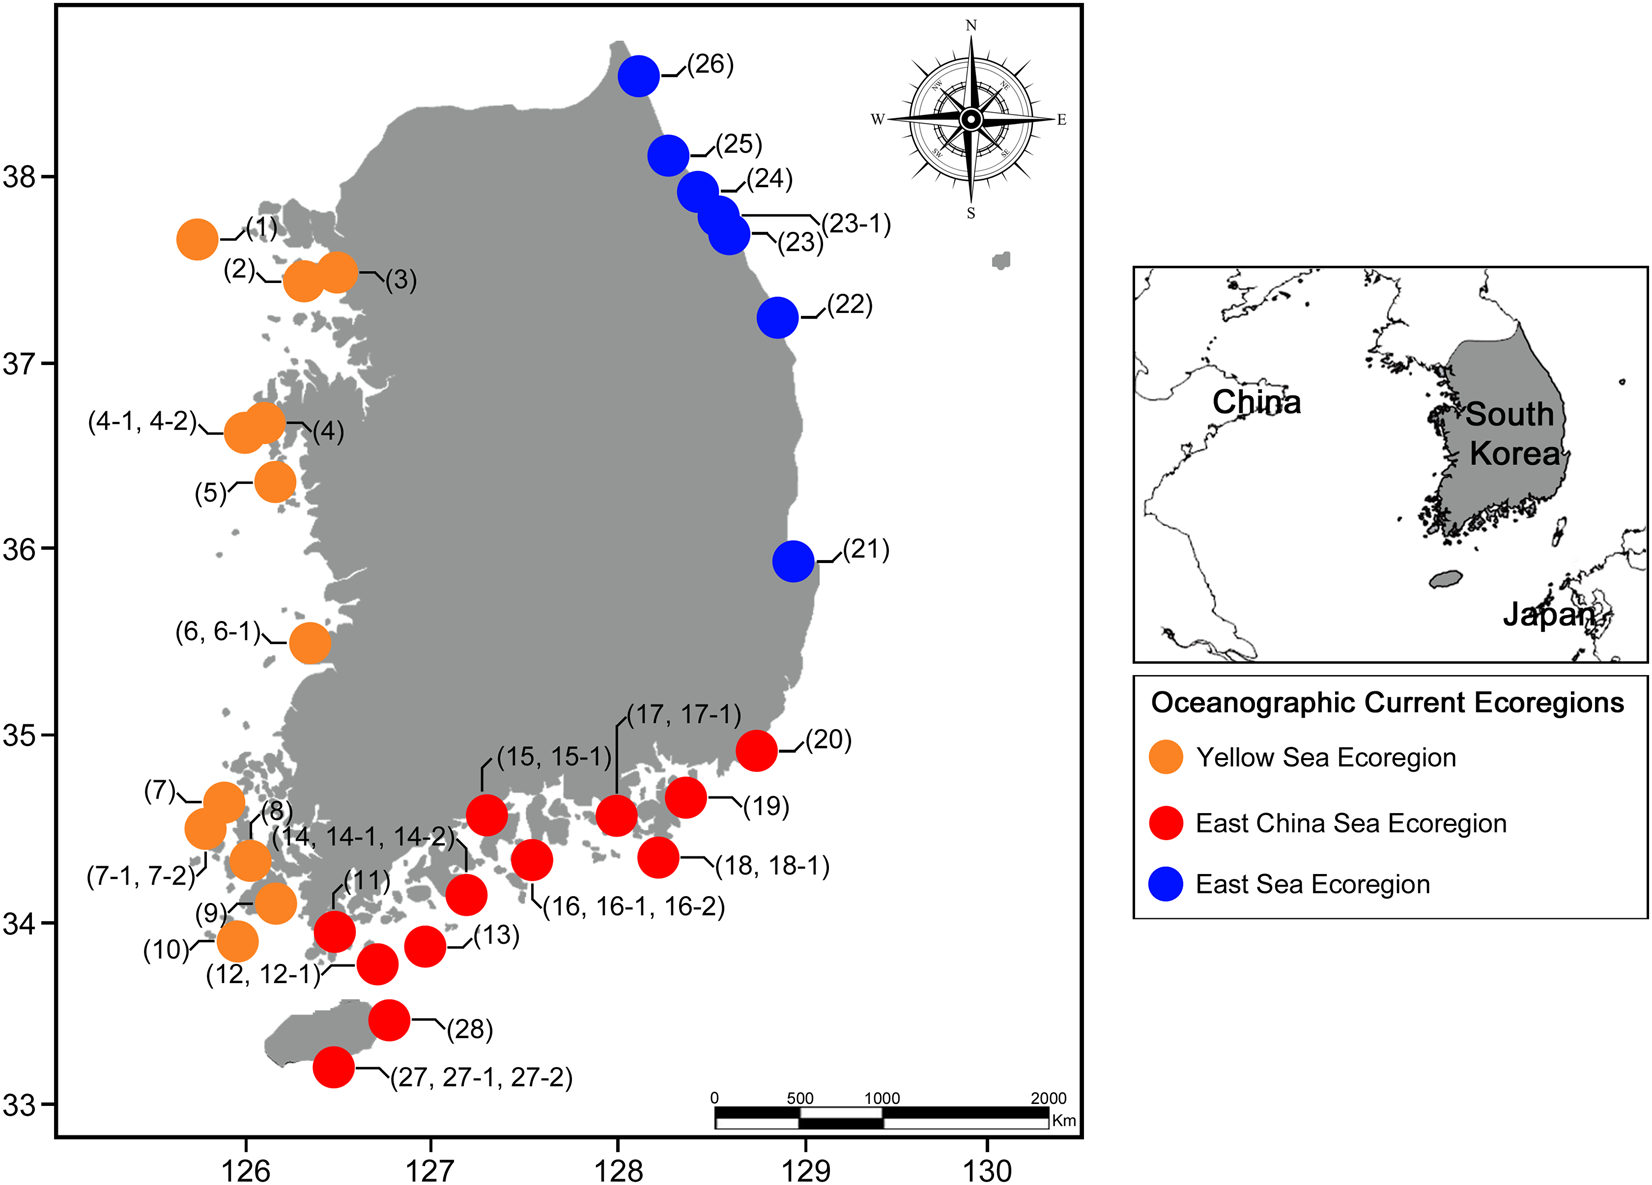
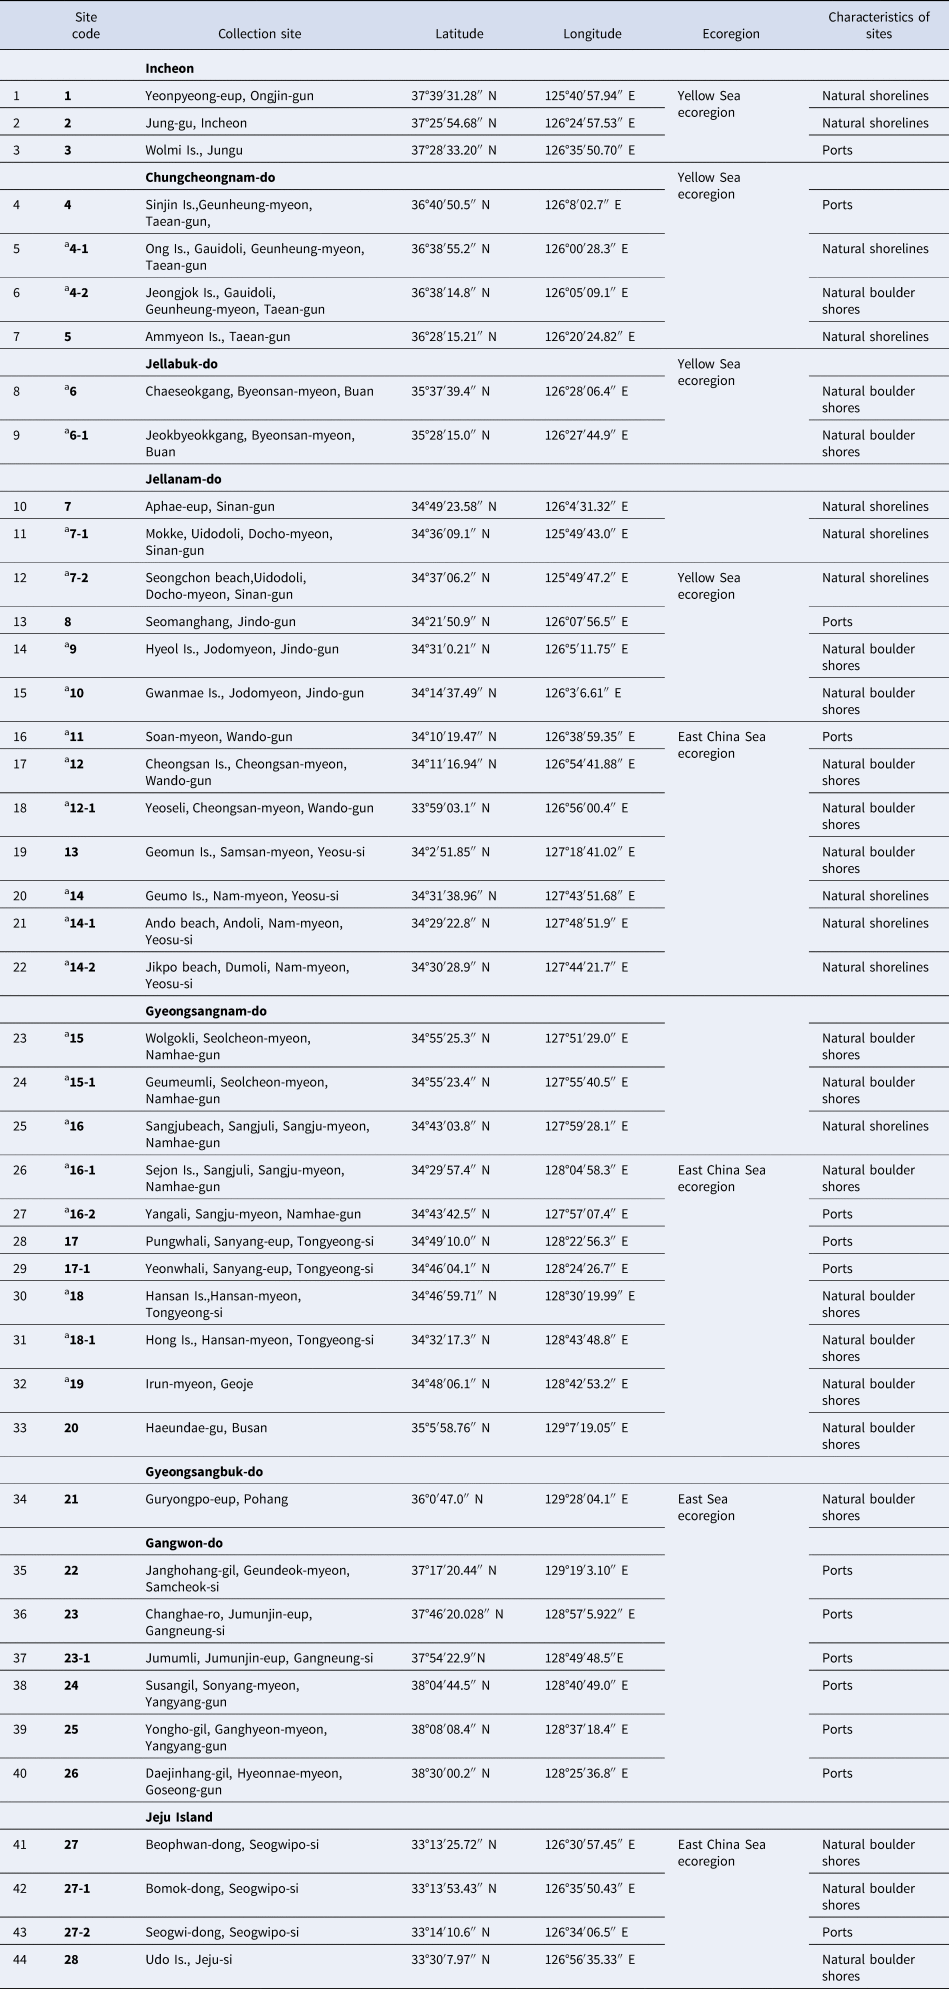
Barnacles (species presence or absence data) were collected from 44 locations along all coastlines of Korea from 2016 to 2018 (Figure 3, Table 1). At each site, barnacle species were collected for >1–2 h until no additional species were found. Most of the barnacles were found on primary hard substratum. Occasional barnacle samples were also collected on the shells of limpets and gastropods. Most of the sites are natural rocky shores, which are composed of sloping platforms, large boulders and with exposures ranging from semi-exposed to exposed. There are 14 sites which are located within ports which were included to meet the aim of surveying for invasive species. At each site with rocky shores, barnacles were collected from 30–50 m stretches of rocky shore from the entire intertidal zone during low tide. Shallow water barnacles were collected with a hammer and chisel at depths of 5–20 m by scuba diving. Barnacles in ports were collected on 20–30 m long seawall surfaces, using chisels secured on a long rod and a net on a long rod for collection. Fifteen sites were in the Yellow Sea ecoregion (including eight sites which are on outlying islands without public transportation access possible, protected by the Korea Marine National Park Service, and are relatively free of anthropogenic influences). Twenty-two sites were selected along the southern coast that is influenced by the East China Sea ecoregion including four sites at Jeju Island and 14 in Marine National Park areas. Seven sites were selected along the eastern coast of Korea that borders the East Sea ecoregion. All barnacle specimens were preserved in 95% ETOH. Identification of barnacles followed Chan et al. (Reference Chan, Garm and Høeg2008b). Barnacle species data were presented as absence or presence data in each site for subsequent statistical analysis.
Collection sites located in different oceanographic current ecoregions. Map showing the site numbers. Colour of site indicates the marine ecoregions. For details of site information, refer to Table 1.

Detailed collection sites from 2016 to 2018 in Korea

a Marine National Park areas of Korea protected by Korea Marine National Park Service.
Environmental factors
Oceanographic maps of average sea surface temperatures, chlorophyll a concentrations and salinity from December 2016 to November 2018 were derived from Giovanni and NASA databases (Giovanni database, NASA, USA, accessed online 13 December 2011). Satellite-derived sea surface temperature and remotely sensed estimates of chlorophyll a concentration, collected by the moderate resolution imaging spectro-radiometer (MODIS-) Aqua MODISA satellite at an estimated 4 km resolution were extracted and used to generate seasonal means for summer (from June–August) and winter (from December–February). Satellite maps of salinity were obtained from SMAP salinity maps (SMAP sea surface salinity, NASA, USA, accessed online 13 December 2018) and averaged over summers and winters from 2016–2018 (Figure 1). Seasonal variations of sea surface circulation patterns in winter and summer were modified from Lie & Cho (Reference Lie and Cho2016) (Figure 1E, F).
Multivariate analysis in different marine ecoregions
To investigate whether the distribution patterns of barnacle assemblages were diagnostic to different marine ecoregions, multivariate analysis (using species as variables) were performed in the PRIMER package (v6, Plymouth Routine in Multivariate Analysis, PRIMER-E Ltd; Clarke & Gorley, Reference Clarke and Gorley2006). The site codes under the same numerical heading, i.e. (4, 4-1, 4-2), (6, 6-1), (7, 7-1, 7-2), (12, 12-1), (14, 14-1, 14-2), (15, 15-1), (16, 16-1, 16-2), (17, 17-1), (18, 18-1), (23, 23-1), (27, 27-1, 27-2) (see Table 1) are located relatively close to each other and have the same species composition. These sites under the same numerical setting heading were pooled for the analysis. Data on species present or absent were calculated with the Sorensen similarity index for the 21 species and sites as replicates within the three marine ecoregions (N = 10 in the Yellow Sea, N = 12 in the East China Sea, N = 6 in the East Sea). Non-metric Multidimensional Scaling (nMDS; Clarke, Reference Clarke1993) was conducted to generate two-dimensional plates on the species composition in all sites. Analysis of Similarity (ANOSIM) and Global R tests was used to test the similarity of the three marine ecoregions. Analysis of similarity percentage (SIMPER) was used to identify the species primarily providing the average per cent dissimilarity in the contribution of barnacle assemblages among the ecoregions.
Results
Native species composition and diversity
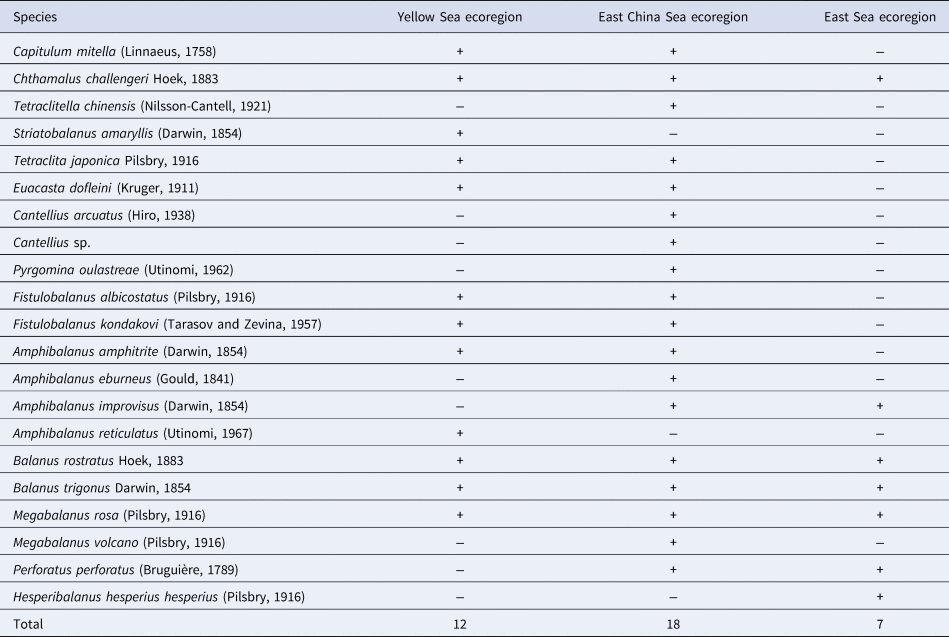
A total of 21 barnacle species belonging to 14 genera were recorded in the study site from all marine ecoregions in Korea. The diversity of barnacles was variable among oceanographic current ecoregions. Twelve species were recorded in the Yellow Sea ecoregion and 18 species were recorded in the East China Sea ecoregion (Table 2). Between the two current ecoregions, overlap in the distribution of 10 species was detected. The stalked barnacle Capitulum mitella and the acorn barnacle Tetraclita japonica were common in the mid-littoral zone in the Yellow Sea and East China Sea ecoregions; these species are rare on the eastern coast inside the East Sea ecoregion. The mangrove barnacle Fistulobalanus albicostatus was also recorded in the Yellow Sea (90% of the sites) and East China Sea (60% of the sites) ecoregions but absent from the East Sea ecoregion. This species is mainly attached to the rocks or on other marine crustacean shells of intertidal mudflats. The barnacles Striatobalanus amaryllis and Amphibalanus reticulatus were only recorded in the Yellow Sea ecoregion. These species are distributed from the low intertidal zone to shallow water (up to 15 m depth). Three coral associated barnacles, Cantellius arcuatus, Cantellius sp. and Pyrgomina oulastreae were recorded only in the East China Sea ecoregion. In the East Sea ecoregion, seven species were recorded (Table 2). Of these, the cold water species Hesperibalanus hesperius hesperius and Amphibalanus improvisus were found attached on the surfaces of molluscan shells.
Summary of presence and absences of barnacle species collected in the different ecoregions of Korea (+:presence, −:absence)

There are four common barnacles that are present in all marine ecoregions of Korea: Chthamalus challengeri, Balanus rostratus, Balanus trigonus and Megabalanus rosa. The intertidal barnacle, C. challengeri, is common from the mid-littoral to the supra-littoral zones of the rocky shore. The remaining three species were found not in the intertidal zone but attached to buoys or on the surfaces of molluscan shells.
Presence/absence of species in relation to different marine ecoregions
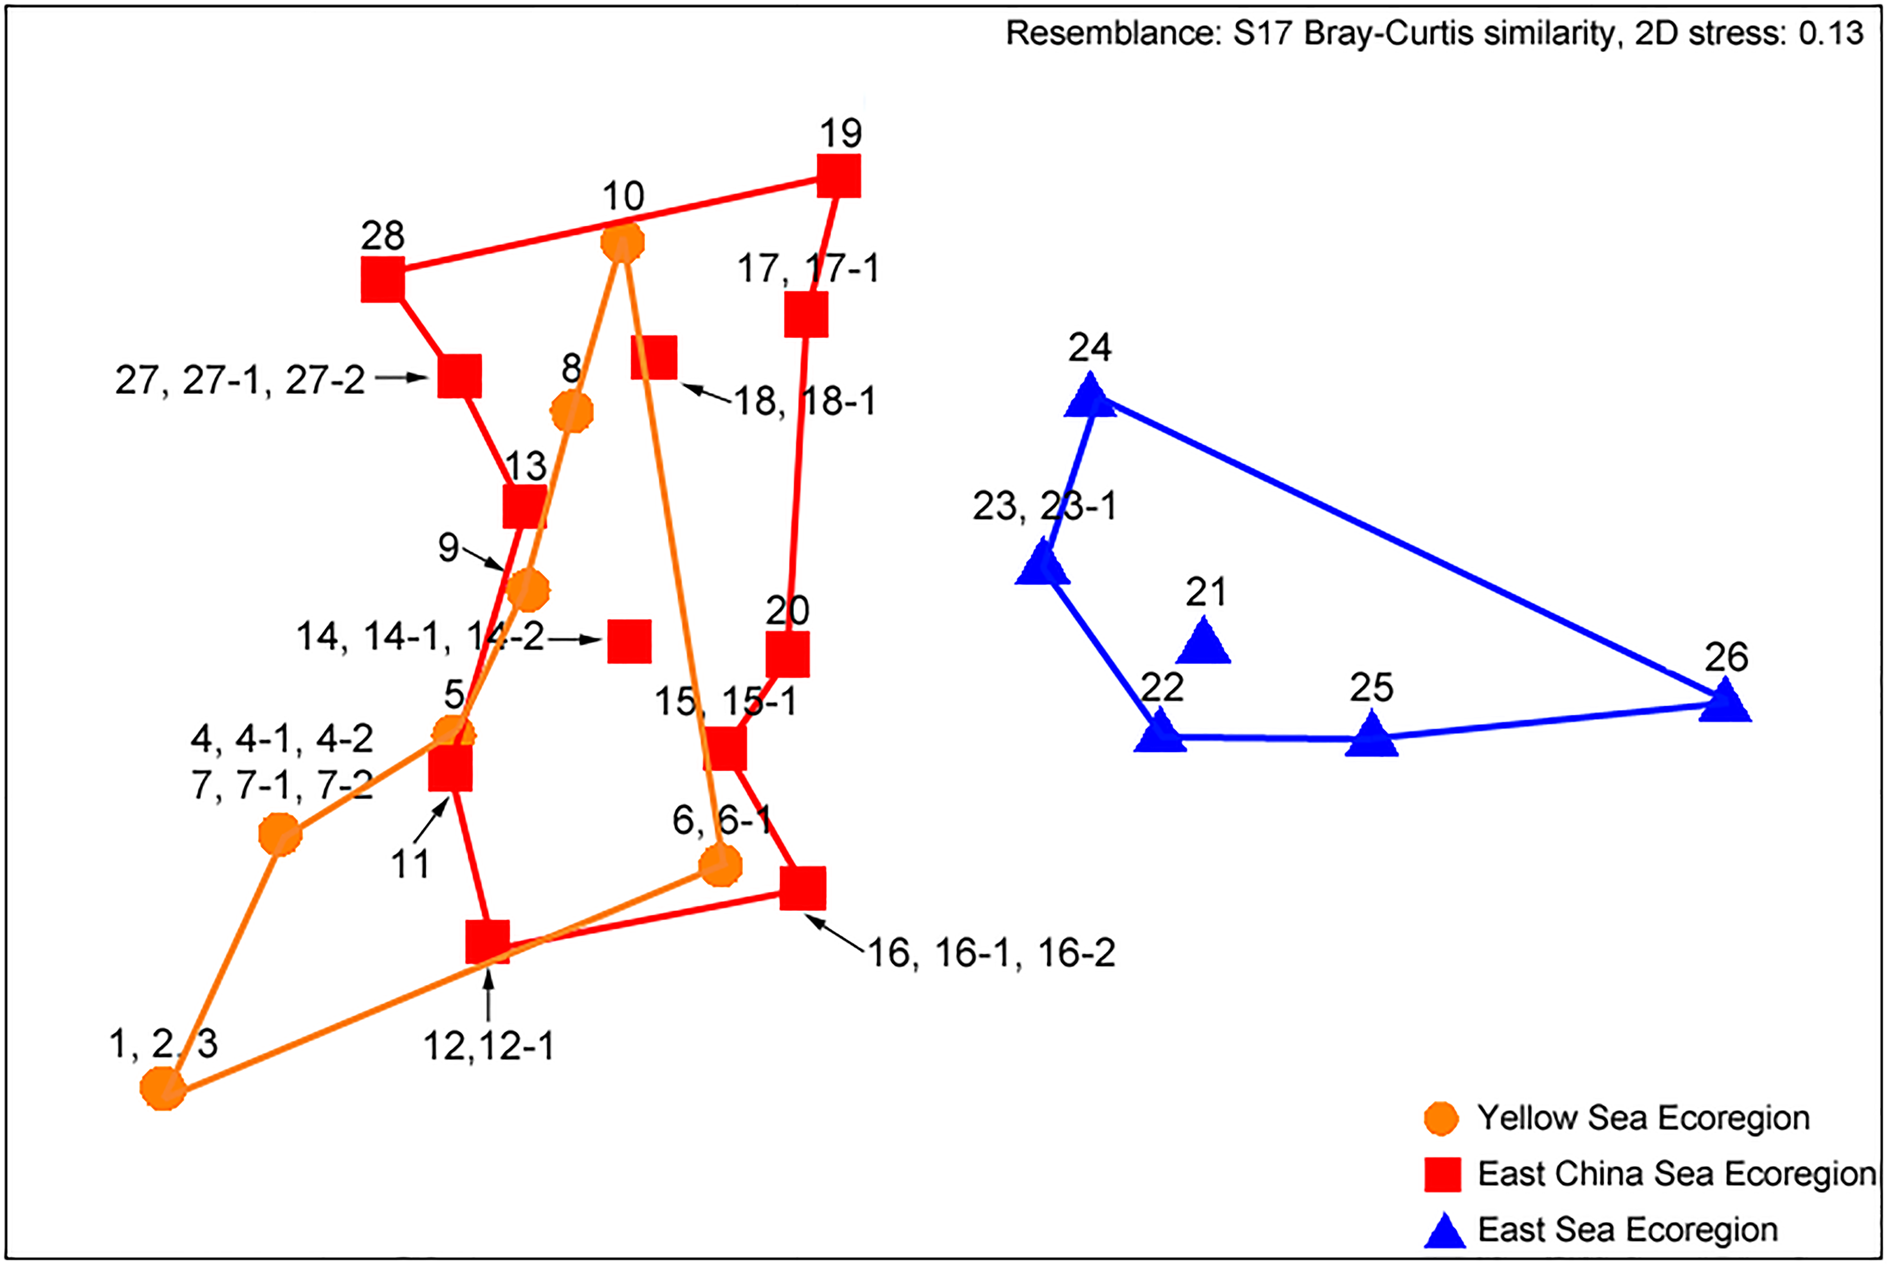
The non-metric multidimensional scaling (nMDS) ordination plots of the species abundance in relation to different current ecoregions using the Sorensen similarity index formed distinct clusters. The Yellow Sea and East China Sea ecoregions formed overlapping clusters, but the clusters of the East Sea ecoregion were distinct and clearly separated from other ecoregions (Figure 4).
Non-metric nMDS plots on the species compositions in all collecting sites from different current ecoregions in Korea. The site code under the same numerical heading, i.e. (4, 4-1, 4-2), (6, 6-1), (7, 7-1, 7-2), (12, 12-1), (14, 14-1, 14-2), (15, 15-1), (16, 16-1, 16-2), (17, 17-1), (18, 18-1), (23, 23-1), (27, 27-1, 27-2) (see Table 1) are located relatively close to each other and have the same species composition. These sites under the same numerical heading were pooled for the analysis and represent one site ordination in the nMDS plot. Note the ordination of sites from 1 to 3 and 4 and 7 overlapped due to same species composition.

The ordination patterns in the nMDS plots were statistically supported by the ANOSIM analysis, which showed significant differences in barnacle assemblages among the current ecoregions (R = 0.503, P < 0.001). In the nMDS plot, there are relatively large overlaps of the clusters between the Yellow Sea and East China Sea ecoregions, while the clusters in the East Sea were separate from the other two ecoregions. In pairwise ANOSIM comparisons, all current ecoregions were statistically discriminant from one another. Yellow Sea ecoregion vs East China Sea ecoregion, R = 0.25, P < 0.08; Yellow Sea ecoregion vs East Sea ecoregion, R = 0.78, P < 0.001; East China Sea ecoregion vs East Sea ecoregion, R = 0.66, P < 0.001, suggesting that barnacle assemblages are associated with ecoregions.
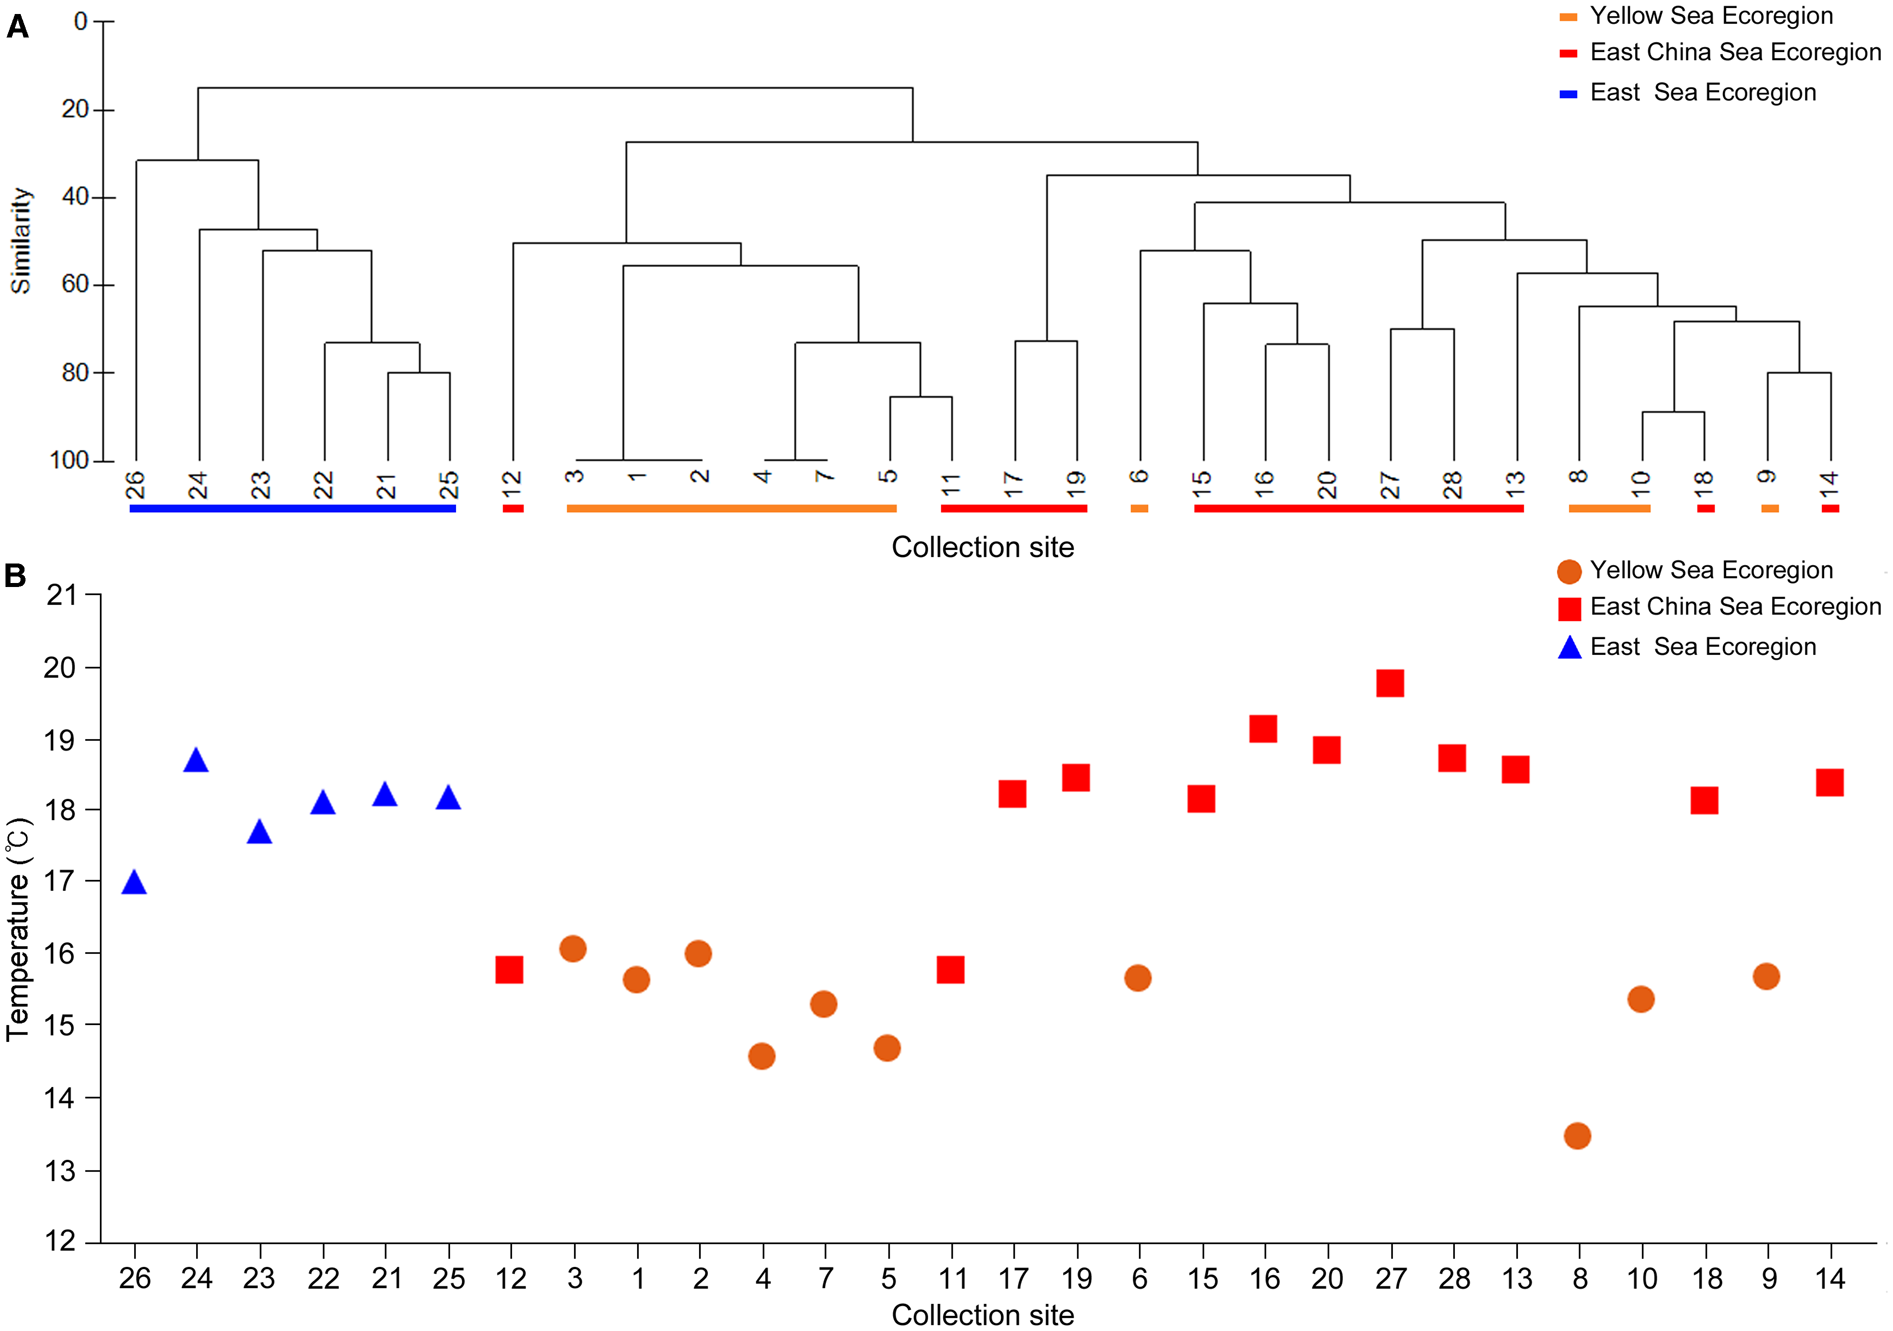
From the cluster analysis, the similarity of the barnacle assemblages between the Yellow Sea and East China Sea mingled together. Based on a criteria of <20% similarity, only two main clusters were identified: the Yellow Sea + East China Sea ecoregions and East Sea ecoregion. This means the composition of barnacle species in the East Sea ecoregion is strongly different (Figure 5).
(A) Cluster dendrogram showing the similarity based on the species compositions at all collecting sites from different marine ecoregions. Some sites were marked with a representative number due to same species composition between number and sub-numbers; (B) average sea surface temperature in all the collection sites during 2016–2018 from Korea Hydrographic and Oceanographic Agency (2017).

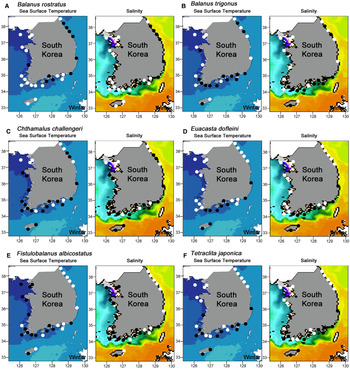
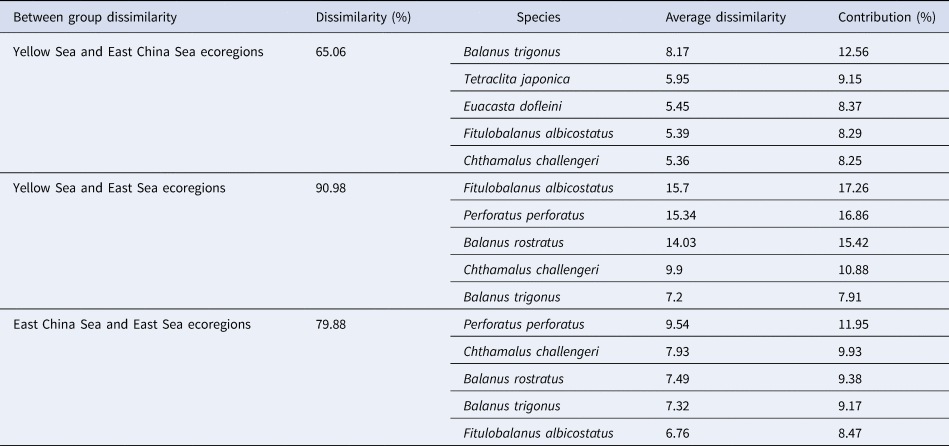
From the similarity percentage analysis (SIMPER), the average dissimilarity between pairs of current ecoregions ranged from 65.06% (Yellow Sea vs East China Sea ecoregion), 79.88% (East China Sea vs East Sea) and to 90.98% (Yellow Sea vs East Sea ecoregion). Fistulobalanus albicostatus, Balanus trigonus, Euacasta dofleini, T. japonica and Chthamalus challengeri contributed a total of 46.3% dissimilarity between the Yellow Sea and East China Sea ecoregions. Euacasta dofleini and Balanus trigonus are more abundant in the East China Sea ecoregion and contribute to reduced abundance in the Yellow Sea ecoregion. By comparing the Yellow Sea and East Sea ecoregions, F. albicostatus, Perforatus perforatus, B. rostratus, C. challengeri and B. trigonus contributed a total of 68.3% dissimilarity. Perforatus perforatus, C. challengeri, B. rostratus, B. trigonus and F. albiscostatus contributed 48.8% of the dissimilarity between the East China Sea and East Sea ecoregions (Table 3, Figure 6).
Distribution pattern of the diagnostic species among oceanographic ecoregion identified from SIMPER analysis. (A) Balanus rostratus, (B) Balanus trigonus, (C) Chthamalus challengeri, (D) Euacasta dofleini, (E) Fistulobalanus albicostatus, (F) Tetraclita japonica, which contribute to the dissimilarity among different current ecoregions. Black circle: present, white circle: absent.

SIMPER analysis results from pairwise comparisons of three different ecoregions based on between group dissimilarity for each pairwise combination of ecoregions

Invasive barnacles
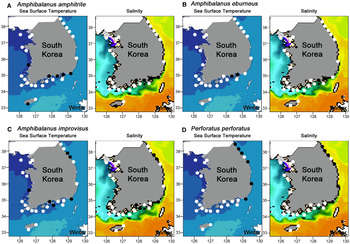
Four barnacle species are invasive in Korean waters: Amphibalanus amphitrite, Amphibalanus eburneus, Amphibalanus improvisus and P. perforatus (Kim, Reference Kim1998; Choi et al., Reference Choi, Choi, Kim and Hong2013; Park et al., Reference Park, Kim, Hong and Choi2017). Amphibalanus amphitrite, a successful marine invader worldwide, was found at six sites located in the Yellow Sea and East China Sea ecoregions. Amphibalanus eburneus was introduced to the Pacific from the North-west Atlantic Ocean and was found attached to buoys or on the bottoms of ships in two sites (Tongyeong and Geoje) in the East China Sea ecoregion (Figure 7A, B). Amphibalanus improvisus, was found at five sites on a seawall inside a port and on molluscan shells. Two sites are located at Namhae (Yellow Sea ecoregion), one at Busan (East China Sea ecoregion) and two sites at Yangyang (East Sea ecoregion). Perforatus perforatus was mainly found at six sites, Busan and Pohang (East China Sea ecoregion) and four sites at important international shipping ports (East Sea ecoregion) (Figures 7C, D & 8).
Distribution of invasive barnacle species (A) Amphibalanus amphitrite, (B) Amphibalanus eburneus, (C) Amphibalanus improvisus, (D) Perforatus perforatus on oceanographic maps of sea surface temperature and salinity in summer and winter. Black circle: present, white circle: absent.

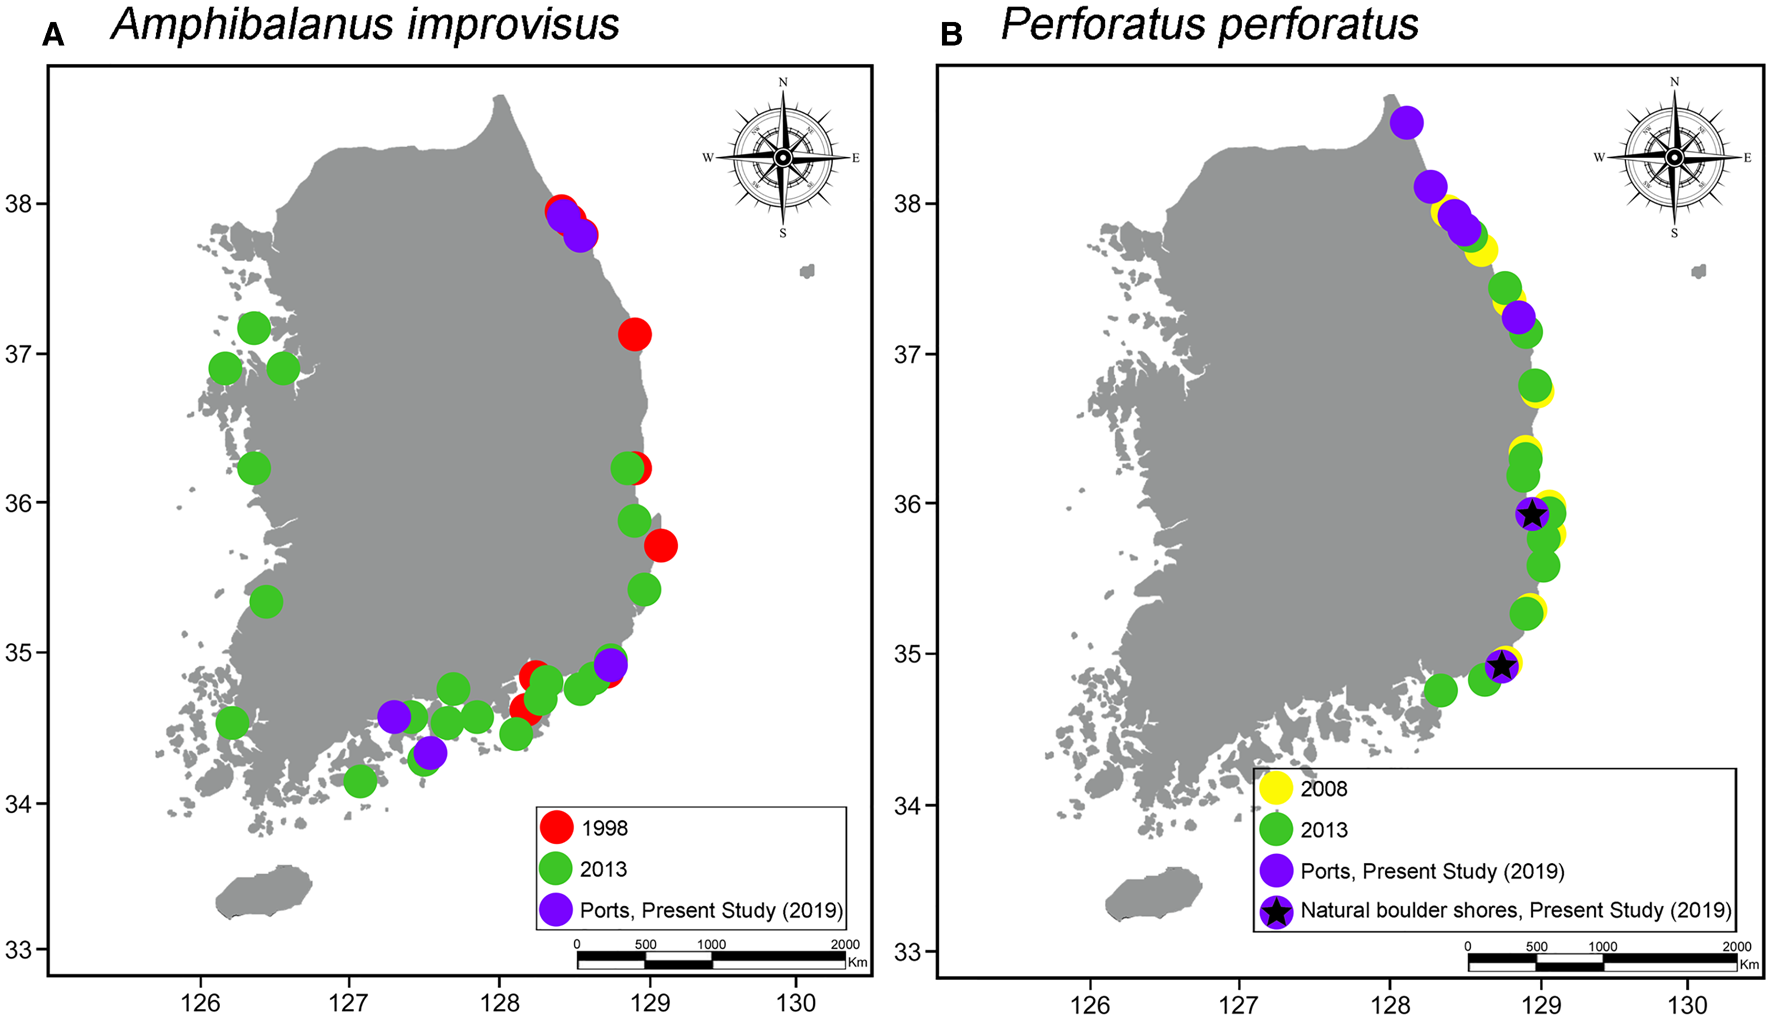
Comparing the previous records (1998, 2008, 2013) of invasive barnacle species distribution with the data obtained in the present study. (A) Amphibalanus improvisus, (B) Perforatus perforatus. 1998 data were retrieved from Kim (Reference Kim1998), 2008 and 2013 information was obtained from Choi et al. (Reference Choi, Choi, Kim and Hong2013) and Park et al. (Reference Park, Kim, Hong and Choi2017) respectively. Refer to Figure 2 for the increasing trend of seawater temperature in these three ecoregions for the last 20 years.

Discussion
Species assemblages of intertidal and shallow water barnacles in Korean waters vary among the three marine ecoregions. Such variation in assemblages is also reported in intertidal hermit crabs and their parasitic rhizocephalan barnacles (Jung et al., Reference Jung, Jung and Kim2018, Reference Jung, Yoshida and Kim2019). From multivariate nMDS plots, there is a large degree of overlap of the clusters from the Yellow Sea and East China Sea ecoregions, suggesting there are large groups of species shared between these two ecoregions. ANOSIM analysis suggest the variations in the species clusters among the three ecozones is significant. From pairwise ANOSIM analysis, R value of the pairwise comparison between Yellow Sea and East China Sea ecoregions is 0.25, indicating there is a large degree of overlap of the clusters. Cluster analysis show the barnacle species of these two systems fall in the same group, based on 80% differences in the criteria. However, the P-value of this pairwise ANOSIM comparison reached 0.018, suggesting there are still some species that are diagnostic between these two ecoregions. A common barnacle in the Yellow Sea ecoregion is Fistulobalanus albicostatus, which was abundant in estuary sites on the west coast of Korea. Fistulobalanus is often found in estuarine-intertidal habitats and mangroves in Japan, Okinawa and Taiwan (Chang et al., Reference Chang, Chan, Hayashi, Shuto, Tsang, Chu and Chan2017). This genus appears to prefer low salinity regions. The East China Sea ecoregion is characterized by higher seawater temperatures and salinity than the other two ecoregions. Balanus trigonus is a common species in the East China Sea ecoregions, probably because of the high salinity and warmer water in this ecoregion. Sponges and coral reefs are present in this ecoregion, especially around Jeju Island, located off the southern coast of Korea. Jeju Island is the northern-most limit of scleractinian corals (only eight species of zooxanthellae-containing scleractinian corals have been recorded; Sugihara et al., Reference Sugihara, Yamano, Choi and Hyeong2014). The common sponge-inhabiting barnacle, Euacasta dofleini, is common in the East China Sea ecoregion, but it is absent from the Yellow Sea ecoregion and East Sea ecoregion. The presence of this species is likely related to the Cheju Warm Currents (CWC). Three species of coral-inhabiting barnacles (Cantellius arcuatus, Cantellius sp. and Pyrgomina oulastreae) were identified exclusively from five scleractinian corals at Jeju Island within the East China Sea ecoregion (also see Chan et al., Reference Chan, Xu, Kim, Park and Kim2018). These barnacle species did not contribute to the significant species assemblage between the Yellow Sea and East China Sea ecoregion because they are only recorded in Jeju Island within the East China Sea ecoregion. At the same latitude on the Pacific Ocean side of Japan, ~30 coral-inhabiting barnacles and 100 hard coral species have been reported (Chan et al., Reference Chan, Xu, Kim, Park and Kim2018). The warm Kuroshio in the East China Sea ecoregion is relatively weak, resulting in reduced diversity of scleractinian coral species. The barnacle P. oulastreae was recorded further north (waters close to the south coast of the Korean peninsula) where zooxanthellae-bearing scleractinian corals become very rare. In this region, P. oulastraea were found on the cold-water, non-zooxanthellae-containing coral Dendrophyllia cribrosa. Pyrgomina oulastreae is a cold-water tolerant coral barnacle species that can define the extreme fringe of coral distribution.
The acorn barnacle Tetraclita japonica and the stalked barnacle Capitulum mitella are tropical to subtropical species and occur mid-shore in the Yellow Sea and East China Sea ecoregions. The presence of these two species decreased along the east coast in the East Sea ecoregion. The natural northern limit of both species is around Pohang (in the East Sea ecozone) at about 36°06′N. In this region, T. japonica and C. mitella became sparse and occurred occasionally with Chthamalus challengeri, which is still the predominant intertidal species in this region. The absence of T. japonica and C. mitella in the northern part of the East Sea ecoregion is probably due to poor survival in low water temperatures in winter. Chthamalus challengeri is a cold-water species that also tolerates a wide range of salinity. This barnacle is common in all intertidal ecoregions along the Korean Peninsula and is the major occupier of space in mid to high intertidal zones. Due to its long larval dispersal period and greater tolerance to low salinity, C. challengeri has a wide geographic distribution in almost all coastlines of Japan and Korea, and is now considered as an invasive species in Zhoushan waters, close to the southern region of Shanghai (Cheang et al., Reference Cheang, Tsang, Ng, William, Chu and Chan2012; Liu et al., Reference Liu, Xue, Lin and Wu2015). Additionally, a common species in the Yellow Sea ecoregion, F. albicostatus, is absent from the East Sea ecoregion, probably because high salinity, low winter temperatures and stronger wave action do not provide a suitable habitat. In contrast, Hesperibalanus hesperius hesperius and Balanus rostratus are cold-water barnacles, being present in the East Sea ecoregion but absent from the other two ecoregions. Distribution of these species is influenced by low sea surface temperature resulted from the Liman Cold Current (LCC) from the north.
One recent invasive barnacle species, Perforatus perforatus, has rapidly expanded its northern range along the east coast of Korea when compared with distribution records from 2008 (Choi et al., Reference Choi, Choi, Kim and Hong2013) and 2013 (Park et al., Reference Park, Kim, Hong and Choi2017). Perforatus perforatus was first identified as an invasive species on the SE coast of Korea in 2008 (Choi et al., Reference Choi, Choi, Kim and Hong2013). The distribution of the species was similar in 2008 and 2013; northern limits did not exceed 38°N and the southern limit was not below 35°N in 2008 and 2013. In the present study, the northern limit of P. perforatus has reached 38°30′N and the southern limit did not change from 2008 and 2013 (Figure 7D). Choi et al. (Reference Choi, Choi, Kim and Hong2013) conducted modelling on the distribution of P. perforatus and predicted that this species would expand its range southward, but not northward along the east coast. Since 2008, P. perforatus has certainly migrated northward along the east coast (Figure 8B). One reason may be increases in seawater temperature in the last 10 years in the East China Sea and East Sea ecoregions (Figure 2). The east coast of Korea is experiencing a northward flow of the Tsushima Warm Current throughout the year, and this current may be responsible for northward dispersal of P. perforatus larvae.
The cold-water invasive species, A. improvisus, originating from western shores of Atlantic coasts, is common in estuaries and has a significant tolerance for low salinity environments (Wrange et al., Reference Wrange, Charrier, Thonig, Rosenblad, Blomberg, Havenhand, Jonsson and André2016). In the present study, small numbers of A. improvisus were found in both Yellow and East Sea ecoregions (Figure 7C). The distribution of A. improvisus shrinks within the range previously reported by Kim (Reference Kim1998) and Park et al. (Reference Park, Kim, Hong and Choi2017) (Figure 8A). The warm-water invasive species, A. eburneus, which tolerates low salinity (Southward, Reference Southward1962; Henry & McLaughlin, Reference Henry and McLaughlin1975), was present in the East China Sea ecoregion and absent in the East Sea ecoregion in the present study (Figure 7B). The present distribution of A. eburneus is similar to the range reported in Kim (Reference Kim1998). Park et al. (Reference Park, Kim, Hong and Choi2017), however, reported the presence of A. eburneus along all Korean coastlines because all collection sites were in shipping ports. Amphibalanus eburneus commonly occurs inside ports but is not present on natural shores in most Korean waters. Similarly, A. amphitrite, a dominant fouling organism, is well established especially in ports all around Korean waters as reported previously by Park et al. (Reference Park, Kim, Hong and Choi2017). However, in the present study, this species was not found in natural intertidal habitats of southern and western coasts and its distribution along the southern coast may be limited to ports (Figure 7A).
Increases in ocean warming have already affected species' geographic distribution in Britain (Mieszkowska & Sugden, Reference Mieszkowska and Sugden2016). Southern species in the UK, including the trochoid gastropods Osilinus and Gibbula, expanded their range (Mieszkowska et al., Reference Mieszkowska, Hawkins, Burrows and Kendall2007). In Korean waters, seawater temperatures have increased in the last 50 years (Han & Lee, Reference Han and Lee2020; Figure 2). The highest and lowest recorded temperatures in all three ecoregions increased gradually with time (Figure 2). The cold-water species, Semibalanus cariosus and Chthamalus dalli, which were recorded in the NE coast of Korea (East Sea ecoregion) by Kim (Reference Kim1998), were absent in the present collection. Kim (Reference Kim1998) described C. dalli as rare and S. cariosus as common on bivalve shells. The absence of cold-water adapted species, C. dalli and S. cariosus, in the present study likely results from increases in water temperatures over the last 10–20 years. Some impacts of natural climatic oscillation, like the impacts of the Atlantic Multidecadal Oscillation on the distribution of Semibalanus and Chthamalus species in the UK, might also have occurred (Mieszkowska et al., Reference Mieszkowska, Burrows, Pannacciulli and Hawkins2014). As water temperature increases, changes in species distribution in the East Sea ecoregion are expected to become more obvious than changes in the East China Sea and Yellow Sea ecoregions because the East Sea ecoregion supports exclusively cold-water species. The northern limits of T. japonica and C. mitella on the east coastline may shift further north and the abundance of P. perforatus may increase to the point that the species becomes a dominant space occupier along intertidal shores of the East Sea ecoregion in Korea. To further address such changes in the biogeography of intertidal species, sustained long-term monitoring of data, in a manner like the MarCLIM project, should be developed in the Pacific region. The protocol of the MarCLIM project can guide data collection to monitor intertidal species in the Pacific and subsequently the data can be comparable to the Atlantic counterparts.
Acknowledgements
We would like to thank Dr Bum Sik Min (Marine Research Centre, National Park Research Institute) for assisting with field collection. BKKC acknowledges the Senior Investigator Award, Academia Sinica for funding part of the study. Thanks to Scotty for revising the English of the first version of the MS. The authors would like to thank the reviewers for giving constructive comments on the MS.
Financial support
This study was supported by a grant from the Marine Biotechnology Program (grant number 20170431), funded by the Ministry of Oceans and Fisheries of the Korean Government.