Implications
The main implication of this study is the validation of a methodology for hair cortisol detection by enzyme immunoassay in dairy cattle. Hair cortisol detection is a promising methodology able to give information on long-term retrospective cortisol levels, which cannot be provided by any other established matrix. This study opens the possibility to use this methodology in chronic stress studies in dairy cattle welfare research, which is nowadays a hot topic.
Introduction
The importance of welfare in dairy cattle production is increasing not only as a consequence of society demands, but also due to the relationship between animal welfare and performance (von Keyserlingk et al., Reference Von Keyserlingk, Rushen, de Passillé and Weary2009). Different methodologies have been developed to objectively assess cattle welfare, including quantification of cortisol response to stressors (Morrow et al., Reference Morrow, Kolver, Verkerk and Matthews2002; Rigalma et al., Reference Rigalma, Duvaux-Ponter, Barrier, Charles, Ponter, Deschamps and Roussel2010; Probst et al., Reference Probst, Spengler Neff, Hillmann, Kreuzer, Koch-Mathis and Leiber2014).
Depending on the matrix where cortisol is analysed, the information provided by its concentration is different (Russell et al., Reference Russell, Koren, Rieder and Van Uum2012). Cortisol concentration in serum and saliva can be used to detect acute changes in circulating cortisol concentrations although they do not represent long-term circulating cortisol levels (Thun et al., Reference Thun, Eggenberger, Zerobin, Luscher and Vetter1981; Negrão et al., Reference Negrão, Porcionato, de Passillé and Rushen2004; Hernandez et al., Reference Hernandez, Thierfelder, Svennersten-Sjaunja, Berg, Orihuela and Lidfors2014). Cortisol in urine should be collected over 24 h to provide an integral daily cortisol value and this may be rather complicated in farm animals (Aardal and Holm, Reference Aardal and Holm1995; Russell et al., Reference Russell, Koren, Rieder and Van Uum2012). Cortisol in faeces is measured indirectly by detecting its metabolites (Möstl et al., Reference Möstl, Messmann, Bagu, Robia and Palme1999; Touma and Palme, Reference Touma and Palme2005) and despite it has been extensively used and validated (Möstl et al., Reference Möstl, Messmann, Bagu, Robia and Palme1999 and 2002; Palme et al., Reference Palme, Robia, Messmann, Hofer and Möstl1999) this matrix still have some limitations. Cortisol metabolites concentrations could be modified by changes in diet, intestinal transit and/or bacterial activity (Möstl et al., Reference Möstl, Maggs, Schro, Schrötter, Besenfelder and Palme2002; Möstl and Palme, Reference Möstl and Palme2002) and have storage requirements (Morrow et al., Reference Morrow, Kolver, Verkerk and Matthews2002; Palme et al., Reference Palme, Touma, Arias, Dominchin and Lepschy2013). However, faecal collection is less invasive and stressful than saliva, blood or urine and cortisol metabolites detection has been demonstrated as a valid tool to assess 12 to 24 h retrospective cortisol levels in cows (Möstl et al., Reference Möstl, Messmann, Bagu, Robia and Palme1999; Touma and Palme, Reference Touma and Palme2005).
Detection of cortisol concentrations in hair seems to provide an integrated value of retrospective circulating cortisol levels during the hair growth (Meyer and Novak, Reference Meyer and Novak2012). This is due to the hair growth physiology, hair vascularisation and hormone accumulation mechanisms that are associated (Koren et al., Reference Koren, Mokady, Karaskov, Klein, Koren and Geffen2002; Gow et al., Reference Gow, Thomson, Rieder, Van Uum and Koren2010; Stalder and Kirschbaum, Reference Stalder and Kirschbaum2012). No other matrix seems to have the same potential to evaluate long-term hypothalamic–pituitary–adrenal (HPA) axis activity and thereby, long-term or chronic stress (Van Uum et al., Reference Van Uum, Sauvé, Fraser, Morley-Forster, Paul and Koren2008; Macbeth et al., Reference Macbeth, Cattet, Obbard, Middel and Janz2012; Russell et al., Reference Russell, Koren, Rieder and Van Uum2012). In spite of the clear advantages and potential applications of hair cortisol detection, several gaps need to be clarified, especially regarding the origin of the cortisol and the factors that modulate its accumulation. Some accumulation mechanisms are still incompletely understood (Henderson Reference Henderson1993; Cone Reference Cone1996; Boumba et al., Reference Boumba, Ziavrou and Vougiouklakis2006) and the presence of local steroidogenesis in skin has been demonstrated (Taves et al., Reference Taves, Gomez-Sanchez and Soma2011; Slominski et al., Reference Slominski, Zbytek, Nikolakis, Manna, Skobowiat, Zmijewski, Li, Janjetovic, Postlethwaite, Zouboulis and Tuckey2013 and Reference Slominski, Manna and Tuckey2014). As a consequence, some studies discuss the main source of cortisol accumulated in hair by highlighting the importance of local cortisol production in the final hair cortisol concentration and its different regulation from adrenal-origin cortisol (Ito et al. Reference Ito, Ito, Kromminga, Bettermann, Takigawa, Kees, Straub and Paus2005; Keckeis et al., Reference Keckeis, Lepschy, Schöpper, Moser, Troxler and Palme2012; Sharpley et al., Reference Sharpley, McFarlane and Slominski2012). However, several studies have associated elevations of hair cortisol concentrations with stressful situations (Comin et al., Reference Comin, Tidu, Cornacchia, Cappa, Renaville and Prandi2008 and Reference Comin, Peric, Corazzin, Veronesi, Meloni, Zufferli, Cornacchia and Prandi2013; Dettmer et al., Reference Dettmer, Novak, Suomi and Meyer2012), providing that hair cortisol concentrations (regardless of cortisol origin and regulation) can be sensitive to the presence of certain stressors.
Although enzyme immunoassay (EIA) and ELISA methodologies have been used to detect hair cortisol in cows and beef (Cerri et al., Reference Cerri, Tabmasbi and Veira2012; Moya et al., Reference Moya, Schwartzkopf-Genswein and Veira2013; Burnett et al., Reference Burnett, Madureira, Silper, Nadalin, Tahmasbi, Veira and Cerri2014), a complete validation of the methodology has only been done in beef cattle (Moya et al., Reference Moya, Schwartzkopf-Genswein and Veira2013). Other studies have detected cortisol in hair from dairy cows using radioimmunoassay with validation tests (Comin et al., Reference Comin, Prandi, Peric, Corazzin, Dovier and Bovolenta2011 and Reference Comin, Veronesi, Montillo, Faustini, Valentini, Cairoli and Prandi2012; González-de-la-Vara et al., Reference González-de-la-Vara, Valdez, Lemus-Ramirez, Vázquez-Chagoyán, Villa-Godoy and Romano2011). Nevertheless, validation tests cannot be generalised or extrapolated from one technique to another or after using different extraction protocols (Buchanan and Goldsmith, Reference Buchanan and Goldsmith2004; Gatti et al., Reference Gatti, Antonelli, Prearo, Spinella, Cappellin and De Palo2009; Stalder and Kirschbaum, Reference Stalder and Kirschbaum2012).
The aims of this study were to validate a protocol and the use of an EIA test to measure cortisol concentrations in hair from Holstein–Friesian cows and to evaluate if a single hair cortisol value can represent retrospective cortisol concentrations during a specific period of time in milking cows. This evaluation was done by correlating hair cortisol levels with average values of faecal cortisol metabolites measured repeatedly during the same period of time.
Material and methods
Animals, housing conditions, diet and handling
Seventeen adult Holstein–Friesian dairy cows (mean age 4.0 years old; range 2.1 to 7.2 years old) were used during the milking period (mean days in milk 146.5; range 13 to 338 days). All animals were under the same conditions on a covered farm with cubicles (one lying stall/cow) located in Caldes de Malavella (Girona, Spain, 41° 49' 34.4'', 2° 46' 19.19''). Milking was done robotically twice a day. All animals received the same diet (as-fed basis: 20 kg of corn silage; 4 kg of dry alfalfa; 0.5 kg of straw; 10 kg of unifeed composed mainly of corn and soya bean; and 3 kg of concentrate equilibrated per cow and day in milk in the robot). Diet and concentrated formulation were established according to the National Research Council (NRC) (2001) recommendations. Animals were handled and sampled benefitting the restraining time to eat implemented in the cows’ routine between 0830 and 1030 h in the morning.
Faecal sampling and steroid extraction
Faeces were individually collected twice a week for 4 weeks (days 0, 4, 7, 11, 14, 17, 21, 23). The number of faecal samples required to provide comparable repeatability to that of a single hair sample was based on study of Bryan et al. (Reference Bryan, Adams, Invik, Wynne-Edwards and Smits2013) performed in dogs. Faeces were collected by direct extraction from the rectum and stored in a zip-lock plastic bag at −20°C until steroid extraction.
For steroid extraction, DetectX™ Steroid Solid Extraction Protocol (Arbor Assays®, MI, USA) was followed with modifications based on de Lima et al. (Reference De Lima, Piles, Rafel, López-Béjar, Ramón, Velarde and Dalmau2013) and Sabés-Alsina et al. (Reference Sabés-Alsina, Planell, Torres-Mejia, Taberner, Maya-Soriano, Tusell, Ramon, Dalmau, Piles and Lopez-Bejar2015) studies. Faecal samples were put into an oven (Heraeus model T6; Kendro® Laboratory Products, Langenselbold, Germany) at 60°C for ~48 h in order to evaporate the water. Once dried, faecal samples were manually ground by using a mortar and 300 mg faecal powder were weighted and put into a 15-ml conical tube (Deltalab, S.L., Rubí, Spain). After that, 2.5 ml distilled water and 3 ml methanol (methanol reagent grade 99.9%, Sharlab, S.L., Sentmenat, Spain) were added to each sample and vortexed (Vortex Mixer S0200-230 V-EU; Labnet International Inc., NJ, USA) for 30 min. Then, the samples were centrifuged (Hermle Z300K; Hermle® Labortechnik, Wehingen, Germany) at 1750×g for 15 min and 1 ml of the supernatant was transferred into a 1.5-ml eppendorf tube (Sharlab) and immediately stored at −20°C until analysis.
Hair sampling and hormone extraction
Hair samples were collected on the first day (d0) and last day (d25) of the study. The hair collected at d25 was only the new hair regrowing after d0 collection. White and black hair samples were collected from each animal and analysed separately. White hair samples were collected from the frontal region of the head (forehead). Black hair samples were collected from the frontal region of the head and also from the occipital crest area in order to obtain enough amount of sample. All samples were collected using the same electric hair clipper (X3 ceramic-titanium hair clipper; Palson® Trading España S.L., Collbató, Spain) and trying to acquire the longest possible hair sample while at the same time avoiding to injure the skin or to take out the hair follicles. The clipper blade was disinfected with alcohol 70% after each animal recollection. Each hair sample weighed around 5 g and was stored into zip-lock plastic bag at room temperature and darkness until washing and cortisol extraction.
For the hair cortisol extraction, a modified protocol from that described by Davenport et al. (Reference Davenport, Tiefenbacher, Lutz, Novak and Meyer2006) and developed by our lab for other species was followed (Tallo-Parra et al., Reference Tallo-Parra, Carbajal, Sabes-Alsina, Almagro, Fernandez-Bellon, Enseñat, Quevedo, Manteca, Abaigar and Lopez-Bejar2013). From each sample 250 mg of hair were weighed and placed into a 15-ml conical tube. Each sample was washed by adding 2.5 ml of isopropanol (2-propanol 99.5%, Sharlab) and vortexed at 1800 r.p.m. for 2.5 min in order to remove external steroid sources but avoiding the loss of internal steroids as suggested by Davenport (Reference Davenport, Tiefenbacher, Lutz, Novak and Meyer2006). The supernatant was separated by decantation and the process was repeated twice (three washes in total). The hair samples were left to dry completely for ~36 h at room temperature. Then, the hair was minced into <2 mm length fragments by using a peeler and 50 mg of trimmed hair were carefully weighted and placed into a 2-ml eppendorf tube. For each sample, 1.5 ml pure methanol was added and the samples were shaken at 100 r.p.m. for 18 h at 30°C (G24 Environmental Incubator Shaker; New Brunswick Scientific Co. Inc., Edison, NJ, USA) to steroid extraction. Following extraction, samples were centrifuged at 7000×g for 2 min. Subsequently, 0.750 ml of supernatant were transferred into a new 2-ml eppendorf tube and then placed in an oven at 38°C. Once the methanol was completely evaporated (approximately after 24 h), the dried extracts were reconstituted with 0.2 ml EIA buffer provided by the EIA assay kit (Cortisol ELISA KIT; Neogen® Corporation, Ayr, UK) and shaken for 30 s. Then the samples were immediately stored at −20°C until analysis.
Steroid analysis and validation tests
The cortisol concentrations from hair extracts, the metabolites concentrations from faecal extracts and all the validation tests were determined per duplicate by using cortisol EIA detection kits (Neogen® Corporation Europe, Ayr, UK), with a sensitivity of 0.32 pg cortisol/mg of hair and 7.3/104 ng cortisol/mg of dry faeces.
All the validation tests used different pool of samples constituted by five hair extracts each one with high, low and medium final concentrations. Each final solution was analysed by duplicate. The precision within test was assessed by calculating intra-assay coefficients of variation from all duplicated samples analysed. The inter-assay coefficients of variation was calculated from 10 pool samples with markedly different concentrations and analysed per duplicate in each EIA kit. The linearity of dilution was determined by using 1 : 1, 1 : 2, 1 : 5 and 1 : 10 dilutions of pools with EIA buffer. Accuracy was assessed through the spike-and-recovery test, calculated by adding to 50, 100 and 200 μl of pool, volumes of 200, 100 and 50 μl of pure standard cortisol solution, respectively. Combinations were repeated with three different pure standard cortisol solutions (20, 2 and 0.2 ng/ml). Although cross-reactivity was provided by the EIA manufacturer, specificity was also evaluated comparing slopes from the straight lines resulting from the application of common logarithm (log10) to the values from the standard curve (mstandard) and from new pool curve (mpool) created with the same serial dilutions (1 : 1, 1 : 5, 1 : 10, 1 : 25, 1 : 50 and 1 : 100). According to the manufacturer, cross-reactivity of the EIA antibody with other steroids is as follows: prednisolone 47.4%, cortisone 15.7%, 11-deoxycortisol 15.0%, prednisone 7.83%, corticosterone 4.81%, 6β-hydroxycortisol 1.37%, 17-hydroxyprogesterone 1.36%, deoxycorticosterone 0.94%. Steroids with a cross-reactivity <0.06% are not presented.
Statistical analysis
All data were processed and analysed using the SAS software (Statistical Analysis System, version V.8; SAS Institute, Cary, NC, USA) and a P-value <0.05 was considered significant. The values are presented as means±standard deviation. A Shapiro–Wilk test was carried out to check normality. Data with non-normality distribution were transformed in log10 and normality was evaluated again. All parameters transformed in log10 were normally distributed and used in statistical analysis. A parametric test (two tails paired data t-test, PROC TTEST with PAIRED option in SAS) was done to compare the cortisol concentrations between white and black hair samples and between d0 and d25 hair samples. A different parametric test (Pearson’s correlation analysis, PROC CORR in SAS) was done to detect correlations within cortisol parameters. A simple linear regression was performed in order to analyse statistically the relations between hair cortisol and faecal metabolites of cortisol concentrations.
Results and discussion
Validation tests
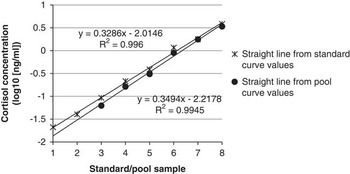
Intra- and inter-assay coefficients of variation were 4.9±2.39% and 10.6±1.77%, respectively. The linearity of dilution showed a R 2=0.98 and a mean percentage error of −10.8±1.55%, providing confirmation that pool samples interacted with the assay antibody in a dose-dependent manner and supporting the assumption that the antibody-binding characteristics of standard and pool samples are similar. The average recovery percentage from spike-and-recovery test was 89.0±23.52% which indicate that no other components of the hair extracts interfere acutely with the estimation of cortisol hormone. The lines from the log10 of the standard curve values and the log10 of the pool curve values showed similar slopes (mstandard=0.33, mpool=0.35; Figure 1) detecting immunological similarities between the standard and sample hormones.
Parallelism between lines from the log10 of the standard and sample pool curves.

These results indicate that hair cortisol detection in dairy cows through this methodology is successful even using an EIA kit no designed specifically for hair cortisol detection. According to Stalder and Kirschbaum (Reference Stalder and Kirschbaum2012) or Meyer and Novak (Reference Meyer and Novak2012), the major source of cortisol presented in hair should be free or unbound cortisol, which is the cortisol detected by the EIA kit used. However, further research is necessary to describe the type of cortisol present in hair and the role of hair follicle and local production in the final hair concentration.
Hair cortisol concentrations
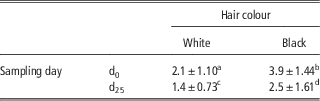
As is shown in Table 1, the average cortisol concentrations in white and black hair differed significantly at d0 and at d25 (P<0.01). The colour in hair is produced by melanocytes located in the basal layer of the hair (Pragst and Balikova, Reference Pragst and Balikova2006). The presence of higher cortisol concentrations in black samples in relation with the white ones is in concordance with studies that suggest that number of melanocytes and pigmentation favour the incorporation of lipophilic substances from the bloodstream into the hair (Pötsch et al., Reference Pötsch, Skopp and Moeller1997; Pragst and Balikova, Reference Pragst and Balikova2006). However, other studies found higher cortisol concentrations in white hair than in the black ones (González-de-la-Vara et al. Reference González-de-la-Vara, Valdez, Lemus-Ramirez, Vázquez-Chagoyán, Villa-Godoy and Romano2011; Cerri et al., Reference Cerri, Tabmasbi and Veira2012; Burnett et al., Reference Burnett, Madureira, Silper, Nadalin, Tahmasbi, Veira and Cerri2014). Our contradictory results may be because while the white hair samples were harvested only from the frontal region of the head, the black hair ones were a mixture of hair from frontal region of head and also from the occipital crest. Thus, black hair samples were homogeneous in colour but not in location and so, hair type. The authors did not find any study comparing cortisol concentrations from these two close regions but other studies found differences in hair cortisol levels among other locations (Cerri et al., Reference Cerri, Tabmasbi and Veira2012; Moya et al., Reference Moya, Schwartzkopf-Genswein and Veira2013; Burnett et al., Reference Burnett, Madureira, Silper, Nadalin, Tahmasbi, Veira and Cerri2014). Hair from the occipital crest in Holstein–Friesian cows is longer and thicker than hair from frontal region and studies performed by Burnett et al. (Reference Burnett, Madureira, Silper, Nadalin, Tahmasbi, Veira and Cerri2014) and Moya et al. (Reference Moya, Schwartzkopf-Genswein and Veira2013) found higher cortisol concentrations in locations where hair type was also longer and thicker (especially the tail switch). The growth rate and hormone accumulation or production rate could be different between types of hair (Moya et al., Reference Moya, Schwartzkopf-Genswein and Veira2013; Burnett et al., Reference Burnett, Madureira, Silper, Nadalin, Tahmasbi, Veira and Cerri2014) and these differences could be the cause of the presence of higher cortisol levels in the heterogeneous black hair samples.
Cortisol concentrations (pg cortisol/mg hair) from hair sampled at the beginning (d0) and at the end (d25) of the study

a,b,c,dMeans with different superscripts are different (two tails paired data t-test between colour samples and between day of sampling, P<0.01).
Mean values for the same hair colour samples at d0 and d25 showed also significant differences (Table 1, P<0.01). The authors suggest that these results could be explained by the different lifetime between d0 samples (unknown lifetime, probably months-old samples) and d25 samples (25-day-old). Hair from d0 could have accumulated, in terms of cortisol variations, unknown stressful or physiologically compromising experiences (such as parturition, disease or hierarchy re-establishment). Comin et al. (Reference Comin, Prandi, Peric, Corazzin, Dovier and Bovolenta2011) cautiously suggested hair cortisol variations due to seasonal differences in hair growth rate in dairy cows. This fact could also add differences between d0 and d25 samples. Additionally, the different hair growth phases present in samples from regions not previously harvested has been considered as a cause of hair cortisol variations, especially in short hair types (Moya et al., Reference Moya, Schwartzkopf-Genswein and Veira2013; Peric et al., Reference Peric, Comin, Corazzin, Montillo, Cappa, Campanile and Prandi2013; Carlitz et al., Reference Carlitz, Kirschbaum, Stalder and van Schaik2014).
Hair cortisol and faecal cortisol metabolites
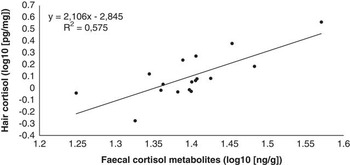
A significant correlation was detected between faecal cortisol metabolites (average value of all faecal samples 25.27±4.16 ng/g dry sample, range 10.14 to 54.83) and cortisol in white colour hair samples from d25 (r=0.75926, P<0.001). A simple lineal regression was done between white hair samples at d25 and average of all faecal samples (Figure 2) in order to better understand the relationship between cortisol and cortisol metabolites found in these matrixes. The good correlation between white colour hair samples from d25 and the average of all faecal samples confirms the possibility to use hair as a matrix to assess retrospective concentrations of cortisol. No correlation was found between faecal cortisol metabolites and black colour hair samples from d25 (P>0.05). The absence of correlation between black hair samples at d25 and average faecal levels could be explained also by the lack in homogeneity of location of these hair samples and so, a lack in hair type homogeneity.
Simple linear regression between log10 transformed values of white hair samples at d25 and the average of all faecal samples (R 2=0.57, P<0.001).

Conclusion
In conclusion, the validation tests confirm that it is possible to detect cortisol concentrations in hair with an acceptable repeatability and reliability by using EIA. The correlations between concentrations in hair and faeces verify, indirectly, the use of hair cortisol as a parameter to represent retrospective circulating cortisol levels and consequently, long-term HPA axis activity. Although hair sampling is simple, non-invasive and fast, collected hair must be homogeneous in colour, sampling region and days old in order to be used in dairy cattle welfare studies.
Acknowledgements
The authors gratefully acknowledge Josep Barnés from Mas Can Gimferrer Nou and Fabio Gillué, Jorge Pérez-Accino, Pere Pons and Òscar Pérez for the support in the hair and faecal sampling.