


Chapter Overview
Water flows from high to low potential as described by Darcy’s law. The Richards equation combines Darcy’s law with principles of water conservation to calculate water movement in soil. Particular variants of the Richards equation are the mixed-form, head-based, and moisture-based equations. Water movement is determined by hydraulic conductivity and matric potential, both of which vary with soil moisture and additionally depend on soil texture. This chapter reviews soil moisture and the Richards equation. Numerical solutions are given for the various forms of the equation.
8.1 Introduction
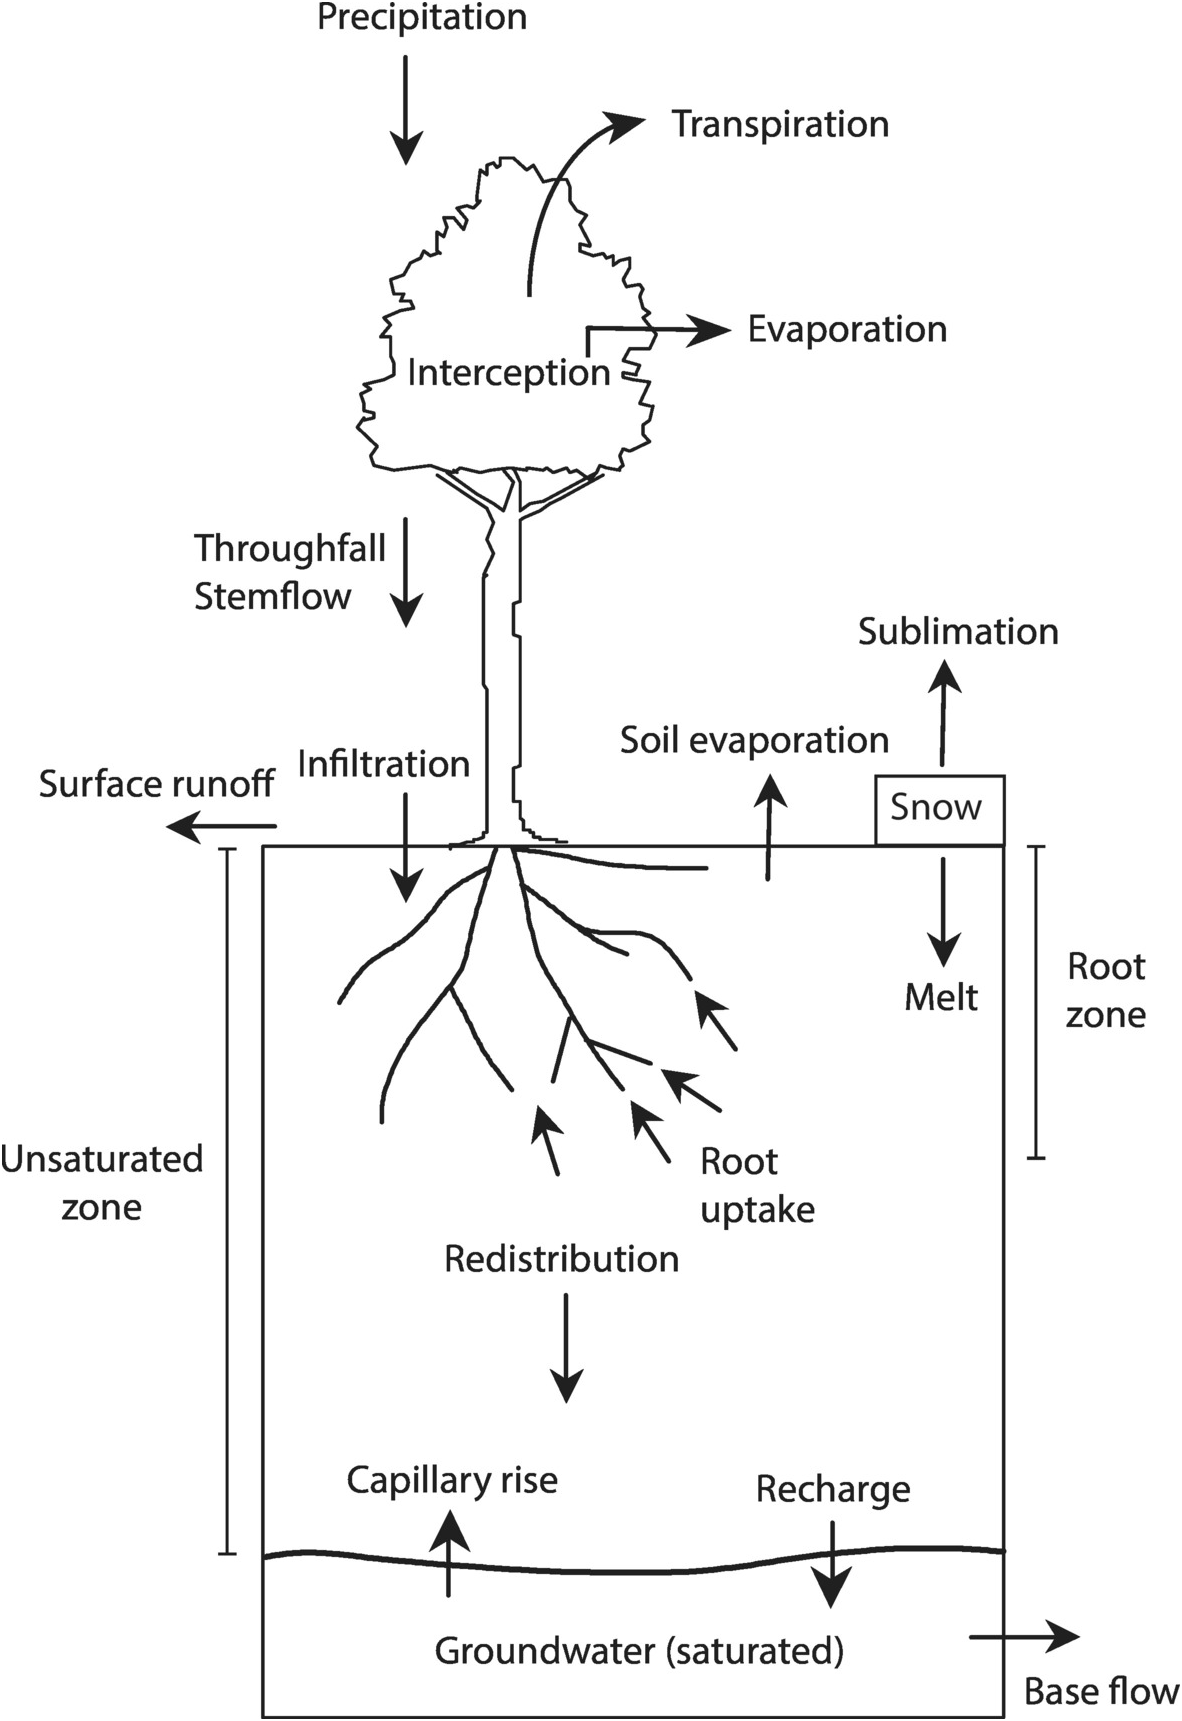
The region of soil between the ground surface and the water table is known as the unsaturated, or vadose, zone, and the water held in this zone is called soil moisture (Figure 8.1). The water content of the vadose zone is dynamic, ranging from saturation in the upper soil layers near the surface during infiltration to nearly dry in prolonged absence of rainfall as plant roots extract water during transpiration. The vertical profile of soil water is a particularly important determinant of land–atmosphere coupling. A dry surface layer develops in the absence of rainfall, and this dry layer impedes soil evaporation. Conversely, plant roots can extend deep in the soil to sustain transpiration during dry periods. Below the vadose zone lies saturated groundwater, and soil moisture also controls the fluxes of water between the vadose zone and groundwater.
Water flows in a soil column extending from the ground surface to the water table.
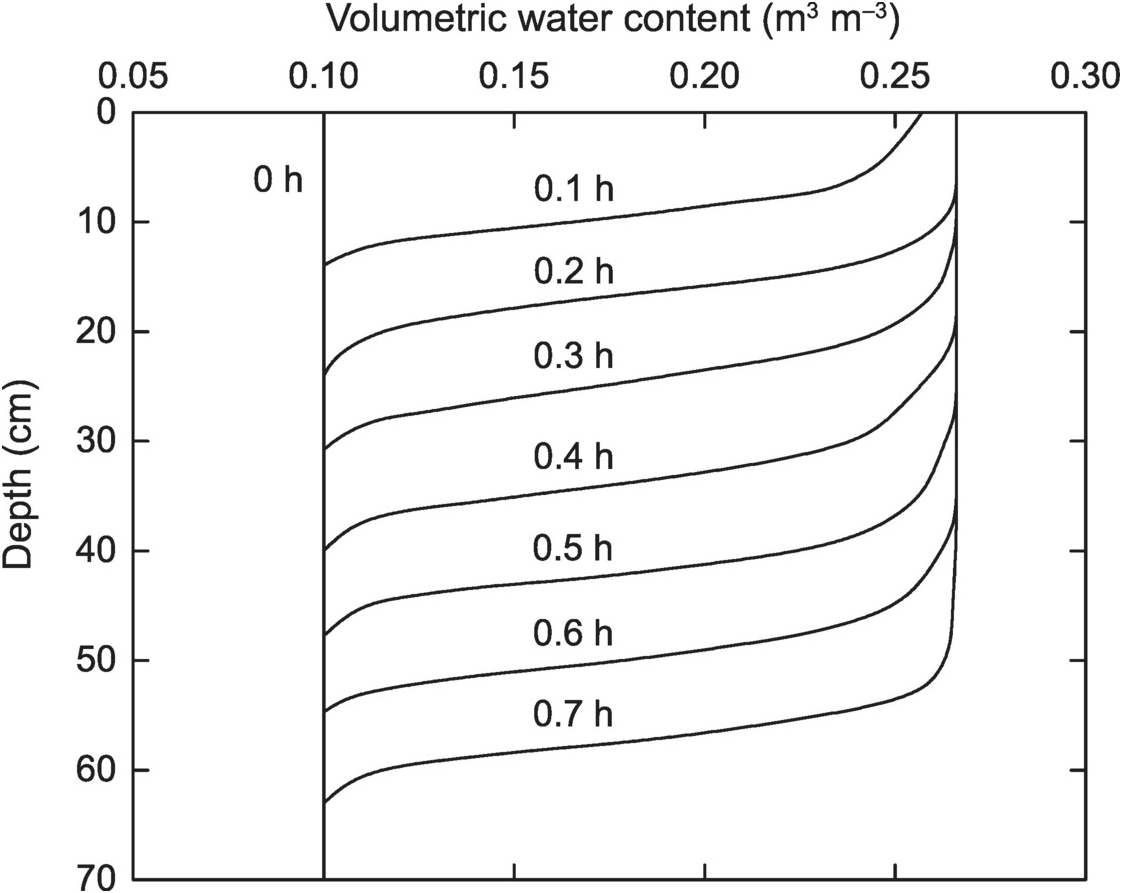
The first models of the land surface used in climate simulations ignored the complexity of the hydrologic cycle and instead abstracted it using the bucket analogy in which soil is treated as a bucket that fills from precipitation, empties from evapotranspiration, or spills over as runoff as described in Chapter 7. In fact, however, storage of water and its movement in soil is much more complex. When soil is wet, water is loosely held in soil and quickly drains due to the force of gravity. When soil is dry, water movement becomes more difficult, and at some critical amount the water is strongly bound to soil particles and can no longer be removed. Figure 8.2 illustrates the dynamics of water movement during infiltration into initially dry soil. A distinct wetting front moves progressively downward over time. The upper soil becomes saturated with water while the deeper soil remains dry. In the sandy soil shown in Figure 8.2, the upper 50–60 cm become saturated after 42 minutes (0.7 h). This dynamics is explained from physical principles using Darcy’s law and the Richards equation.
Soil water movement during infiltration into sand. Shown are the initial moisture profile (θ = 0.1) and profiles in increments of 0.1 h.
8.2 Measures of Soil Moisture
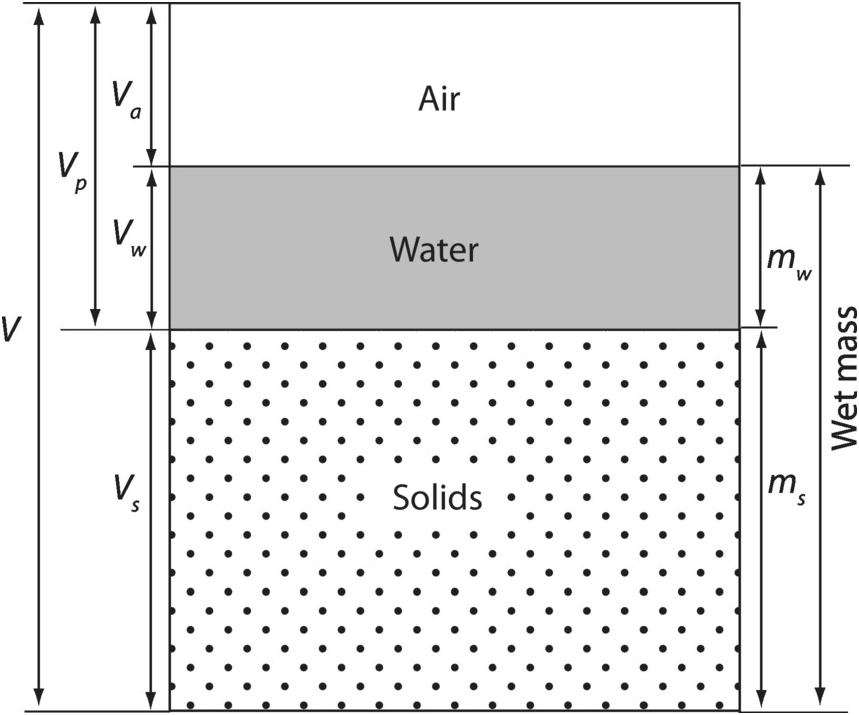
A typical soil consists of solid particles of varying size and shape that are interconnected by pores. Water completely fills these pores when the soil is saturated, or the pores consist mainly of air when the soil is dry. Most conditions in the field are in-between, and soil is a mix of solid particles, water, and air (Figure 8.3). The bulk density of a soil ρb (kg m–3) is the mass of soil solids per volume of soil so that
 (8.1)
The bulk volume of soil consists of the total volume of solids and pore space (V = Vs + Vp). The particle density ρs (kg m–3) is the mass of soil solids per volume of soil solids whereby
 (8.2)
If a volume of soil 10 cm × 10 cm × 10 cm has a dry mass of 1.325 kg, its bulk density is 1325 kg m–3. If the pore space comprises one-half of this volume, Vs = 0.5V, and the particle density is 2650 kg m–3. A typical particle density is, in fact, 2650 kg m–3. The fraction of the soil volume comprising pores, known as porosity, is (V − Vs)/V. When saturated, water fills all the pores so that porosity is also the volumetric water content at saturation θsat. Porosity is calculated from bulk density and particle density by
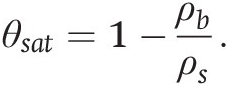 (8.3)
Depiction of soil with total volume V comprising soil solids Vs, water Vw, and air Va. The total volume of pore space is Vp = Vw + Va. The total soil mass consists of soil solids with mass ms and water with mass mw.
The amount of water can be measured by volume (m3 H2O) and equivalently by mass per area (kg H2O m–2) or depth (m H2O). These are related by the density of water (ρwat = 1000kg m–3) so that mass per area = depth × density. One kilogram of water spread over an area of one square meter (1 kg m–2) is equivalent to a depth of 1 mm and a volume of 0.001 m3. A common measure of soil moisture is volumetric water content (m3 H2O m–3 soil). Volumetric water content is
 (8.4)
Volumetric water content is also the depth of water per unit depth of soil. A soil with thickness Δz m contains θ Δz m of water. The mass of water per area W (kg m–2) in a volume of soil with volumetric water content θ is
Another measure of soil moisture is gravimetric (mass) water content (kg H2O kg–1 dry soil). Gravimetric water content is
 (8.6)
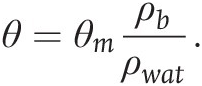
Volumetric water content is related to gravimetric water content by the density of water and the bulk density of soil as
 (8.7)
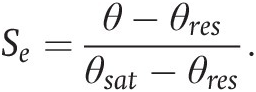
Another measure is the effective saturation, which is defined as the soil moisture θ above some residual amount θres relative that at saturation:
 (8.8)
Table 8.1 provides example calculations for these various measures of soil moisture.
| Quantity | Amount |
|---|---|
| Mass of water | mw = 1.7 kg − 1.45 kg = 0.25kg |
| Mass of soil solids | ms = 1.45kg |
| Bulk volume of soil | V = 0.1 m × 0.1 m × 0.1 m = 0.001m3 |
| Bulk density | ρb = ms/V = 1450 kg m–3 |
| Porosity | θsat = 1 − ρb/ρs = 0.453 |
| Volume of water | Vw = mw/ρwat = 0.00025 m3 |
| Gravimetric water content | θm = mw/ms = 0.172 kg kg–1 |
| Volumetric water content | θ = Vw/V = θmρb/ρwat = 0.25 m3 m–3 |
| Water content relative to saturation | θ/θsat = 0.552 |
| Depth of water | θ Δz = 0.25 × 0.1 m = 0.025 m |
| Mass of water per area |  kg m–2 |
8.3 Matric Potential and Hydraulic Conductivity
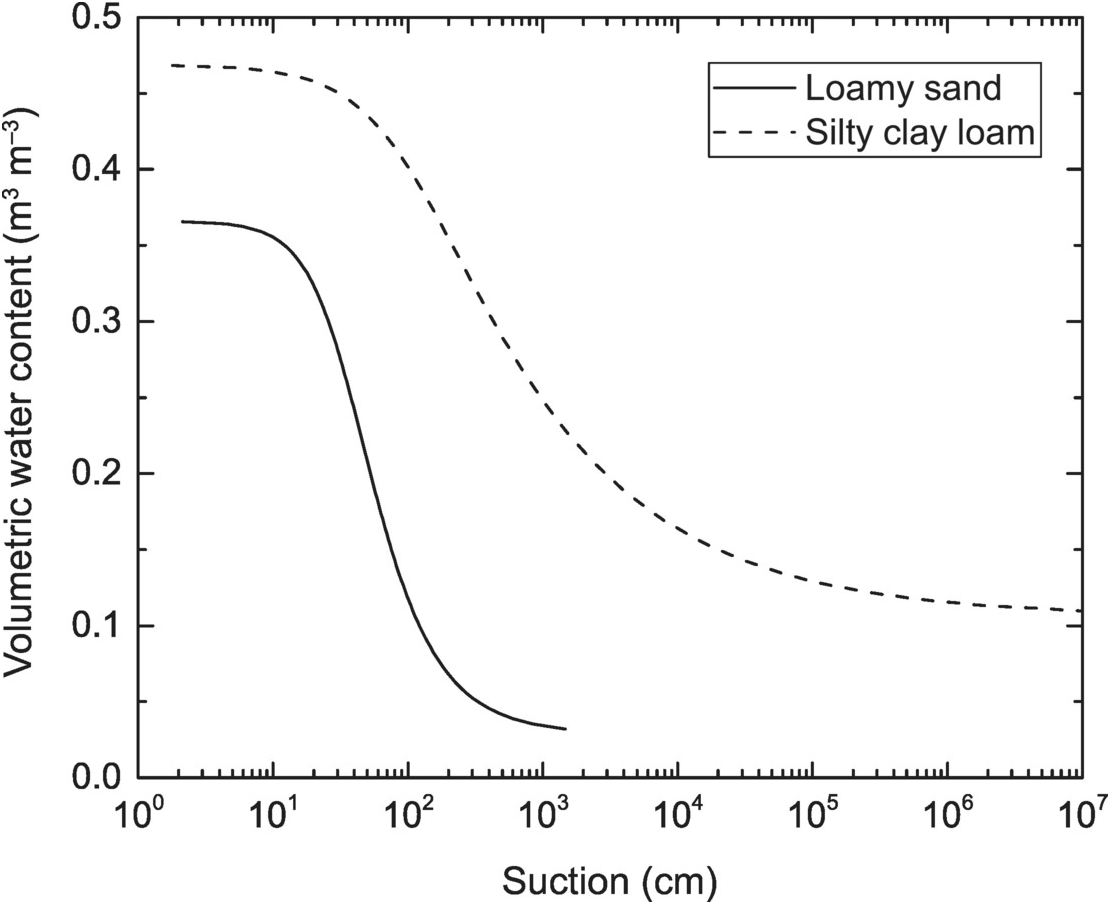
Water is tightly held by the surfaces of soil particles. This creates a negative pressure, or suction, called matric potential ψ that binds water to the soil. (The symbol h is commonly used in soil science and hydrology to denote this as pressure head.) The matric force is positive when represented as suction and negative when given as potential. Matric potential varies with soil moisture. Relatively weak suction is exerted on water when soil is saturated (matric potential is high), but suction increases sharply (matric potential decreases) as soil becomes drier and strong forces bind water in small pores. This relationship between ψ and θ is quite nonlinear and varies depending on soil texture (Figure 8.4). Water is loosely held in sandy soils (low suction) and tightly held in clay soils (high suction).
Water content in relation to matric potential given here as suction (−ψ).
Shown is the van Genuchten (Reference van Genuchten1980) θ(ψ)relationship for Berino loamy fine sand (θres = 0.0286, θsat = 0.3658, α = 0.028 cm–1, n = 2.239) and Glendale silty clay loam (θres = 0.106, θsat = 0.4686, α = 0.0104 cm–1, n = 1.3954) from Hills et al. (Reference Hills, Hudson, Porro and Wierenga1989).
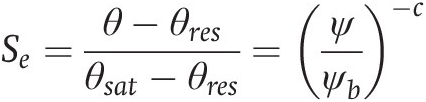
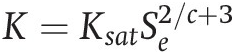
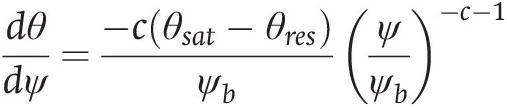
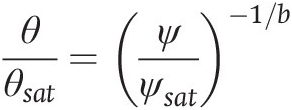
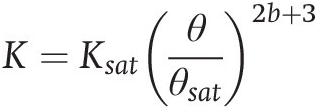
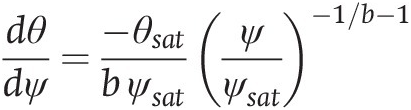
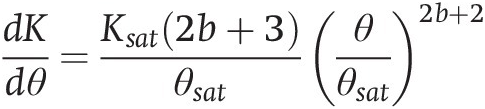
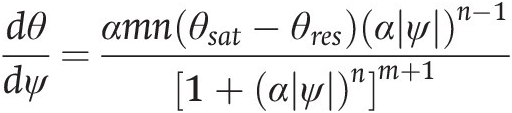
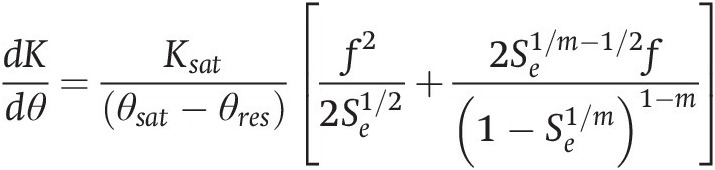
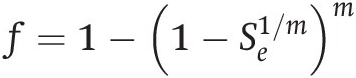
The dependence between ψ and θ is referred to as the soil moisture retention curve and is described mathematically by equations that relate θ to ψ or, equivalently, ψ to θ, denoted θ(ψ) or ψ(θ), respectively. Table 8.2 gives three common relationships. Brooks and Corey (Reference Brooks and Corey1964, Reference Brooks and Corey1966) related ψ to the effective saturation Se. In this equation, ψb and c are empirical parameters used to fit the data; ψb is the air entry water potential and is the value of ψ at which Se = 1; c is referred to as the pore-size distribution index. Campbell (Reference Campbell1974) proposed a similar relationship but with θres = 0, in which case ψb can be thought of as the matric potential at saturation. Van Genuchten (Reference van Genuchten1980) developed another widely used soil moisture retention curve. In this relationship, the empirical parameter α is the inverse of the air entry potential (α = 1/ ∣ ψb∣), and n is the pore-size distribution index.
| θ(ψ) | K(θ) |
|---|---|
| (a) Brooks and Corey (Reference Brooks and Corey1964, Reference Brooks and Corey1966) | |
 |  |
 |  |
| (b) Campbell (Reference Campbell1974) | |
 |  |
 |  |
| (c) van Genuchten (Reference van Genuchten1980) | |
 , m = 1 − 1/n |  |
 |  ,  |
Note: (a) Se = 1 and K = Ksat for ψ>ψb. (b) θ/θsat = 1 and K = Ksat for ψ>ψsat. (c) Se = 1 and K = Ksat for ψ>0.
Parameter values vary depending on soil texture, and various so-called pedotransfer functions relate hydraulic parameters to discrete texture classes or as continuous functions of sand, clay, or other soil properties. The Brooks and Corey (Reference Brooks and Corey1964, Reference Brooks and Corey1966) parameters, for example, can be related to sand, clay, and porosity (Rawls and Brakensiek Reference Rawls, Brakensiek, Jones and Ward1985; Rawls et al. Reference Rawls, Ahuja, Brakensiek, Shirmohammadi and Maidment1993). Clapp and Hornberger (Reference Clapp and Hornberger1978) estimated parameters for various soil texture classes using the Campbell (Reference Campbell1974) relationship, and Cosby et al. (Reference Cosby, Hornberger, Clapp and Ginn1984) subsequently related θsat, ψsat, and b to the sand and clay content of soil. The van Genuchten (Reference van Genuchten1980) parameters can be difficult to estimate (Carsel and Parrish Reference Carsel and Parrish1988; Leij et al. Reference Leij, Alves, van Genuchten and Williams1996; Schaap et al. Reference Schaap, Leij and van Genuchten1998, Reference Schaap, Leij and van Genuchten2001). Table 8.3 gives representative values for soil texture classes.
| Soil type | Campbell | van Genuchten | |||||||
|---|---|---|---|---|---|---|---|---|---|
| θsat | ψsat (cm) | b | Ksat (cm h–1) | θsat | θres | α (cm–1) | n | Ksat (cm h–1) | |
| Sand | 0.395 | –12.1 | 4.05 | 63.36 | 0.43 | 0.045 | 0.145 | 2.68 | 29.70 |
| Loamy sand | 0.410 | –9.0 | 4.38 | 56.28 | 0.41 | 0.057 | 0.124 | 2.28 | 14.59 |
| Sandy loam | 0.435 | –21.8 | 4.90 | 12.48 | 0.41 | 0.065 | 0.075 | 1.89 | 4.42 |
| Silt loam | 0.485 | –78.6 | 5.30 | 2.59 | 0.45 | 0.067 | 0.020 | 1.41 | 0.45 |
| Loam | 0.451 | –47.8 | 5.39 | 2.50 | 0.43 | 0.078 | 0.036 | 1.56 | 1.04 |
| Sandy clay loam | 0.420 | –29.9 | 7.12 | 2.27 | 0.39 | 0.100 | 0.059 | 1.48 | 1.31 |
| Silty clay loam | 0.477 | –35.6 | 7.75 | 0.61 | 0.43 | 0.089 | 0.010 | 1.23 | 0.07 |
| Clay loam | 0.476 | –63.0 | 8.52 | 0.88 | 0.41 | 0.095 | 0.019 | 1.31 | 0.26 |
| Sandy clay | 0.426 | –15.3 | 10.4 | 0.78 | 0.38 | 0.100 | 0.027 | 1.23 | 0.12 |
| Silty clay | 0.492 | –49.0 | 10.4 | 0.37 | 0.36 | 0.070 | 0.005 | 1.09 | 0.02 |
| Clay | 0.482 | –40.5 | 11.4 | 0.46 | 0.38 | 0.068 | 0.008 | 1.09 | 0.20 |
Note: Soils are arranged from least to most clay.
Water held in soil is subjected to two forces, or potentials. The force of gravity pulls water downward, denoted as gravitational potential. Gravitational potential is the height z above some arbitrary reference height. The second force is the matric potential, which holds water to the soil particles. The total potential, also known as hydraulic head, is ψ + z, and this is the work per unit weight required to move an amount of water at some elevation and matric potential to another position in the soil with a different potential. Soil water potential as used in this chapter has the units of energy per unit weight and has the dimension of length (m):
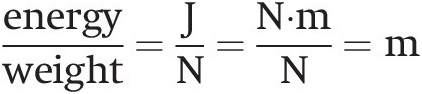
Other units for potential are energy per unit mass (J kg–1) or energy per unit volume (J m–3), and this latter expression is also the units of pressure (Pa). Soil water potential is converted from m to J kg–1 by multiplying by gravitational acceleration g and to J m–3 by multiplying by ρwatg:
A wet soil with a matric potential of –0.01 MPa has a suction of approximately 1000 mm; a dry soil with –1.5 MPa has a suction of approximately 150 m.
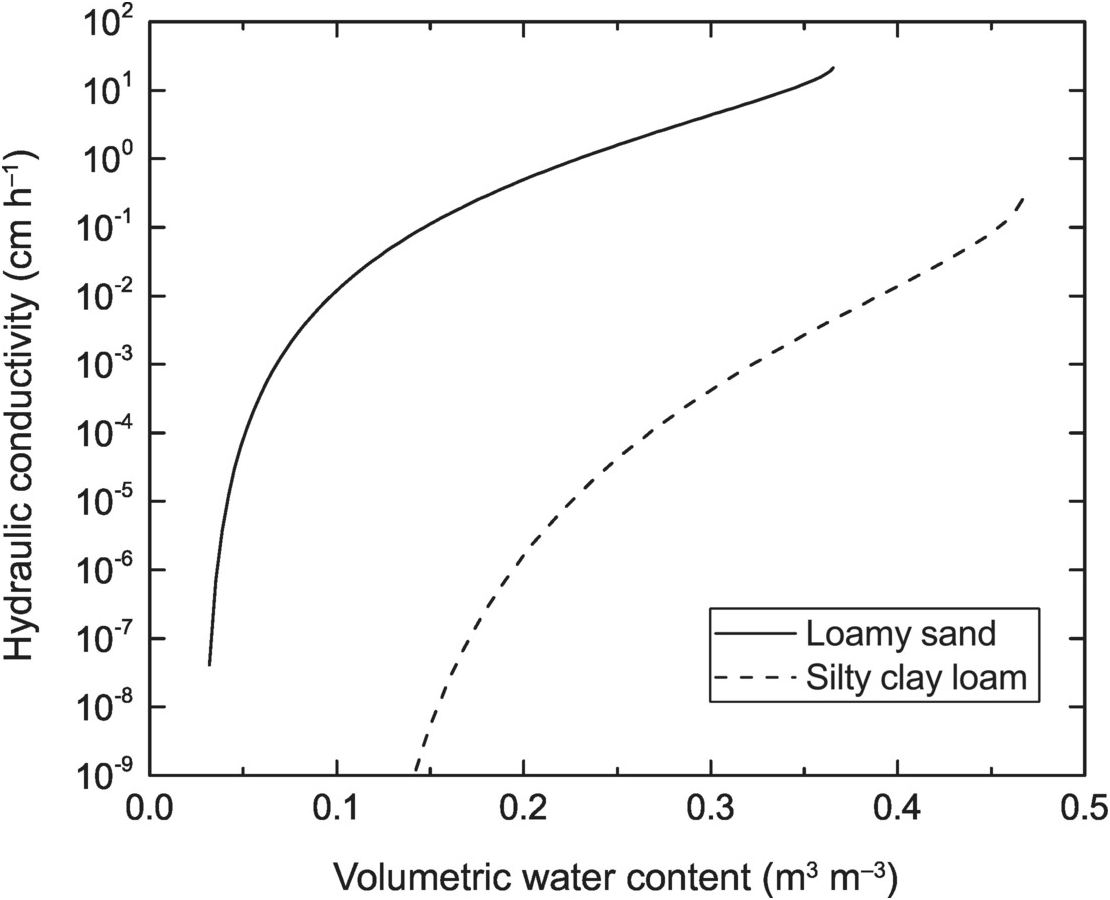
Hydraulic conductivity governs the rate of water flow for a unit gradient in potential. Hydraulic conductivity decreases sharply as soil becomes drier because suction increases and because the pore space filled with water becomes smaller and discontinuous. This relationship is nonlinear and varies with soil texture (Figure 8.5). Sandy soil has a higher conductivity than clay soil. The relationship between K and θ is not independent of the relationship between θ and ψ, and the derivation of K(θ) requires an expression for θ(ψ) (Figure 8.4). This expression is given in terms of the effective saturation Se, or θ/θsat in the Campbell (Reference Campbell1974) equation, so that hydraulic conductivity can be equivalently expressed as K(ψ). The expressions for hydraulic conductivity also require Ksat, the hydraulic conductivity at saturation. The term  in the van Genuchten (Reference van Genuchten1980) equation for hydraulic conductivity is a common form, but the exponent can vary (Schaap et al. Reference Schaap, Leij and van Genuchten2001). Better fit to data can be achieved by replacing Ksat with a curve fitting parameter K0, but this has a value that is usually less than Ksat so that K(θ)≠Ksat at θsat (Schaap et al. Reference Schaap, Leij and van Genuchten2001).
Hydraulic conductivity in relation to water content. Shown is the van Genuchten (Reference van Genuchten1980) K(θ)relationship for Berino loamy fine sand and Glendale silty clay loam. Parameter values are as in Figure 8.4 and Ksat= 22.54 and 0.55 cm h–1, respectively.
Question 8.1 Graph and compare the van Genuchten (Reference van Genuchten1980) and Campbell (Reference Campbell1974) relationships for θ(ψ) and K(θ) for sandy loam, loam, and clay loam using parameter values in Table 8.3. Describe differences in the shape of these relationships.
8.4 Richards Equation
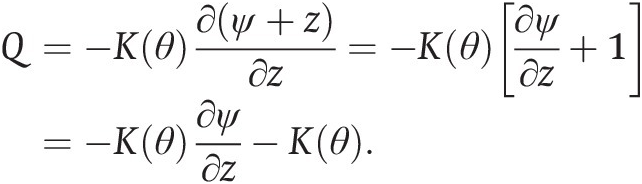
Darcy’s law describes water flow. In the vertical dimension, the rate of water movement is
 (8.9)
This is a form of Fick’s law and relates the rate of flow to the product of the hydraulic conductivity and the vertical gradient in water potential. The flux Q is the volume of water (m3) flowing through a unit cross-sectional area (m2) per unit time (s) and has the dimensions length per time (m s–1). Hydraulic conductivity has the same units, and K(θ) denotes that hydraulic conductivity depends on soil moisture. The total potential ψ + z has dimensions of length (m). It governs water movement so that water flows from high to low potential. The vertical depth z is taken as positive in the upward direction so that z = 0 is the ground surface and z < 0 is the elevation relative to the surface with greater depth into the soil. The matric potential has values ψ < 0 for unsaturated soil and ψ ≥ 0 for saturated soil. The negative sign in (8.9) ensures that downward water flow is negative and upward flow is positive.
The flow of water given by Darcy’s law depends strongly on soil moisture. The dominant force causing water to move in a wet soil is the gravitation potential. Water near the surface has a higher gravitational potential than water deeper in the soil, and because water flows from high potential to low potential, it flows downward from the force of gravity. This is given by z in (8.9), which is the height relative to the ground surface. In drier soils, matric potential decreases, and the adsorptive force binding water to soil particles generally exceeds the gravitational force pulling water downward. This reduces the rate of water flow. The lower hydraulic conductivity in dry soils also restricts water movement.
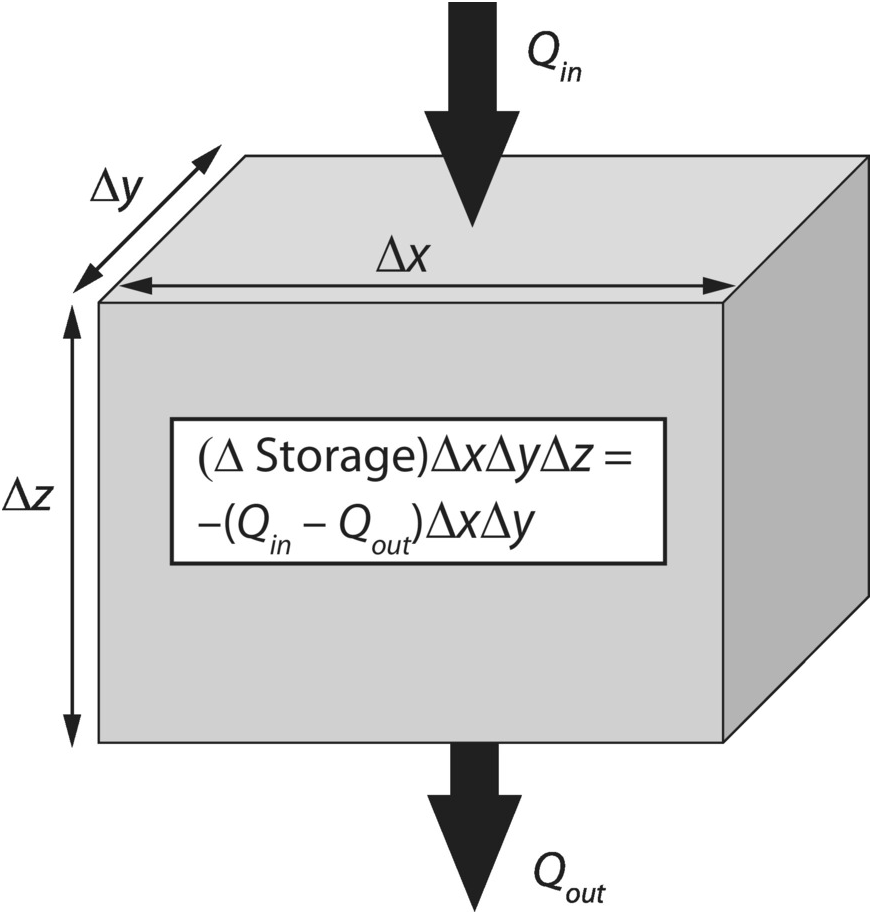
An equation for the time rate of change in soil moisture is obtained from principles of conservation similar to that for soil temperature. Consider a volume of soil with horizontal area ΔxΔy and thickness Δz and in which water flows only in the vertical dimension (Figure 8.6). The mass flux of water (kg s–1) entering the soil across the cross-sectional area ΔxΔy is ρwatQinΔxΔy, and the flux out of the soil is similarly ρwatQoutΔxΔy. Conservation requires that the difference between the flux of water into and out of the soil equals the rate of change in water storage. The mass of water in the soil volume is ρwatθΔxΔyΔz so that the change in soil water over the time interval Δt is
 (8.10)
and
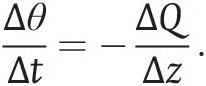 (8.11)
Equation (8.11) is the continuity equation for water, with the left-hand side the change in water storage and the right-hand side the flux divergence.
Water balance for a soil volume with the fluxes Qin entering the volume and Qout exiting the volume.
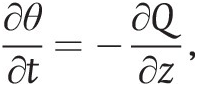
In the notation of calculus, the continuity equation is
 (8.12)
and substituting Darcy’s law for Q gives
 (8.13)
This is the Richards equation and describes the movement of water in an unsaturated porous medium (Richards Reference Richards1931). Equation (8.13) is called the mixed-form equation because it includes the time rate of change in θ on the left-hand side and the vertical gradient in ψ on the right-hand side. Other forms of the Richards equation use the dependence between ψ and θ to express the equation in terms of only one unknown variable. The head-based, or ψ-based, form transforms the storage term on the left-hand side of the equation from θ to ψ so that ψ is the dependent variable. This uses the chain rule to expand ∂θ/∂t as
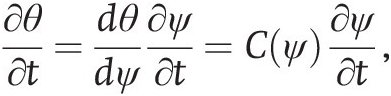 (8.14)
in which C(ψ) = dθ/dψ is known as the specific moisture capacity (m–1) and is the slope of the soil moisture retention curve. Then (8.13) is rewritten as
 (8.15)
The ψ-based form is applicable for unsaturated and saturated conditions and provides a continuous equation for water flow in the vadose zone and for groundwater. However, it is not mass conserving because the specific moisture capacity dθ/dψ that appears in the storage term itself depends on ψ and so is not constant over a discrete time interval during which ψ changes value (Milly Reference Milly1985; Celia et al. Reference Celia, Bouloutas and Zarba1990). Whereas (8.14) is mathematically correct, its temporal discretization over some time interval Δt (as required in numerical methods) is not equivalent. The moisture-based, or θ-based, equation uses θ as the dependent variable with
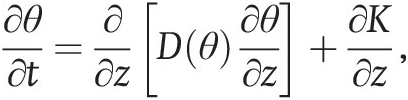 (8.16)
in which D(θ) = K(θ)/C(ψ) is referred to as the hydraulic diffusivity (m2 s–1). In this equation, the specific moisture capacity appears within the spatial derivative. The θ-based form is mass conserving but is restricted to the unsaturated zone because soil moisture does not vary within a saturated porous medium (soil moisture is bounded by 0 ≤ θ ≤ θsat) whereas pressure head does vary. Furthermore, the equation is restricted to homogenous soils because θ is not continuous across soil layers with different θ(ψ) relationships. As a result, soils in which texture varies with depth have discontinuous vertical profiles of θ, whereas ψ is continuous even in inhomogeneous soils.
The Richards equation requires relationships for K(θ) and θ(ψ). Analytical solutions are difficult to obtain because these relationships are highly nonlinear. Instead, numerical methods are used, which requires first writing the finite difference approximation of the partial differential equation and then linearizing the nonlinear terms involving K(θ) and C(ψ). The accuracy of the solution very much depends on the details of the numerical methods, the form of the Richards equation, and the size of the time step and grid spacing. The literature on numerical methods to solve the Richards equation is enormous. The next two sections provide an introduction to this literature with the caveat that many more numerical techniques are available and the merits of particular methods are still being debated.
Question 8.2 Soil at a depth of 5 cm has a matric potential of –478 mm, and the matric potential 50 cm deeper is –843 mm. Calculate the vertical water flux with a hydraulic conductivity of 2 mm h–1. What is the horizontal water flux if both locations are at the same depth in the soil but separated by 50 cm? Explain the difference between the two fluxes.
Question 8.3 In Darcy’s law given by (8.9), water flux has the units m H2O s–1, hydraulic conductivity is m s–1, and hydraulic head is m. Is  an equivalent equation? What are the units for ψ, K(θ), and Q in this equation? Derive the conversion factor for K(θ) from m s–1 to the same units as ψ.
Question 8.4 A model calculates soil moisture in the unsaturated zone using the mixed-form Richards equation and solves the equation  . Explain the difference between this equation and (8.13). Are the equations equivalent?
8.5 Finite Difference Approximation
The finite difference approximation for the Richards equation represents the soil as a network of discrete nodal points that vary in space and time similar to that for soil temperature. In doing so, it is necessary to remember that hydraulic conductivity is not constant but, rather, varies with depth depending on soil moisture so that the mixed-form equation is expanded as
 (8.17)
For reasons of numerical stability similar to soil temperature, (8.17) is solved using an implicit time discretization in which the spatial derivatives ∂K/∂z, ∂ψ/∂z, and ∂2ψ/∂z2 are written numerically using a central difference approximation at time n + 1, and the time derivative uses a backward difference approximation at n + 1 (Appendix A4). For a vertical grid with discrete layers each equally spaced at a distance Δz and with z positive in the upward direction so that layer i is above layer i + 1, the numerical form of (8.17) is
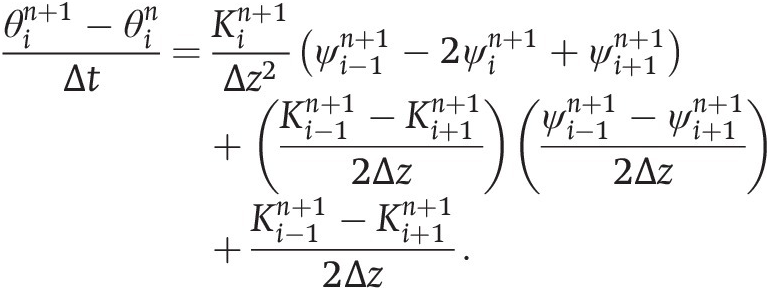 (8.18)
This is an implicit solution in which θ and ψ are expressed at n + 1, and K is similarly evaluated with θ at n + 1. Rearranging terms gives an equivalent form in which
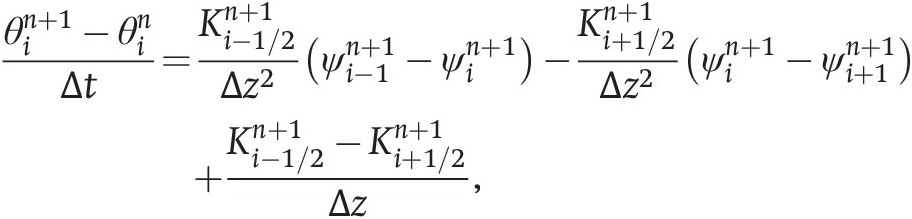 (8.19)
with
 (8.20)
The ψ-based form of the equation is obtained by replacing the left-hand side of (8.19) with  .
A more general derivation of (8.19) is obtained by considering the mass balance of a soil layer. Figure 8.7 depicts the soil profile in a cell-centered grid of N discrete layers similar to that used for soil temperature. Soil layer i has a thickness Δzi. Water content θi, matric potential ψi, and hydraulic conductivity Ki are defined at the center of the layer at depth zi and are uniform over the layer. Depth decreases in the downward direction from the surface so that z0 = 0 denotes the surface and zi + 1 < zi (i.e., depths are negative distances from the surface). The flux of water Qi between adjacent layers i and i + 1 depends on the hydraulic conductivities of the two layers. The hydraulic conductivity Ki + 1/2 replaces the vertically varying hydraulic conductivities in the two adjacent layers with an effective conductivity for an equivalent homogenous medium so that the flux Qi is
 (8.21)
with Δzi + 1/2 = zi − zi + 1 the distance between nodes i and i + 1. The flux Qi − 1 at the top of soil layer i is similarly
 (8.22)
and Δzi − 1/2 = zi − 1 − zi. With fluxes expressed for time n + 1, the mass balance for soil layer i is
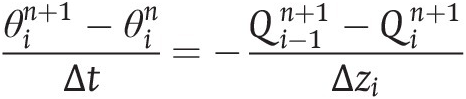 (8.23)
so that
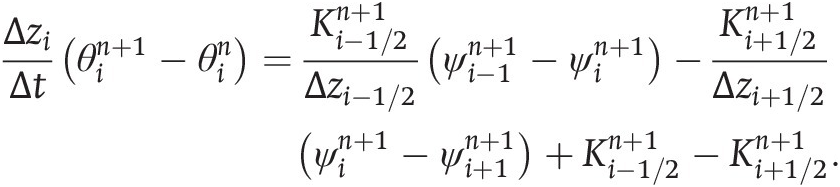 (8.24)
For constant soil layer thickness, this is equivalent to (8.19).
Multilayer soil water flow in a cell-centered grid oriented such that i = 1 is the top soil layer at the surface, and i = N is the bottom soil layer. Each layer has a thickness Δzi. The depth zi − 1/2 is the interface between adjacent layers i − 1 and i, and zi + 1/2 is the interface between i and i + 1. Depths are negative distances from the surface so that Δzi = zi − 1/2 − zi + 1/2 (i.e., zi + 1/2 = zi − 1/2 − Δzi). The depth zi is defined at the center of layer i so that zi = (zi − 1/2 + zi + 1/2)/2. Δzi ± 1/2 is the grid spacing between i and i ± 1. Water content θi, matric potential ψi, and hydraulic conductivity Ki are defined at the center of layer i at depth zi and are uniform over the layer. An effective hydraulic conductivity Ki ± 1/2 is defined at the interface between soil layers at depth zi ± 1/2. Shown are (a) the first soil layer (i = 1); (b) layers 1 < i < N depicted generally as three soil layers denoted i − 1, i, and i + 1; and (c) the bottom soil layer (i = N). The surface matric potential ψ0 or the flux Q0 provide the upper soil boundary condition, and the lower boundary condition at the bottom of the soil is ψN + 1 or gravitational drainage QN.
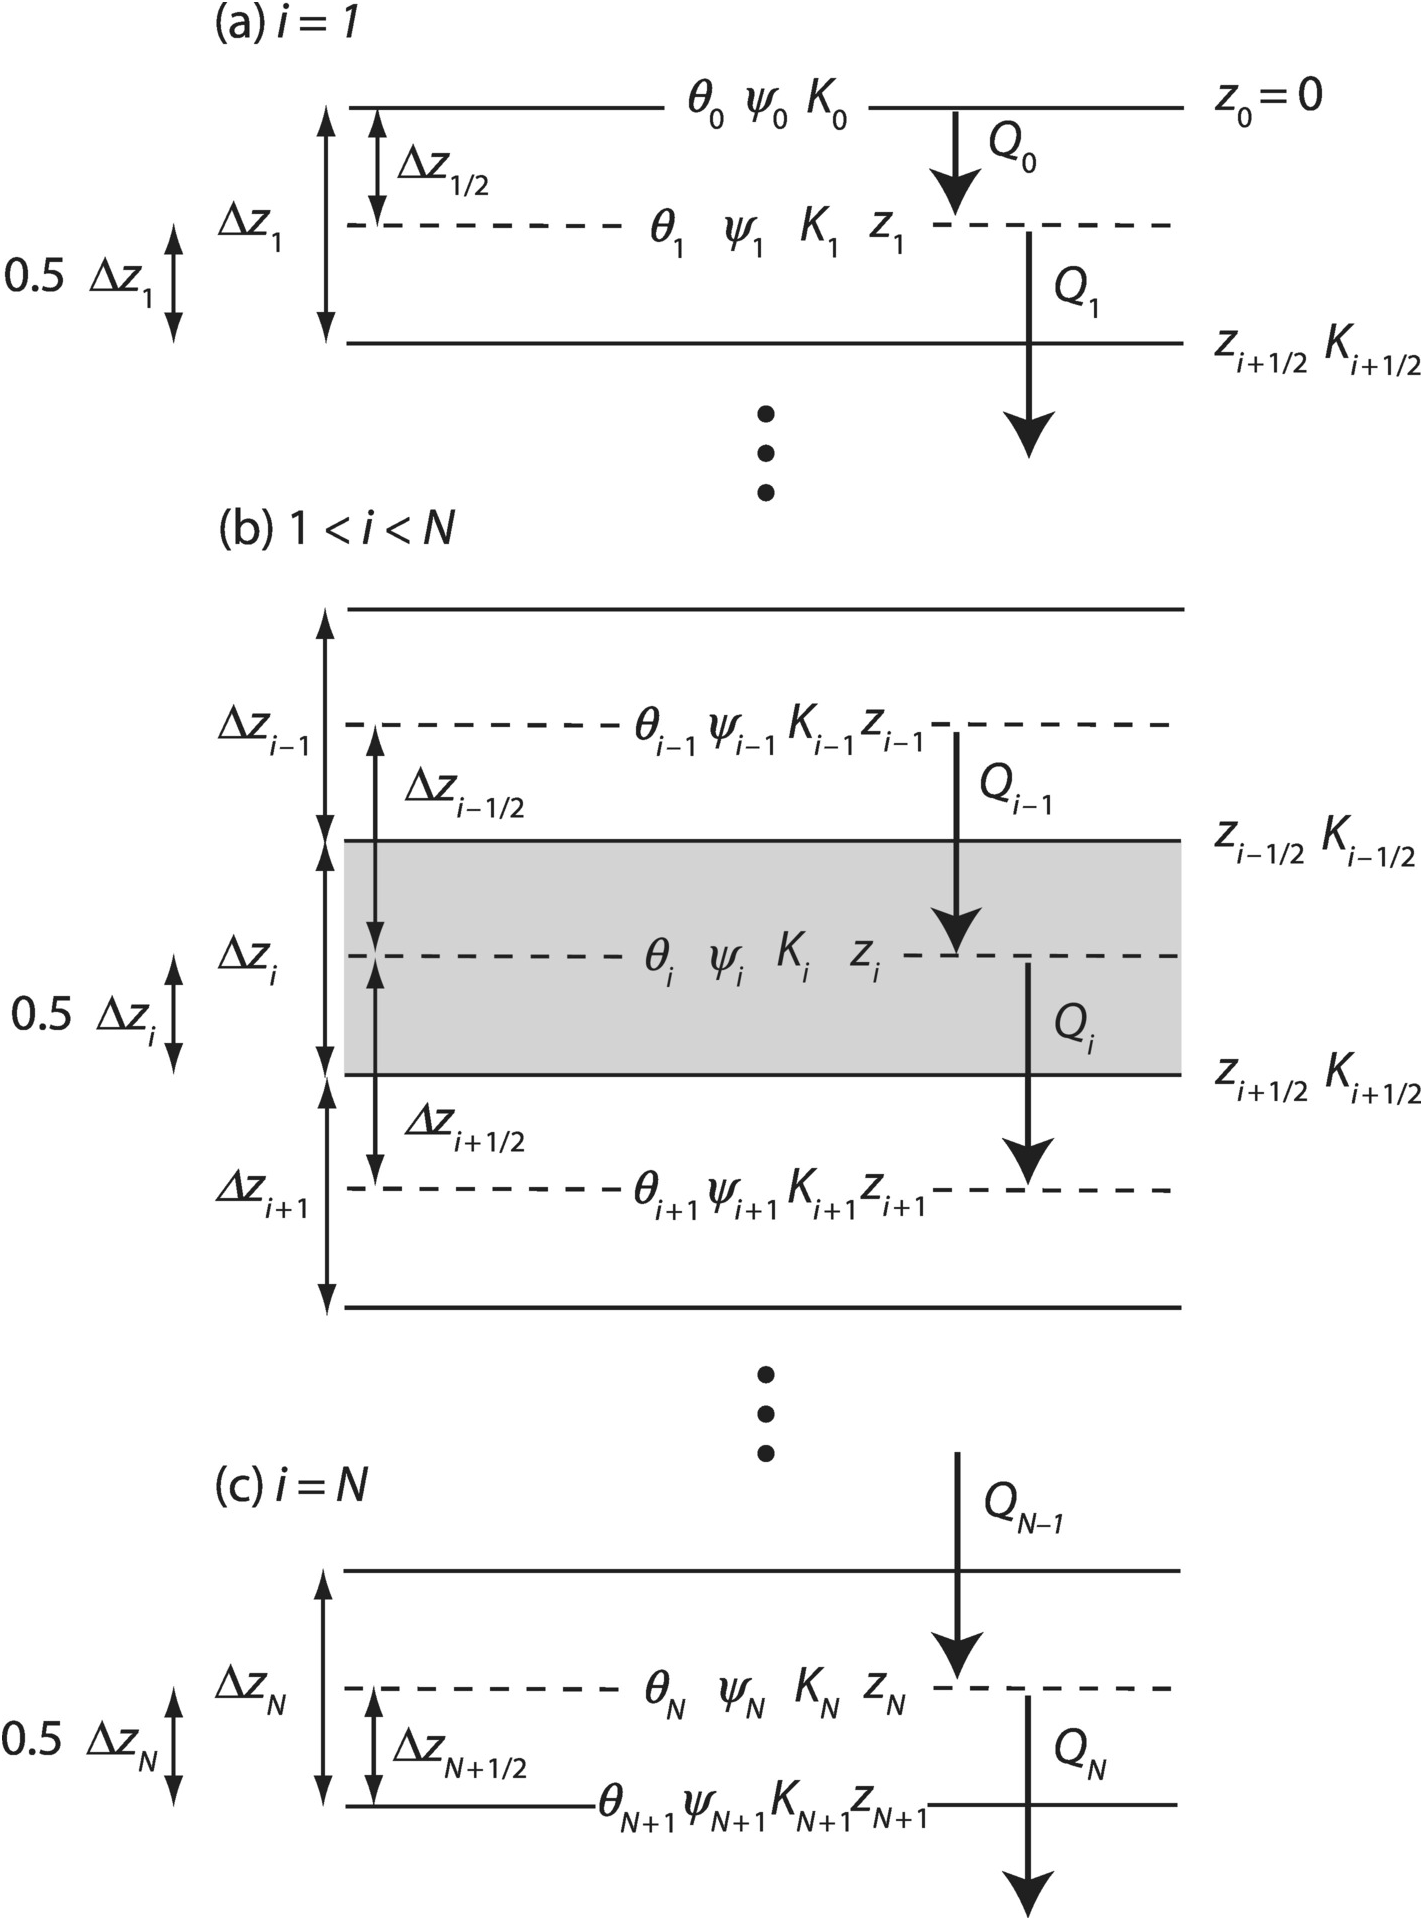
Equation (8.24) describes the water balance of soil layers 1 < i < N. Special equations are needed for the top (i = 1) and bottom (i = N) layers to account for boundary conditions. Boundary conditions at the surface are specified in terms of ψ0 (Dirichlet boundary condition) or as a flux of water Q0 into the soil (Neumann boundary condition). With the surface value ψ0 specified, (8.24) is still valid, in which case the corresponding flux of water into the soil is
 (8.25)
Alternatively, Q0 can be directly specified as the boundary condition (e.g., as an infiltration rate; negative into the soil), in which case the water balance for layer i = 1 is
 (8.26)
The lower boundary condition at the bottom of the soil column can similarly be specified in terms of ψ or as a flux of water. When given as the matric potential ψN + 1, the corresponding flux of water draining out of the soil column is
 (8.27)
A common flux boundary condition specifies free drainage at the bottom of the soil column in which QN = − KN. This is referred to as a unit hydraulic gradient because ∂ψ/∂z = 0 in the Darcian flux. The water balance of layer i = N is then
 (8.28)
Alternatively, the soil column can be coupled with a groundwater model to allow for the influence of water table dynamics on soil moisture. The total change in water in the soil column equals the net flux into the soil so that conservation is given by
 (8.29)
Equation (8.20) defines the effective conductivity Ki ± 1/2 from the central difference approximation for (∂K/∂z)(∂ψ/∂z). Hydraulic conductivity can differ substantially between layers because of vertical gradients in soil moisture (e.g., during infiltration into a dry soil). The equation used to represent the effective conductivity affects the accuracy of the numerical solution, and other expressions can be used for Ki ± 1/2 (Haverkamp and Vauclin Reference Haverkamp and Vauclin1979; Warrick Reference Warrick1991, Reference Warrick2003). The effective conductivity can be defined as the arithmetic mean of the adjacent nodal conductivities in which
Another expression is the geometric mean whereby
The harmonic mean is the reciprocal of the arithmetic mean of the reciprocals with
 (8.32)
This latter equation is similar to (5.16) for the effective thermal conductivity and is obtained for constant Δz from continuity of flow across the interface so that the flux of water from depth zi to zi + 1/2 equals the flux from zi + 1/2 to zi + 1. While the harmonic mean ensures continuity of fluxes at the interface, it is weighted towards the lower value of the two hydraulic conductivities and is the smallest of the three means. The arithmetic mean has the largest value, and the geometric mean has an intermediate value. The arithmetic mean is commonly used – e.g., as in the numerical solutions of Haverkamp et al. (Reference Haverkamp, Vauclin, Touma, Wierenga and Vachaud1977) and Celia et al. (Reference Celia, Bouloutas and Zarba1990).
The numerical form of the ψ-based Richards equation is similar to (5.18) for soil temperature. For a soil with N layers, this is a tridiagonal system of N equations with N unknown values of ψ at time n + 1. This is more obvious by rewriting the finite difference approximation of the mixed-form equation given by (8.24) in the ψ-based form and rearranging terms to get
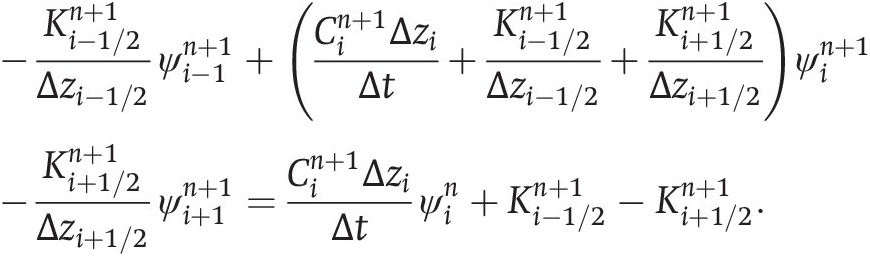 (8.33)
A general form for this equation is
 (8.34)
or, in matrix notation (Appendix A6),
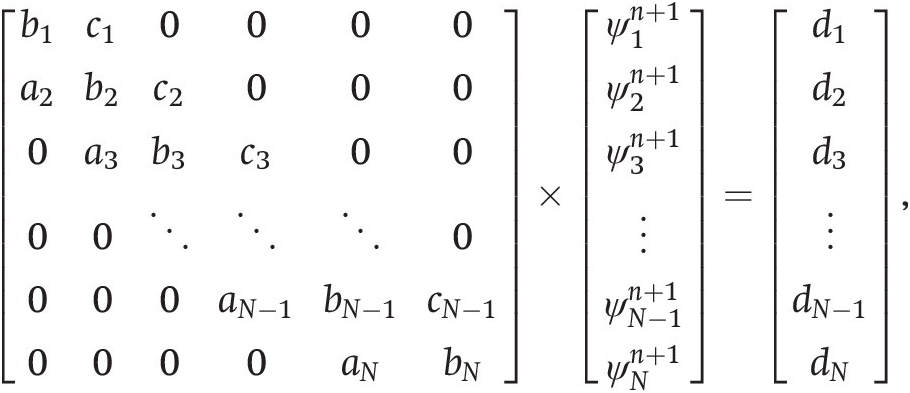 (8.35)
in which the matrix elements a, b, c, and d are evident from (8.33), with special values for i = 1 and i = N to account for boundary conditions (Table 8.4).
| Layer | ai | bi | ci | di |
|---|---|---|---|---|
| i = 1 | 0 | 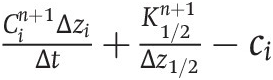 | 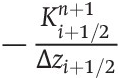 |  |
| 1 < i < N | 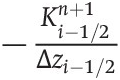 | 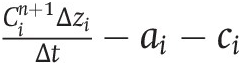 | 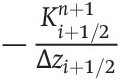 |  |
| i = N | 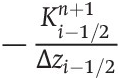 | 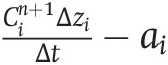 | 0 |  |
Note: Boundary conditions are  for the first layer (i = 1) and free drainage for the bottom layer (i = N).
However, whereas soil temperature uses a linear equation, (8.33) is a nonlinear equation for ψ because of the complex dependence of K and C on ψ. This nonlinearity is evident when these terms are replaced with their various expressions given in Table 8.2. An additional complexity is that ψ at n + 1 also appears on the right-hand side of (8.33) through K and C. Solving a nonlinear equation is challenging, and solving the system of nonlinear equations required to represent N soil layers is especially challenging. The solution requires linearizing (8.33) with respect to ψ through various numerical methods. One simple linearization uses values of K and C obtained at the preceding time step (at time n rather than n + 1). This is an implicit solution for ψ but with explicit linearization of K and C (Haverkamp et al. Reference Haverkamp, Vauclin, Touma, Wierenga and Vachaud1977).
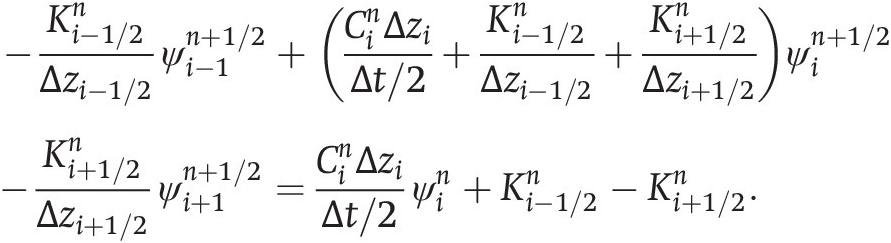
A better numerical technique is the predictor–corrector method. This is a two-step solution that solves the Richards equation twice. The predictor step uses explicit linearization to solve for ψ over one-half a full time step (Δt/2) at time n + 1/2 with K and C from time n. The resulting values for ψ are used to evaluate K and C at n + 1/2, and the corrector step uses these to obtain ψ over the full time step (Δt) at n + 1. The method can be applied to the ψ-based Richard equations (Haverkamp et al. Reference Haverkamp, Vauclin, Touma, Wierenga and Vachaud1977) or the θ-based equation (Hornberger and Wiberg Reference Hornberger and Wiberg2005). These implementations use an implicit solution for the predictor step and the Crank–Nicolson method (Appendix A4) for the corrector step. The predictor equation for ψ at n + 1/2 is
 (8.36)
The corrector equation solves for ψ over a full time step using the Crank–Nicolson method with fluxes evaluated at time n and n + 1 whereby
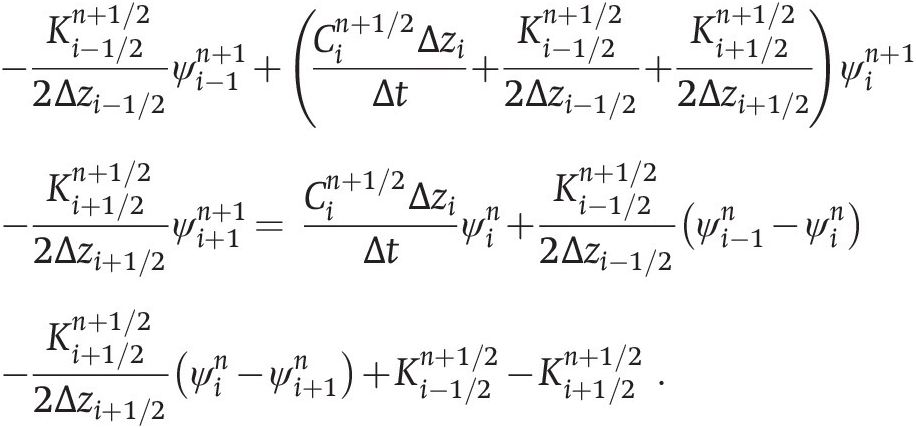 (8.37)
Equations (8.36) and (8.37) are both a tridiagonal system of linear equations and are easily solved for ψ (Appendix A8).
Question 8.5 Soil temperature is commonly modeled with zero heat flux as the boundary condition at the bottom of the soil column. Explain how this is similar to the free drainage boundary condition for soil moisture.
Question 8.7 Table 8.4 gives the tridiagonal coefficients ai, bi, ci, and di for the ψ-based Richards equation using the implicit method. Derive the same coefficients for the Crank–Nicolson method as used in the predictor–correct solution. What is the equation for the infiltration rate Q0?
8.6 Iterative Numerical Solutions
Other numerical methods use iterative calculations. These methods approach the correct solution by using successive approximations in which values for K and C from one iteration are used at the next iteration. Picard iteration, which is an example of fixed-point iteration (Appendix A5), is one such numerical algorithm. As applied to the ψ-based Richards equation, Picard iteration provides successive estimates for ψ using values of K and C evaluated with the previous value of ψ (Celia et al. Reference Celia, Bouloutas and Zarba1990). The iteration repeats until ψ does not change value between iterations. With n denoting time and m denoting iteration, (8.33) is written as
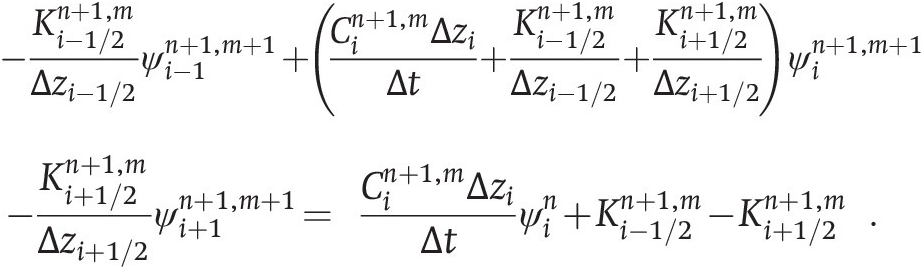 (8.38)
The values of K and C are obtained from iteration m so that (8.38) is a tridiagonal system of linear equations that is solved for ψ at time n + 1 and iteration m + 1. It is more convenient to rewrite this equation to solve for the change in ψ between iterations (δm + 1 = ψn + 1, m + 1 − ψn + 1, m) rather than directly for ψ itself. With this modification, (8.38) becomes
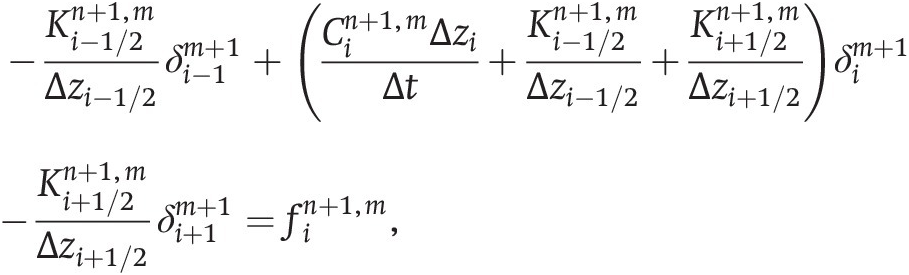 (8.39)
with
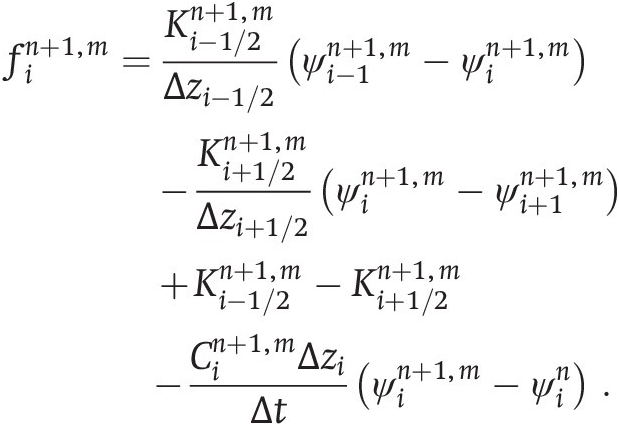 (8.40)
Terms are known at iteration m, and (8.39) is solved for δ at iteration m + 1. The right-hand side of (8.39) is the ψ-based Richards equation evaluated at the mth iteration. As the solution converges, δ becomes small so that the left-hand side approaches zero, and (8.39) is the standard finite difference approximation with K and C expressed for n + 1. Picard iteration is a simple procedure that evaluates K and C for the current estimate of ψ, uses these to solve for a new value of ψ, and repeats this calculation until convergence is achieved. However, convergence can require many iterations and is not always guaranteed.
A more complex numerical method uses Newton–Raphson iteration to linearize the system of N equations (Appendix A9). This method reformulates the solution in terms of finding the roots of the system of equations. Newton–Raphson iteration defines δm + 1 as given previously but uses a Taylor series approximation to linearize the Richards equation and solves for δm + 1 that satisfies the equation
 (8.41)
The right-hand side is the Richards equation evaluated at iteration m as in (8.40), and the left-hand side uses the partial derivatives ∂f/∂ψ evaluated at iteration m. The iteration proceeds until δ is less than some convergence criterion. Equation (8.41) is similar to Picard iteration; but whereas that method uses the standard terms in the Richards equation, Newton–Raphson iteration requires evaluating the partial derivatives with respect to ψ. In linear algebra, the partial derivatives are referred to as the Jacobian matrix. The two methods differ in the computational efficiency and robustness of the numerical solution (Paniconi et al. Reference Paniconi, Aldama and Wood1991; Paniconi and Putti Reference Paniconi and Putti1994; Lehmann and Ackerer Reference Lehmann and Ackerer1998). Picard iteration may fail to converge or may need many iterations to converge. Newton–Raphson iteration requires evaluating a matrix of partial derivatives (the Jacobian) and is computationally more expensive per iteration but can converge in fewer iterations and provide a more robust solution (though it, too, can fail to converge).
The difficulty in using the ψ-based Richards equation is that it does not conserve mass because the specific moisture capacity C(ψ) that appears in the water storage term is not constant over a time step (Milly Reference Milly1985; Celia et al. Reference Celia, Bouloutas and Zarba1990). Celia et al. (Reference Celia, Bouloutas and Zarba1990) devised a mass-conserving numerical solution for the mixed-form Richards equation that is a modified Picard iteration. The mixed-form equation is
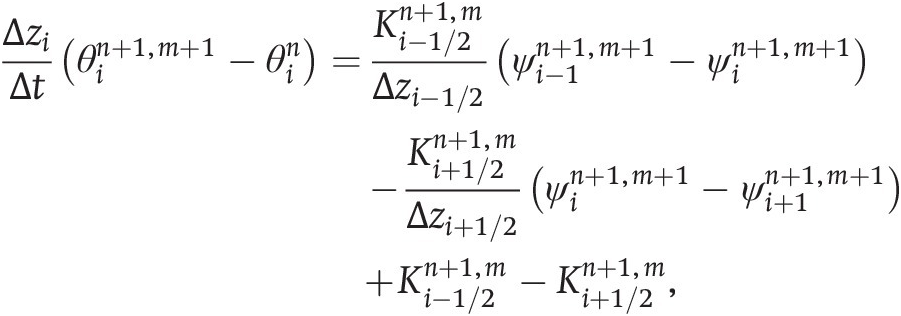 (8.42)
with n referring to time and m to iteration as before. Mass conservation is achieved by using a Taylor series approximation (Appendix A1) for 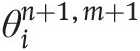 in which
 (8.43)
with
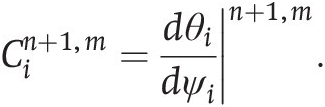 (8.44)
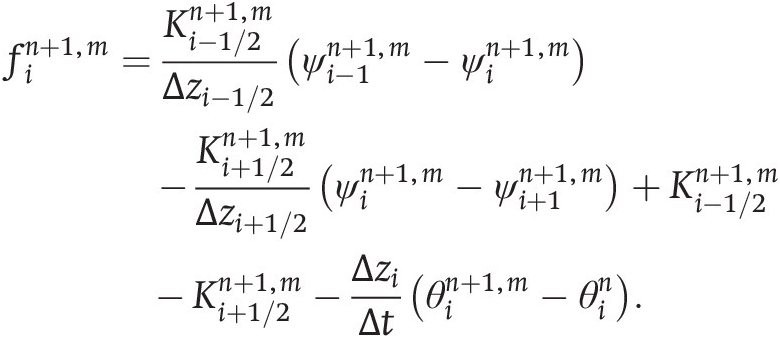
Substituting this expression into (8.42) and converting to residual form gives
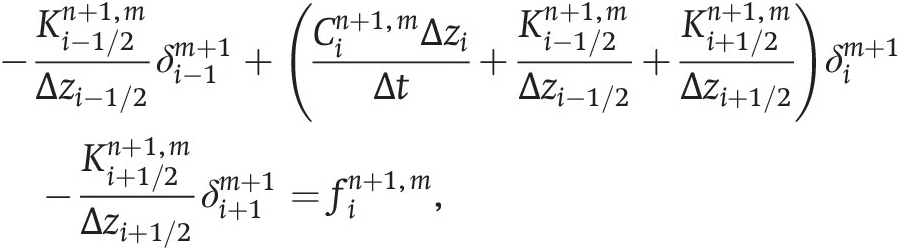 (8.45)
as with the ψ-based equation, but now with
 (8.46)
Equation (8.45) is a tridiagonal system of linear equations that is solved for δ. Table 8.5 gives the various terms in the tridiagonal equations. The iteration is repeated until some convergence criterion is satisfied. This can be an absolute threshold in which ∣δi ∣ ≤ εa for each layer or can also include both an absolute and a relative error term in which case  . As the iteration converges, δi approaches zero and (8.45) reduces to the mixed-form Richards equation. The key difference compared with the ψ-based Picard iteration is the use of a Taylor series approximation for θ, and this ensures mass conservation. At convergence,
 approaches zero, thereby eliminating inaccuracy in evaluating Ci.
| Layer | ai | bi | ci | di |
|---|---|---|---|---|
| i = 1 | 0 | 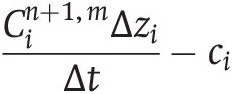 | 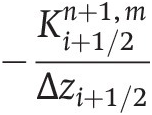 | 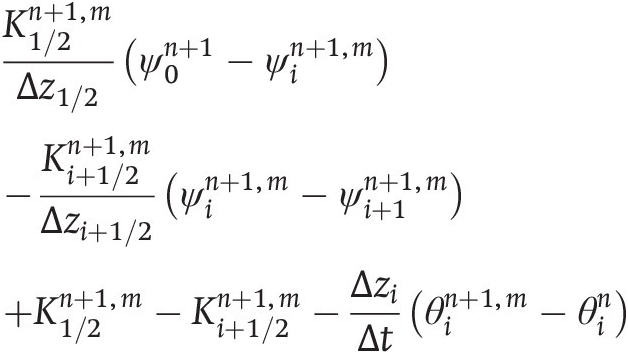 |
| 1 < i < N | 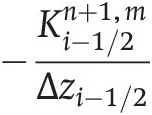 | 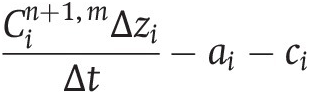 | 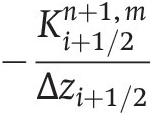 | 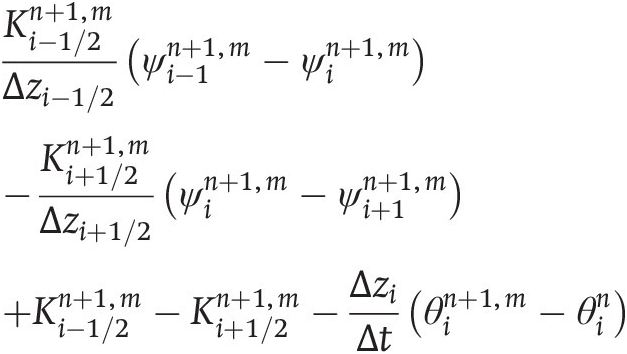 |
| i = N | 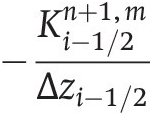 | 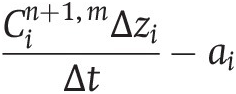 | 0 | 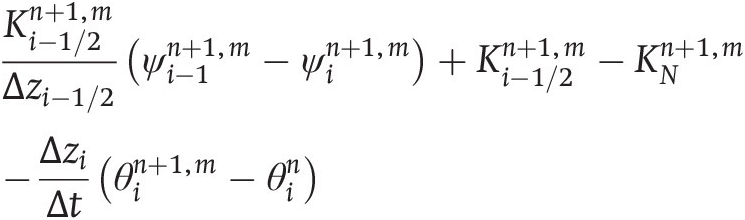 |
Note: Boundary conditions are  for the first layer (i = 1) and free drainage for the bottom layer (i = N).
Accurate solution of the Richards equation requires a small time step Δt and spatial increment Δz. This is particularly true during infiltration into dry soil, where there is a sharp wetting front. Some models utilize adaptive time stepping in which Δt is dynamically adjusted and varies between some minimum and maximum value based on specified criteria. One simple method is to adjust Δt at every time, based on the number of iterations required for convergence at the previous time (Paniconi et al. Reference Paniconi, Aldama and Wood1991; Paniconi and Putti Reference Paniconi and Putti1994). The time step is likely to be too short if few iterations are needed to achieve convergence, but is likely to be too long if convergence requires many iterations. The time step is increased by a specified factor if convergence is achieved in fewer than some number of iterations, is decreased if some number of iterations is exceeded, or is otherwise left unchanged. If the solution fails to converge after a maximum number of iterations, Δt is decreased by some fraction and the iteration is restarted.
Global models must simulate tens of thousands of soil columns over hundreds of years, and small vertical or temporal step sizes pose a large computational burden. In these models, a linear form of the θ-based Richards equation is commonly used because it conserves mass for all step sizes. The linearization is attained using a Taylor series approximation and can be solved directly for θ at n + 1 without iteration or also with Newton–Raphson iteration. The cost with larger step sizes and fewer iterations is less accuracy in the solution. With reference to Figure 8.7b, the water balance for soil layer i at time n + 1 and iteration m + 1 is
 (8.47)
The flux Qi − 1 is linearized as
 (8.48)
and Qi is
 (8.49)
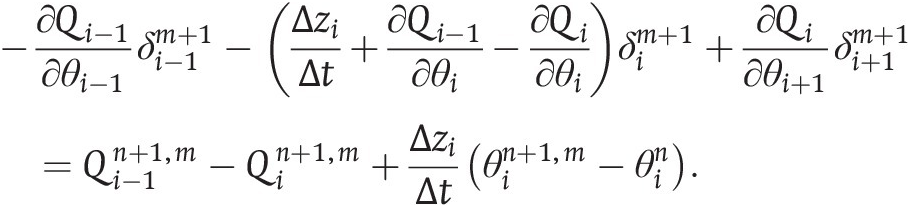
with δm + 1 = θn + 1, m + 1 − θn + 1, m. Substituting these expressions into (8.47), the water balance is
 (8.50)
The solution becomes more accurate with multiple iterations as δ approaches zero. The complexity lies in the partial derivatives, which include expressions for ∂ψ/∂θ and ∂K/∂θ.
Question 8.8 Contrast the predictor–corrector, modified Picard, and Newton–Raphson methods to solve the Richards equations. What are the main differences among these methods? What are the similarities?
Question 8.9 Use Newton–Raphson iteration to solve the system of equations: 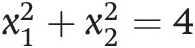 and x1x2 = 1.
8.7 Infiltration
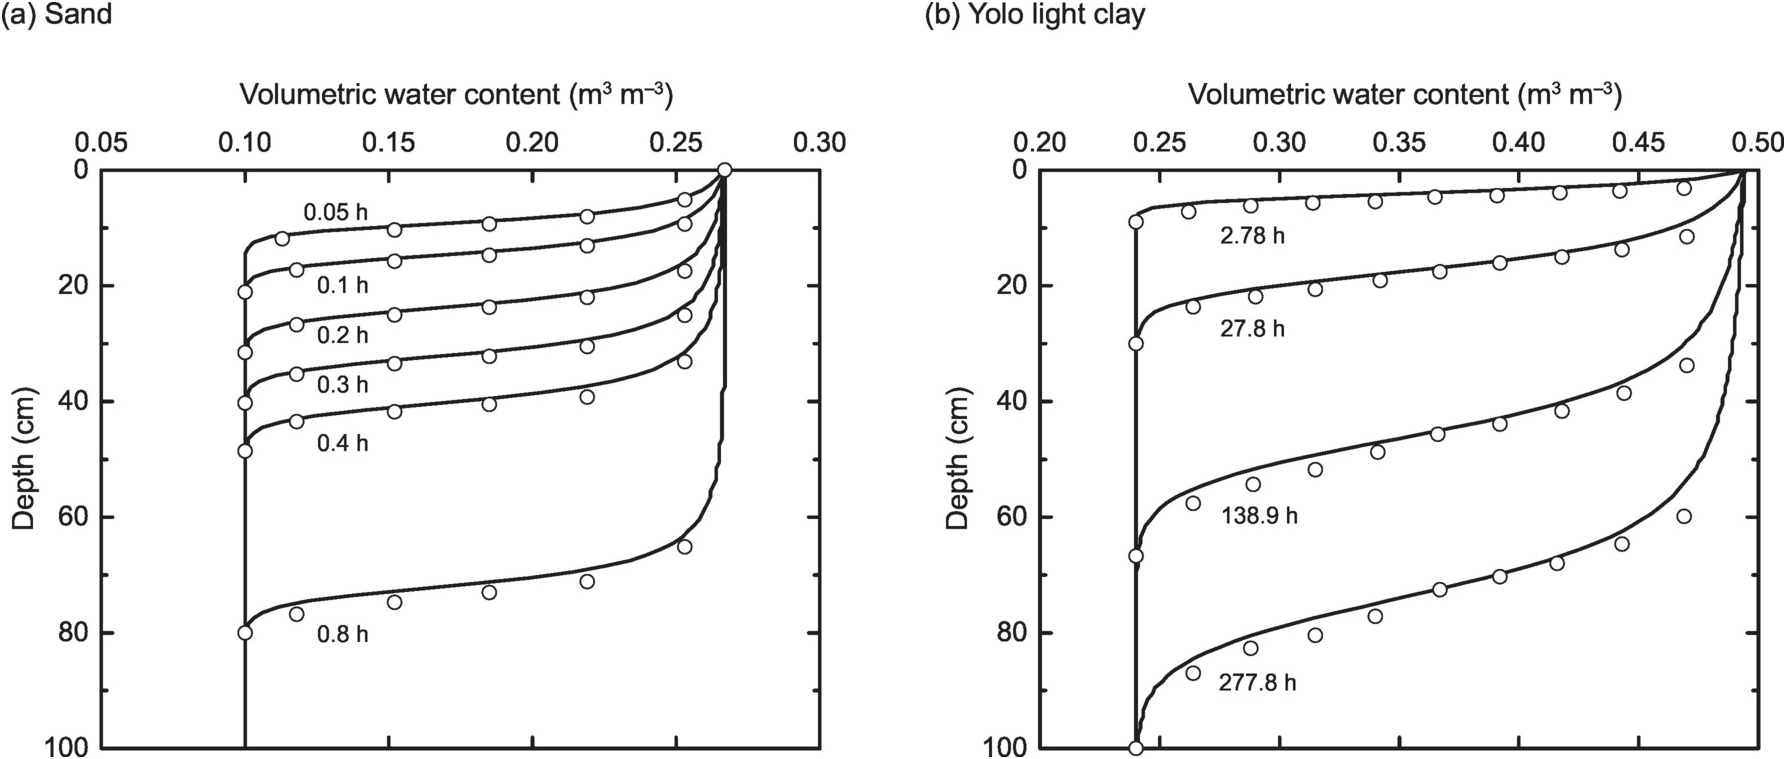
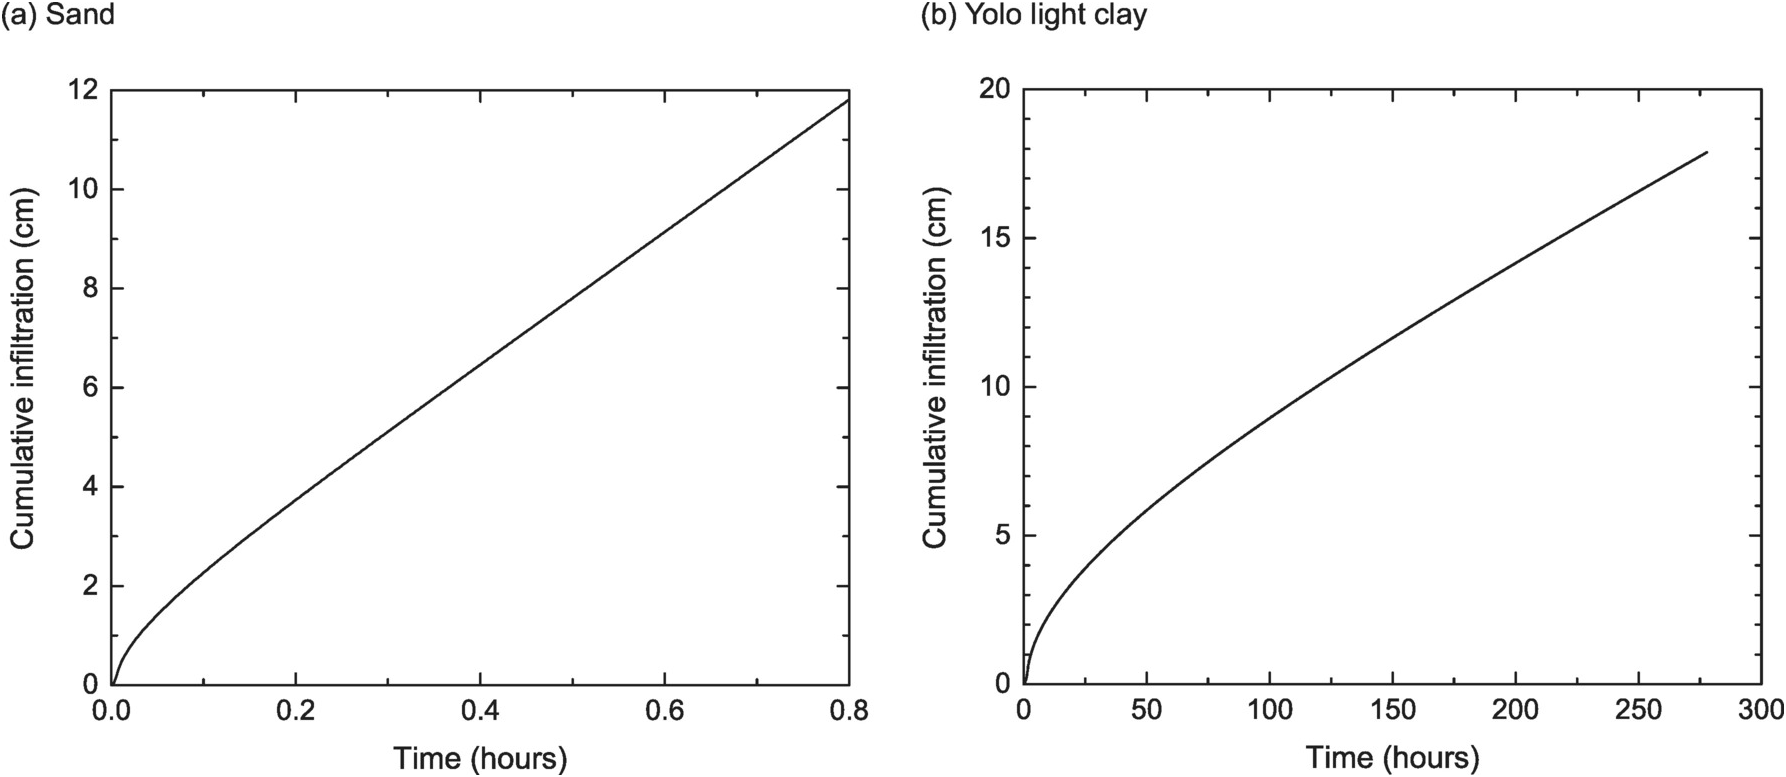
The Richards equation can be used to model infiltration into soil. The boundary condition at the soil surface depends on the rate at which water is applied to the soil. When the supply rate is less than the saturated hydraulic conductivity, no water accumulates on the surface and a flux (Neumann) boundary condition is used. If sufficient water is provided so that the soil surface is saturated but water does not pond, a concentration (Dirichlet) boundary condition is used with θ0 = θsat. If water ponds on the soil surface, the boundary condition is θ0 = θsat and with a small positive depth of water on the surface. Figure 8.8 shows soil moisture profiles during infiltration into sand and Yolo light clay using the predictor–corrector method, as in Haverkamp et al. (Reference Haverkamp, Vauclin, Touma, Wierenga and Vachaud1977). Initial conditions for sand are θ = 0.1 at t = 0, and the boundary condition is θ0 = 0.267 for t>0. The simulated soil moisture closely matches the analytical solution. For clay, the initial and boundary conditions are θ = 0.24 and θ0 = 0.495. Infiltration into the clay proceeds much slower than the sand. The sand absorbs almost 12 cm of water in 48 minutes while 18 cm of water infiltrates into the clay over 11.6 days (Figure 8.9).
Soil moisture profiles for (a) sand and (b) Yolo light clay during infiltration with a specified θ0 boundary condition. Simulations are as in Haverkamp et al. (Reference Haverkamp, Vauclin, Touma, Wierenga and Vachaud1977) and use the predictor–correction method. Results are shown at various times up to 0.8 h (48 minutes) for sand and 277.8 h (11.6 days) for clay. The open circles show the analytical solution from Haverkamp et al. (Reference Haverkamp, Vauclin, Touma, Wierenga and Vachaud1977).
As in Figure 8.8, but for cumulative infiltration.
8.8 Source and Sink Terms
The Richards equation, as discussed in this chapter, considers only the vertical Darcian fluxes of water. An additional source or sink term can be added (source) or subtracted (sink) to account for other water fluxes. Primary among these is evapotranspiration loss, which is accounted for by subtracting a root extraction, or sink, term in the Richards equation. Other plant-mediated water fluxes such as hydraulic redistribution can also be considered. In this case, the water balance is
 (8.51)
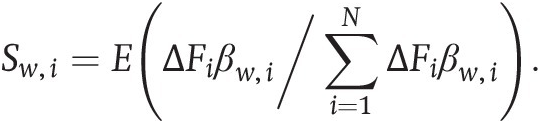
where Sw, i (m s–1) is the flux of water added or subtracted in soil layer i.
Evapotranspiration must be partitioned to root uptake in each soil layer. A common method uses the root profile weighted by a soil wetness factor βw. For soil layer i, a simple wetness factor is
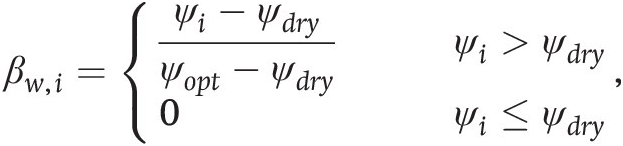 (8.52)
in which ψdry is the matric potential at which transpiration ceases and ψopt is the matric potential at which βw = 1. Some models use volumetric moisture rather than matric potential; the difference relates to the nonlinearity of the θ(ψ) relationship. Total evapotranspiration E is partitioned to an individual soil layer in relation to the relative root fraction ΔFi obtained from (2.23), and
 (8.53)
More complex models of plant hydraulics calculate root uptake from physiological principles (Chapter 13).
Hydraulic redistribution is a process by which roots move water upward and downward in the soil. At night, roots can transport water from wet, deep soil layers to dry, upper soil layers, thereby increasing the supply of water available to near-surface roots. Downward root-mediated transport can also occur from wet, upper layers to dry, lower layers after rainfall. Modeling studies show that hydraulic redistribution helps sustain photosynthesis and transpiration during the dry season (Lee et al. Reference Lee, Oliveira, Dawson and Fung2005; Zheng and Wang Reference Zheng and Wang2007; Baker et al. Reference Baker, Prihodko and Denning2008; Wang Reference Wang2011; Li et al. Reference Li, Wang and Yu2012b; Yan and Dickinson Reference Yan and Dickinson2014). Many models include the water flux from hydraulic redistribution as a source or sink term in the Richards equation based on Ryel et al. (Reference Ryel, Caldwell, Yoder, Or and Leffler2002), though Amenu and Kumar (Reference Amenu and Kumar2008) provided an alternative parameterization. The flux is calculated from the difference in matric potential between two layers using Darcy’s law. At night, the flux of water by hydraulic redistribution from layer j to layer i is
 (8.54)
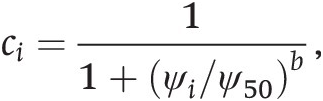
where CRT is a maximum radial soil–root conductance (m MPa–1 s–1) and Δψ is the difference in water potential (MPa) between the uptake and release soil layers. The term ci or cj is a factor that reduces conductance for soil moisture in the source or sink layer and is given by
 (8.55)
in which ψ50 is the matric potential at which conductance is reduced by 50%. Representative parameters are CRT = 0.097 cm MPa–1 h–1, ψ50 = − 1 MPa, and b = 3.22 (Ryel et al. Reference Ryel, Caldwell, Yoder, Or and Leffler2002), as used also in some land surface models (Zheng and Wang Reference Zheng and Wang2007; Wang Reference Wang2011; Li et al. Reference Li, Wang and Yu2012b; Yan and Dickinson Reference Yan and Dickinson2014). The rightmost term in (8.54) accounts for root abundance. The denominator is 1 − ΔFj when θj>θi, but 1 − ΔFi when θi>θj. Models commonly do not allow hydraulic redistribution to the top soil layer. Otherwise, the soil surface is continually wetted, and excessive soil evaporation can occur.
Question 8.10 Write the mixed-form Richards equation (8.13) with a sink term. What are the units of S?
8.9 Soil Heterogeneity
The Richards equation is commonly used in land surface models. It applies to homogenous soil columns in which soil hydraulic properties are horizontally uniform but can vary in the vertical dimension. Spatially homogenous soil columns are applicable for laboratory studies or at small scales, but field soils are, in fact, quite heterogeneous. Several texture classes can co-occur within a small footprint, hydraulic conductivity and specific moisture capacity can differ within a texture class, and the presence of macropores can alter water movement in soils. Soil heterogeneity can be addressed through stochastic methods applied to the Richards equation, such as treating hydraulic conductivity as a random variable (Gelhar Reference Gelhar1986; Milly Reference Milly1988). These methods parameterize spatial heterogeneity statistically rather than explicitly representing the variability. A goal of such parameterizations is to obtain not only the mean water flow and moisture profile, but also the variance. A secondary goal is to obtain effective hydraulic parameters at large scales for which the Richards equation can be used. One approach is to represent soil as independent columns that vary in hydraulic parameters such as Ksat, for which the Richards equation is solved. This characterizes soil heterogeneity by a series of independent, one-dimensional flow problems. The mean soil moisture and its variance are obtained from an ensemble of Monte Carlo simulations in which, for example, Ksat is drawn from a specified probability density function or by numerically integrating the solution over the distribution (Bresler and Dagan Reference Bresler and Dagan1983; Clapp et al. Reference Clapp, Hornberger and Cosby1983; Dagan and Bresler Reference Dagan and Bresler1983). Another method is to solve the Richards equation in a probabilistic treatment to obtain a probability distribution for soil moisture with a mean and variance. This approach formulates the Richards equation as a stochastic partial differential equation with hydraulic conductivity taken as a random variable (Yeh et al. Reference Yeh, Gelhar and Gutjahr1985a,Reference Yeh, Gelhar and Gutjahrb,Reference Yeh, Gelhar and Gutjahrc; Mantoglou and Gelhar Reference Mantoglou and Gelhar1987a,Reference Mantoglou and Gelharb,Reference Mantoglou and Gelharc; Chen et al. Reference Chen, Govindaraju and Kavvas1994). A recent example is Vrettas and Fung (Reference Vrettas and Fung2015), who applied the concept to a local watershed but also suggested its applicability to large-scale land surface models.
8.10 Supplemental Programs
8.1 Predictor–Corrector Solution for the ψ -Based Richards Equation: This program implements the predictor–correction method given by (8.36) and (8.37). Boundary conditions are θ0 and free drainage. The code uses either the Campbell (Reference Campbell1974) or van Genuchten (Reference van Genuchten1980) relationships for θ(ψ) and K(θ). Specific configurations match Haverkamp et al. (Reference Haverkamp, Vauclin, Touma, Wierenga and Vachaud1977) for sand and Yolo light clay as in Figure 8.8 and Figure 8.9. θ(ψ) uses the van Genuchten relationships with θres = 0.075, θsat = 0.287, α = 0.027 cm–1, n = 3.96, and m = 1 (sand); and θres = 0.124, θsat = 0.495, α = 0.026 cm–1, n = 1.43, and m = 0.3 (clay). In Haverkamp et al. (Reference Haverkamp, Vauclin, Touma, Wierenga and Vachaud1977), K = KsatA/(A + |ψ|B) with Ksat = 34 cm h–1, A = 1.175 × 10⁶, and B = 4.74 (sand); and Ksat = 0.0443 cm h–1, A = 124.6, and B = 1.77 (clay).
8.2 Modified Picard Iteration for the Mixed-Form Richards Equation: This program is similar to the previous program but implements the modified Picard iteration (8.45) with Table 8.5. Critical parameters for the solution are the tolerance εa, which is the maximum allowable change in ψ between iterations for convergence. This parameter determines the accuracy of the water balance.
8.11 Modeling Projects
1. Use the ψ-based predictor–corrector method (Supplemental Program 8.1) to calculate the amount of water that infiltrates into a sandy loam. Compare results using the van Genuchten (Reference van Genuchten1980) and Campbell (Reference Campbell1974) relationships for θ(ψ) and K(θ) with parameters from Table 8.3.
2. Repeat the previous problem, but using the modified Picard iteration (Supplemental Program 8.2). How do the results compare with the predictor–corrector method? What can be said about parameter uncertainty versus numerical methods?


