Introduction
Japanese quail are used widely as a model in breeding, physiology, nutrition, pathology, reproduction and immunology research (Huss et al. Reference Huss, Poynter and Lansford2008). Recently, quail rearing for commercial egg and meat production has become popular because of rapid economic returns from commercial quail production (Islam et al. Reference Islam, Faruque, Khatun and Islam2014).
Using shank length as an indirect method of estimating body weight has been reported to be a practical, fast, easy and cheap approach, especially in rural areas where resources are insufficient and expensive, sensitive weighing scales are unaffordable (Semakula et al. Reference Semakula, Lusembo, Kugonza, Mutetikka, Sennyonjo and Mwesigwa2011). Shank length during the growing period is an important indicator of leg development and is known to be moderately to highly heritable, suggesting that it can be improved through artificial individual selection, which has been identified as one of the most effective tools for the genetic improvement of heavier individuals (Oke et al. Reference Oke, Herbert and Nawchukwu2004).
Selection is a powerful means for genetic improvement of quail meat and egg production, which is based on breeding values that significantly improve production traits (Hussain et al. Reference Hussain, Akram, Javed, Ahmad, Mahmud, Mehmood, Ahmad, Ahmad, Jatoi, Abbas and Hussnain2016). Genetic selection has altered some physiological relationships that are critical in optimizing sexual development in terms of age (Alkan et al. Reference Alkan, Karabağ, Galiç, Karsli and Balcioğlu2010). Genetic variations are manifested in variability of tissue composition and metabolic processes among strains, and provide a means of evaluating such physiological developmental changes due to genetic selection (Stewart & Washburn Reference Stewart and Washburn1983). The association between performance traits and plasma constituents could be measured by simple correlations that measure the total association between a pair of characters; however, that association does not exist by itself but involves a complicated interaction pathway (Sharma et al. Reference Sharma, Rana and Mehta1986). The differences in plasma constituents and their correlations with some economic traits are of interest because they indicate which plasma constituents may be useful as genetic markers in breeding programmes (El-Dlebshany et al. Reference El-Dlebshany, El-Tahawy and Amin2009).
The objectives of the present study were to determine the effects of genotype and sex on growth and laying performance in Japanese quail and to assess the variations in plasma metabolic constituents in the tested genotypes and their relationships with productive traits after four generations of selection.
Materials and methods
Three Japanese quail genotypes were established and maintained by the Poultry Research Center, Faculty of Agriculture, Fayoum University, Egypt. To construct a maternal genotype (MG), a selection index was applied to select females according to the aggregate breeding values of age at first egg (AFE) and days needed to produce the first ten eggs (DN10), selected for four successive generations. A second genotype of long shank length at 28 days of age (LSG28) was constructed by individual phenotypic selection, carried out separately for each sex for four generations according to their deviation from the mean of their sexes. A control genotype (CG) was maintained via non-selected pedigreed population, which was a randomly selected genotype and the mating system was completely random. A total number of 1440 Japanese quails (320 females and 160 males for each genotype) were evaluated for growth and egg production traits.
The birds were housed and reared in a litter system for up to 5 weeks of age. Birds were then moved to individual cages in the laying house. All birds were fed ad libitum a balanced starter and grower ration up to the first 6 weeks of age (NRC 1994). A laying diet was provided to the birds until the end of study. The same diets were provided to quails on the whole study across various generations. Farm bio-security and hygiene measures were maintained to prevent outbreak of any disease. All birds were housed in the same room, and management practices were kept as uniform as possible throughout the experimental period.
Data on body weight at 35 days of age (BW35), shank length at 35 days of age (SL35), body weight gain from 1 to 35 days (BWG1to35), shank length gain from 1 to 35 days (SLG1to35), growth rate of body weight from 1 to 35 days (GRBW1to35) and growth rate of shank length from 1 to 35 days (GRSL1to35) were recorded for each bird.
The equations of Brody (Reference Brody1945) were used to calculate BWG1to35 and GRSL1to35 (unitless) as follows:
 $${\rm BWG}_{{\rm 1}\,{\rm to}\,{\rm 35}} {\rm =} \displaystyle{{{\rm BW35}-{\rm BW}0} \over {[0.{\rm 5(BW35} + {\rm BW}0{\rm )}]}}$$
 $${\rm GRSL}_{{\rm 1}\,{\rm to}\,{\rm 35}} {\rm =} \displaystyle{{{\rm SL35}-{\rm SL}0} \over {[0.{\rm 5(SL35} + {\rm SL}0{\rm )}]}}$$
AFE, egg weight (EW14, 20(, egg mass (EM14, 20) and egg production percentage (EP%14, 20 (during the first 14 and 20 weeks of production, fertility (F%), hatchability (H%) and percentage hatchability from fertile eggs (H1%) were recorded individually for each female.
Plasma constituent analyses
Ninety blood samples (10 males and 20 females/genotype) at 35 days of age were taken from the three tested genotypes. The blood samples (3 ml) were drawn from the wing vein of each individual and centrifuged immediately (4500 rpm for 10 min). Plasma samples were cooled and stored at −20 °C until chemical analysis. Plasma biochemical constituents were analysed in the Laboratory of the Animal Production Department, Agriculture and Biological Research Division, National Research Center, Dokki, Giza, Egypt. Samples were thawed and used to analyse: total proteins (TP, g/dl), albumin (Alb, g/dl), cholesterol (Chol, mg/dl), triglycerides (TG, mg/dl) and total lipids (TL, mg/dl) by enzymatic colorimetric tests using commercial kits (CAM TECH MEDICAL LIMITED 54 Little Horton Lane, Bradford, West Yorkshire, UK) following the procedure described by the manufacturers. The globulin (Glob) values were calculated by subtracting the values of Alb from the corresponding values of TP and the Alb/Glob ratio was then calculated using the BCG or Biuret method (Gornall et al. Reference Gornall, Bardawill and David1949; Doumas et al. Reference Doumas, Watson and Biggs1971):
 $${\rm (Total}\,{\rm protein}\,{\rm concentration)} - {\rm (Albumin}\,{\rm concentration)}$$
Statistical analysis
Data were analysed using a fixed model (SAS 2011), and the genotype- and sex-specific means for growth and plasma constituent traits were calculated using the following model:
 $$Y_{ijk} {\rm =} \mu + G_i + S_j + GS_{ij} + e_{ijk} $$
where: Y ijk = the observations for a trait; μ = the overall mean; G i = the fixed effect of ith genotype; S j = the fixed effect of jth sex; GS ij = the interaction of G i and S j ; and e ijk = the random error term.
Data of female egg production-related traits were subjected to a one-way analysis of variance with genotype as a fixed main effect as follows:
 $$Y_{ij} {\rm =} \mu + G_i + e_{ij} $$
where: Y ij = the observations for a trait; μ = the overall mean; G i = the fixed effect of ith genotype and e ij = the random error term. Means were compared for fixed main effects and interactions by Duncan's new multiple range test (Duncan Reference Duncan1955).
Phenotypic correlations between plasma constituents and egg production-related traits for each genotype were estimated according to Becker (Reference Becker1985) as follows:
 $$r_{\rm P} {\rm =} \displaystyle{{{\rm cov}_{\rm p}} \over {\sqrt {\sigma _{{\rm p}(x)}^2 \times {\rm} \sigma _{{\rm p}(y)}^2}}} $$
where: r P = the phenotypic correlation, covp = the total covariance between x and y traits, σ 2 p(x) = the phenotypic variance of the first trait and σ 2 p(y) = the phenotypic variance of the second trait.
Results
Performance of the traits
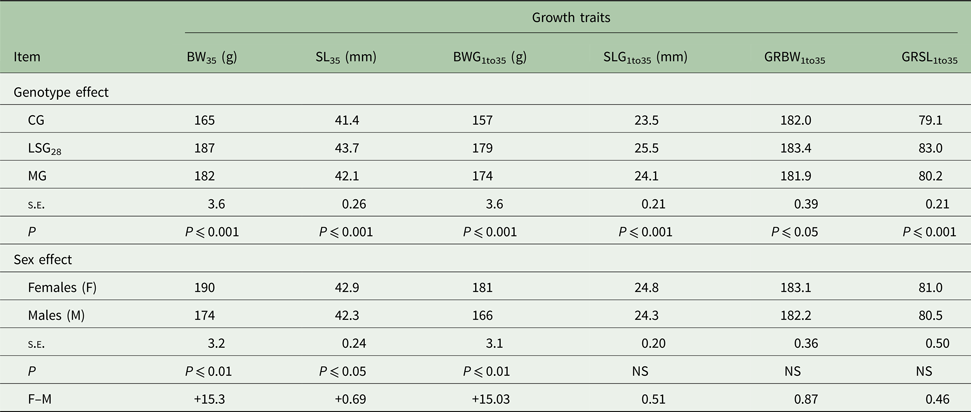
Genotype affected all studied growth traits significantly: either MG or LSG28 genotypes had heavier BW35, longer SL35 and BWG1to35 and SLG 1to35 than the CG. The LSG28 was the fastest in each of SLG1to35, GRBW1to35 and GRSL1to35 as compared with other genotypes. The LSG28 genotype had longer SL35, longer SLG1to35, faster GRBW1to35 and GRSL1to35, respectively, than the MG. Females had greater BW35, SL35 and BWG1to35 than males (Table 1).
Means and their standard errors (s.e.) of growth traits for genotypes and sexes after four generations of selection

CG, control genotype; LSG28, longer shank length genotype; MG, maternal genotype; BW35, body weight at 35 days; SL35, shank length at 35 days; BWG1to35, body weight gain from 1 to 35 days; SLG1to35, shank length gain from 1 to 35 days; GRBW1to35, growth rate body weight from 1 to 35 days; GRSL1to35, growth rate shank length from 1 to 35 days; NS, not significant.
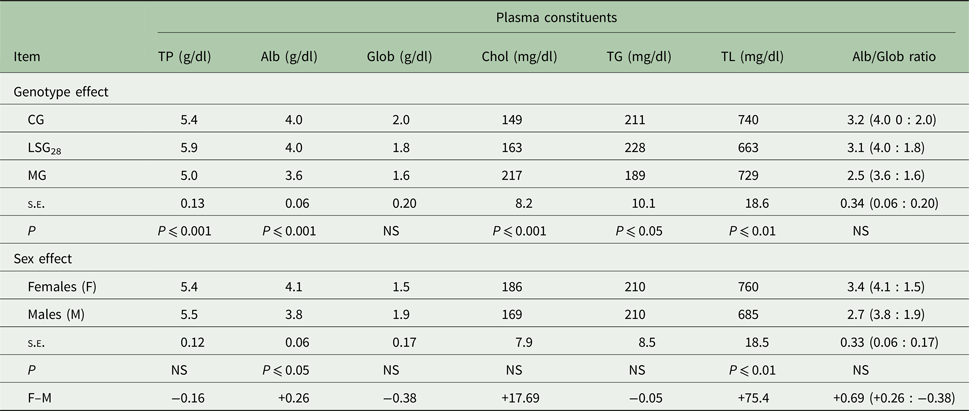
Significant differences due to genotype effect were found for TP, Alb, Chol, TG and TL; however, genotype did not influence each Glob concentration and Alb/Glob ratio. The LSG28 genotype had higher concentrations of TP and TG than other genotypes, whereas the MG had higher Chol than others (Table 2). Females showed significantly higher concentrations of both Alb and TL than males. Selection for longer SL28 favouring the LSG28 genotype in all growth traits was associated with increases in TP, Glob and TG, but decreased Chol and TL compared with other genotypes (Table 2).
Means and their standard errors (s.e.) of plasma constituents for genotypes and sexes after four generations of selection
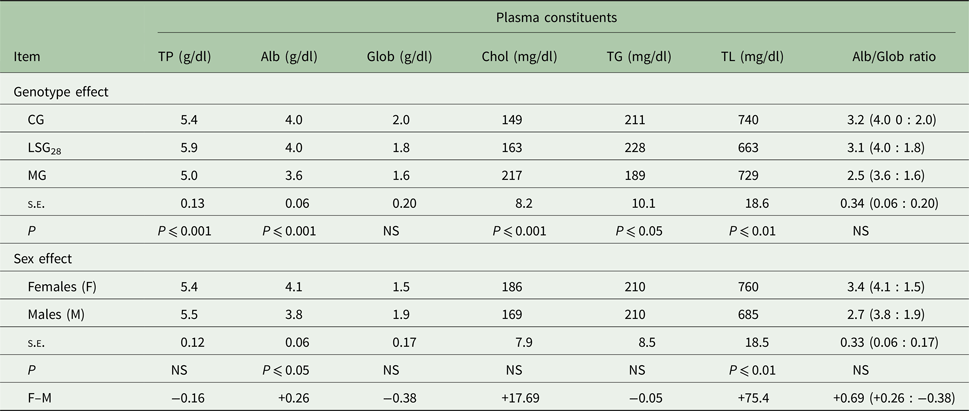
CG, control genotype; LSG28, longer shank length genotype; MG, maternal genotype; TP, total proteins; Alb, albumin; Glob, globulin; Chol, cholesterol; TG, triglycerides; TL, total lipids; Alb/Glob ratio, albumin/globulin ratio; NS, not significant.
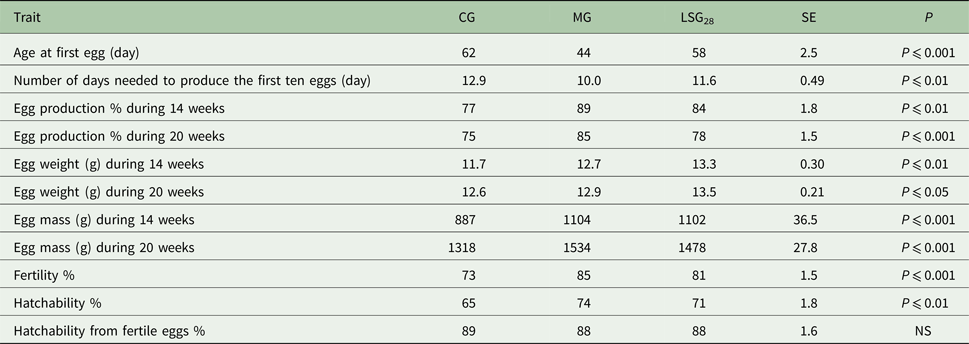
There were significant differences among genotypes for all studied egg production and fitness traits, except percentage hatchability from fertile eggs. Trends of selection changes were towards early maturity, shorter DN10, higher EP% and heavier EM during 14 and 20 weeks of production, favouring the MG which had better performance of these traits than other genotypes. The LSG28 was inferior to the MG, showing later AFE (+14.3 days) and requiring a longer period to produce the first 10 eggs (+1.6 days), as shown in Table 3.
Means and their standard errors (s.e.) of egg production and fitness traits for females after four generations of selection
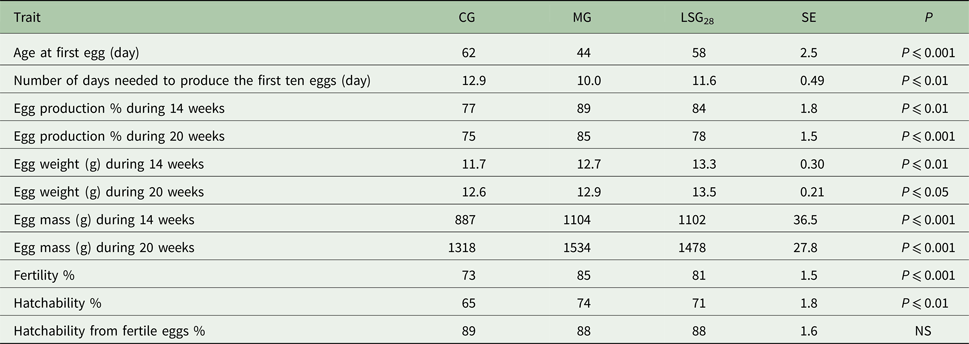
CG, control genotype; LSG28, longer shank length genotype; MG, maternal genotype; NS, not significant.
The LSG28 genotype had heavier EW14 and EW20, whereas MG had heavier EM14 and EM20; however, CG had lighter estimates than the two selected genotypes (Table 3). This was expected, since LSG28 had heavier BW and faster GR than other genotypes, which resulted in heavier EW and lower EM. Selection over four generations indicated that both the selected genotypes (LSG28 and MG) exceeded their CG in each of EW14, EW20, EM14 and EM20.
Regardless of selection criteria, there were significant differences among the tested genotypes for both F% and H%: MG showed higher estimates than the CG. Either F% or H% after four generations were higher for MG, which exceeded LSG28 by +3.63% and +2.95%, so selection may improve both F% and H% in either MG or LSG28 genotypes as compared with the CG (Table 3).
Correlations between plasma constituents and growth traits
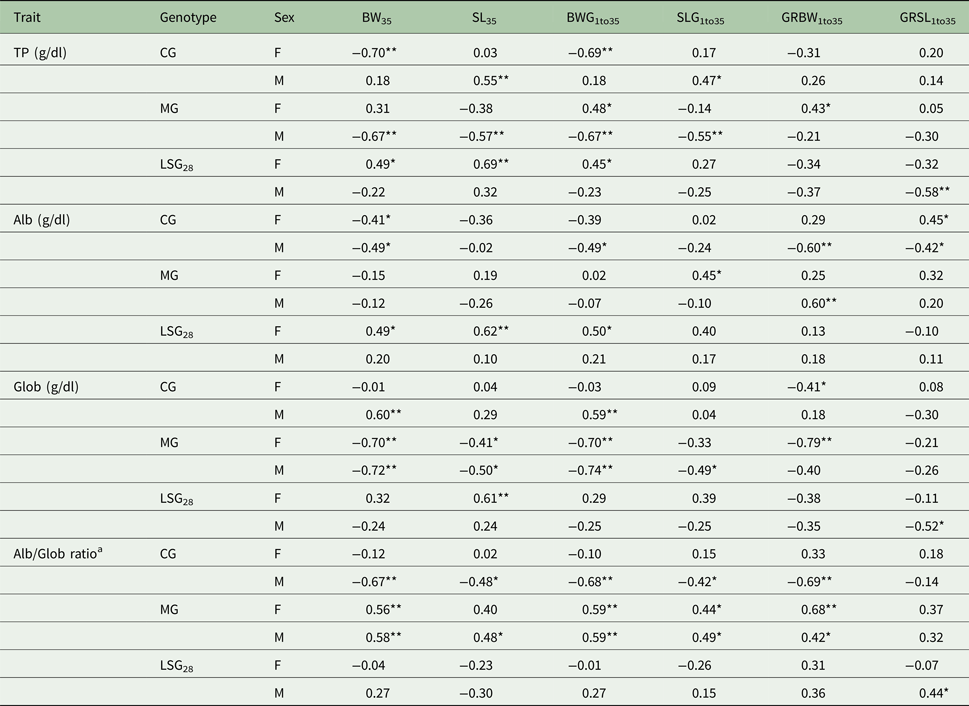
The correlations between plasma constituents and growth traits are presented in Table 4. The increase in TP reduced both BW35 and BWG1to35 of CG females and BW35, SL35, BWG1to35 and SLG1to35 of MG males. However, TP was positively correlated with SL35 and SLG1to35 of CG males, BWG1to35 and GRBW1to35 of MG females and BW35, SL35 and BWG1to35 of LSG28 females (Table 4). The Alb concentration was correlated negatively with both BW35 and GRSL1to35 of CG females. As Alb increased, BW35, BWG1to35, GRBW1to35 and GRSL1to35 of CG males also decreased, whereas in MG females, SLG1to35 increased and so did GRBW1to35 in MG males. The same trends of positive correlations were shown between Alb and BW35, SL35 and BWG1to35 for female LSG28. As Glob concentration increased, BW35 and BWG1to35 increased significantly in CG males, and LSG28 females had longer SL35 (0.59–0.61). Conversely, the increase in Glob led to decreases in GRBW1to35 of CG females, BW35, SL35, BWG1to35 and GRBW1to3 (−0.41 to −0.79) of MG females, BW35, SL35, BWG1to35 and SLG1to35 (−0.49 to −0.74) of MG males and GRSL1to35 (0.52) in LSG28 males. As Alb/Glob ratio increased in males of the CG, BW35, SL35, BWG1to35, SLG1to35 and GRBW1to35 decreased, whereas it increased these traits in both sexes for the MG (0.40–0.68), and also increased GRSL1to35 of LSG28 males to 0.44 (Table 4).
Correlations between plasma total proteins (TP), albumin (Alb), globulin (Glob) and Alb to Glob ratio and growth traits of both sexes

CG, control genotype; LSG28, longer shank length genotype; MG, maternal genotype; M, males; F, females; BW35, body weight at 35 days; SL35, shank length at 35 days; BWG1to35, body weight gain from 1 to 35 days; SLG1to35, shank length gain from 1 to 35 days; GRBW1to35, growth rate body weight from 1 to 35 days; GRSL1to35, growth rate shank length from 1 to 35 days.
*P ⩽ 0.05 and **P ⩽ 0.01.
a Correlation between the Alb/Glob ratio and each growth or egg production trait (results of the correlation metrics).
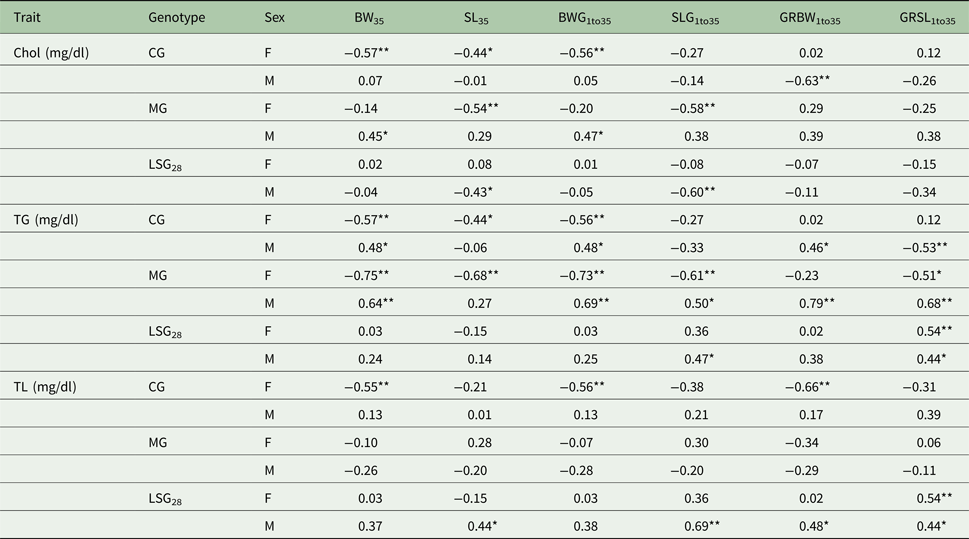
As shown in Table 5, Chol had negative correlations with the female CG BW35, SL35 and BWG1to35, the male CG GRBW1to35, and either female MG or male LSG28, SL35 and SLG1to35. However, as Chol increased, both BW35 and BWG1to35 of MG males increased. The TG was negatively correlated with BW35, SL35 and BWG1to35 of CG females (−0.44 to −0.57), GRSL1to35 of CG males (−0.53), and BW35, SL35, BWG1to35, SLG1to35 and GRSL1to35 of MG females (−0.51to −0.75). On the contrary, the increase in TG resulted in increasing BW35, BWG1to35 and GRBW1to35 (0.46–0.48) of CG males, and BW35, BWG1to35, SLG1to35, GRBW1to35 and GRSL1to35 (0.50–0.79) of MG males, as well as being correlated with GRSL1to35 (0.54) of female LSG28 and both SLG1to35 and GRSL1to35 of male LSG28 (0.44–0.47). The TL was negatively correlated with BW35, BWG1to35 and GRSL1to35 of female CG (−0.55 to −0.66) and positively correlated with SL35, SLG1to35, GRBW1to35 and GRSL1to35 (0.44–0.69) of male LSG28. Similarly, it was correlated with GRSL1to35 of LSG28 females (0.54) as shown in Table 5.
Correlations between plasma cholesterol (Chol), triglycerides (TG) and total lipids (TL) and growth traits of both sexes

CG, control genotype; LSG28, longer shank length genotype; MG, maternal genotype; M, males; F, females; BW35, body weight at 35 days; SL35, shank length at 35 days; BWG 1to35, body weight gain from 1 to 35 days; SLG1to35, shank length gain from 1 to 35 days; GRBW1to35, growth rate body weight from 1 to 35 days; GRSL1to35, growth rate shank length from 1 to 35 days.
*P ⩽ 0.05 and **P ⩽ 0.01.
Correlations between plasma constituents and egg-related traits
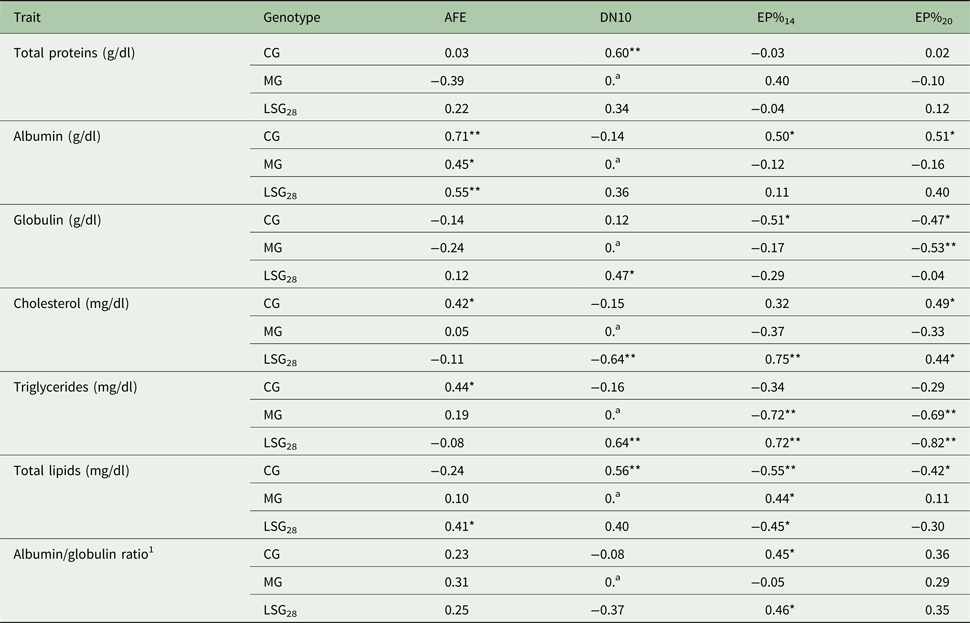
Positive significant correlations with undesirable effects were found between TP and DN10 (0.60) in the CG, and Alb with AFE (0.45–0.71) for the three tested genotypes. The increase in plasma Chol resulted in later AFE in the CG (0.42) but desirably shorter DN10 (−0.64) for the LSG28 (Table 6). However, increases in the TG concentration led to delays in AFE in the CG (0.44). Similarly, the increase in TL resulted in longer DN10 in the CG (0.56), and later AFE (0.41) in the LSG28. The Alb had positive significant correlations with EP%14 and EP%20 in the CG (0.50 and 0.51, respectively), while Glob correlated negatively with EP%14 and EP%20 in the CG, and EP%20 in the MG (Table 6). Increases in plasma Chol and TG resulted in increasing EP%14 (0.75 and 0.72, respectively) in the LSG28 but lowered EP%14 (−0.72) for the MG. The increase in TG resulted in decreasing EP%20 in both selected genotypes, ranging from −0.69 to −0.82. A positive correlation was found between TL concentration and EP%14 of the MG, while TL correlated negatively with both EP%14 and EP%20 of the CG and LSG28 (−0.42 to −0.55). The Alb/Glob ratio correlated positively with EP%14 in the CG and LSG28 genotypes (Table 6).
Correlations between plasma constituents and egg production-related traits

CG, control genotype; LSG28, longer shank length genotype; MG, maternal genotype; AFE, age at first egg; DN10, number of days needed to produce the first 10 eggs; EP%14 to 20, egg production percent during 14 and 20 weeks of production.
*P ⩽ 0.05 and **P ⩽ 0.01.
aCannot be computed because at least one of the variables is constant.
1Correlation between the albumin/globulin ratio and each growth or egg production trait (results of the correlation metrics).
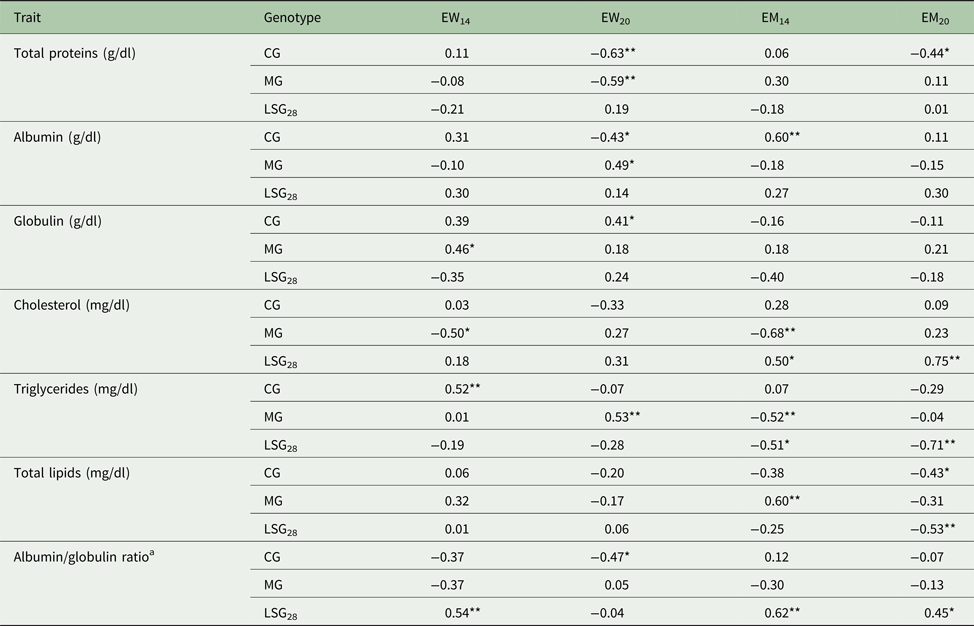
The increase in TP led to the production of lighter EW20 and EM20 (−0.63 and −0.44, respectively) in the CG and EW20 of the MG (−0.59) as shown in Table 7. The same trend of negative correlation was shown between Alb concentration and EW20 (−0.43) in the CG. Conversely, as Alb increased, EW20 of the MG and EM14 of the CG also increased (0.49 and 0.60, respectively). Positive correlations were seen between Glob concentration and both EW20 in the CG and EW14 in the MG (0.40 and 0.46, respectively). The increase in Chol concentration led to reductions in EW14 and EM14 (−0.50 and −0.68, respectively) of the MG, but increased EM14 and EM20 (0.50 and 0.75, respectively) of the LSG28. As TG increased, heavier EW14 of the CG and EW20 of the MG were seen (0.52–0.53), whereas EM14 in both selected genotypes and EM20 for LSG28 were decreased. A positive correlation was found between TL concentration and EM14 of the MG (0.60), while it correlated negatively with EM20 of the CG and LSG28 (−0.43 and −0.53, respectively). As Alb/Glob ratio increased, heavier EW14, EM14 and EM20 of the LSG28 were obtained, whereas EW20 in the CG decreased (Table 7).
Correlations between plasma constituents with egg weight and mass traits

CG, control genotype; LSG28, longer shank length genotype; MG, maternal genotype; EW14to20, egg weight (gram) during 14 and 20 weeks of production; EM14to20, egg mass (gram) during 14 and 20 weeks of production.
*P ⩽ 0.05 and **P ⩽ 0.01.
a Correlation between the albumin/globulin ratio and each growth or egg production trait (results of the correlation metrics).
Discussion
Performance of the traits
The current investigation aimed to determine the effects of genotype and sex on growth and laying performance of Japanese quail and to assess the variations in plasma constituents in the tested genotypes and their relationships with productive traits. Genotype affected all growth traits significantly. The two selected genotypes had heavier BW, longer SL, BWG and SLG than the CG. The LSG28 genotype was the fastest for SLG, GRBW and GRSL as compared with other genotypes. Significant effect of genotype on BW in Japanese quail is also in agreement with previous reports (Islam et al. Reference Islam, Faruque, Khatun and Islam2014; Hussain et al. Reference Hussain, Akram, Javed, Ahmad, Mahmud, Mehmood, Ahmad, Ahmad, Jatoi, Abbas and Hussnain2016) and SL (Grunder et al. Reference Grunder, Lefkovitch, Chambers and Gavora1983; Dikmen & Ipek Reference Dikmen and Ipek2006). The significant effects of sex are in agreement with the results of Alkan et al. (Reference Alkan, Karabağ, Galiç, Karsli and Balcioğlu2010) and Kosshak et al. (Reference Kosshak, Dim, Momoh and Gambo2014) for BW and Ojo et al. (Reference Ojo, Fayeye, Ayorinde and Olojede2014) for SL. The results of the present study, indicating variation in TP and Chol levels between male and female quails, are in line with the findings of Grunder et al. (Reference Grunder, Lefkovitch, Chambers and Gavora1983), Malarmathi et al. (Reference Malarmathi, Gupta, Prakash, Gnana and Reddy2009), Jatoi et al. (Reference Jatoi, Sahota, Akram, Javed, Hussain, Mehmood and Jaspal2013) and Mohammad (Reference Mohammad2016). This could be due to depression in Chol during egg production as Chol shifts from the blood to the ovary for egg formation, which seems to be a metabolic phenomenon for meeting continued serum Chol demand to replenish losses during egg formation (Mady et al. Reference Mady, El Kassas and El Atriby1990). Genotype differences in TG, Chol and Alb in quails have also been reported by Grunder et al. (Reference Grunder, Lefkovitch, Chambers and Gavora1983) and Rezvannejad (Reference Rezvannejad2014). In the present study, plasma TP concentrations in different quail genotypes were found to range between 5.04 to 5.89 mg/dl, which is similar to the values recorded by Malarmathi et al. (Reference Malarmathi, Gupta, Prakash, Gnana and Reddy2009) in the black strain of Japanese quails. Selection for longer SL28, favouring the LSG28 genotype in all growth traits studied, was associated with increases in TP, Glob and TG but decreases in Chol and TL compared with other genotypes. Sex significantly affected TP, Alb, Glob and TL, favouring females in Japanese quail (Mady et al. Reference Mady, El Kassas and El Atriby1990; Shata Reference Shata2001). However, adult black feather males had higher concentrations of Chol than females (Mohammad Reference Mohammad2016). Trends of selection changes were towards early maturity, shorter DN10, higher EP% and heavier EM during 14 and 20 weeks of production, favouring the MG as an egg genotype, which had better performance for these traits than other genotypes. Similar trends were reported by Sakunthala et al. (Reference Sakunthala, Ramesh, Gnana, Qudratullah and Rajasekhar2010), Islam et al. (Reference Islam, Faruque, Khatun and Islam2014) and Rezvannejad (Reference Rezvannejad2014), i.e. that egg production differed significantly for the different types and genotypes of quail. However, a lower value of 90 days for egg production for low, medium and high body weight groups was reported by Bahie El-Deen et al. (Reference Bahie El-Deen, Kosba and Soliman2009). The results for AFE in Japanese quail reported by Saidu et al. (Reference Saidu, Afanasyev, Popova, Komarchev, Ibrahim, Rahman and Ahmadi2014) are in agreement with the current study, and similar results were also reported for DN10 (Emam Reference Emam2015). The LSG28 genotype had heavier EW14 and EW20 where the MG had heavier EM14 and EM20. This was expected, since LSG28 had heavier BW and faster GR than other genotypes, which resulted in heavier EW and lower EM. Nestor et al. (Reference Nestor, Bacon, Anthony and Noble1996) stated that genetic factors that increase body weight were associated with increased EW and EM. Selection over four generations indicated that both the selected genotypes exceeded their CG in EW14, EW20, EM14 and EM20. The present findings are mostly in agreement with Alkan et al. (Reference Alkan, Karsli, Karabağ and Galiç2013), Saidu et al. (Reference Saidu, Afanasyev, Popova, Komarchev, Ibrahim, Rahman and Ahmadi2014), Jatoi et al. (Reference Jatoi, Sahota, Akram, Javed, Jaspal, Mehmood, Hussain, Ishaq and Bughio2015) and Hussain et al. (Reference Hussain, Akram, Javed, Ahmad, Mahmud, Mehmood, Ahmad, Ahmad, Jatoi, Abbas and Hussnain2016), who reported that EW and EM differed significantly for different types, strains and lines of quail. The results of EW agreed with those of several authors who found significant effects of genotype, favouring the selected genotype for EW in Japanese quail (Alkan et al. Reference Alkan, Karabağ, Galiç, Karsli and Balcioğlu2010, Reference Alkan, Karsli, Karabağ and Galiç2013; Emam Reference Emam2015). Selection for productive traits could affect reproductive traits and might affect H% directly, as one of the most important attributes of parent stock performance. These results are similar to the findings of Sadeghi et al. (Reference Sadeghi, Pakdel, Shahrbabak and Shahrbabak2013) and Islam et al. (Reference Islam, Faruque, Khatun and Islam2014), who reported that varieties of quail had significant effect on H% performance. However, Dikmen & Ipek (Reference Dikmen and Ipek2006) observed no differences in F% or H% among different genotypes. It can be concluded that the LSG28 seemed to be a growth genotype, since it was characterized by higher growth traits resulting from selection for longer SL28 with the corresponding heavier EW than other genotypes. The MG, however, was considered as an egg layer type which had earlier AFE and lower estimates of DN10 than other genotypes due to selection for AFE and DN10.
Correlations between plasma constituents and both growth- and egg-related traits
The correlations between plasma constituents and some productive traits are important because they indicate which plasma measurements may be useful as genetic markers in breeding programmes. Little or no information is available of the relationship between haematological parameters and productive traits of Japanese quail. To determine if there was some association between plasma and production traits, the phenotypic correlations were estimated between the two traits for males, considering their growth performance, or females, considering growth- and egg-related production traits. The current results revealed that the correlations between plasma constituents and all traits depend on genotype and sex. In the current study, positive significant phenotypic correlations were found between TP at 6 weeks with growth traits in the CG females and MG males. Bahie El-Deen et al. (Reference Bahie El-Deen, Kosba and Soliman2010) found significant phenotypic correlation between TP at 6 weeks with BW. The increase in Chol led to a decrease in female CG BW35, SL35 and BWG1to35, male CG GRSL1to35 and either female MG or male LSG28 SL35 and SLG1to35. However, as Chol increased, both BW35 and BWG1to35 of male MG increased. Similarly, Bahie El-Deen et al. (Reference Bahie El-Deen, Kosba and Soliman2010) reported that there was a significant phenotypic correlation between Chol at 6 weeks with BW at the same age.
Positive significant correlations with undesirable effects were found between TP and DN10 in the CG and Alb with AFE for the three tested genotypes. The increase in plasma Chol undesirably resulted in later AFE in the CG but desirably shorter DN10 for the LSG28. However, the TG concentration increase led to undesirable lateness in AFE in the CG. Similarly, the increase in TL resulted in longer DN10 in the CG and later AFE in the LSG28. The increase in plasma Chol and TG desirably resulted in increasing EP%14 in the LSG28 but undesirably lowered EP%14 for the MG. The increase in TG resulted in the decrease of EP%20 in both selected genotypes. Bahie El-Deen et al. (Reference Bahie El-Deen, Kosba and Soliman2010) reported non-significant low rp estimates between TP at 42 days of age with EW and EM at 90 days of age, but phenotypic correlation with AFE. They also reported negative and low phenotypic correlation between Chol at 42 days of age with AFE, EW and EM at 90 days of age. Hassan (Reference Hassan2010) reported that EP% positively and significantly correlated with TP, Alb, TL, TG and Chol.
On the other hand, there were no significant correlations between plasma constituents and EW in the tested genotypes. Hassan (Reference Hassan2010) also reported that no significant phenotypic correlations were found between EW and plasma constituents.
Significant correlations may be more likely between the egg-related and plasma traits. The low or insignificant values of correlations in the data may have been caused by, for example, small sample sizes, the fact that only one plasma sample per bird was obtained, etc. Therefore, these results should not discourage further exploration of these relationships. The mean values of the plasma traits established in the current study may be useful reference data for future explorations. The present results suggested that short-term selection can be applied successfully without harmful effects on production performance. The findings showed high correlation estimates between plasma metabolites and some performance traits, which deserve more attention for continuing research and can be exploited in planning breeding programmes for Japanese quail for producing a suitable meat or egg-type quail genotype and improve quail reproductive qualities. The results of the present work indicate that body weight as a parameter for selection has positive and significant relationships with some blood parameters in Japanese quail and that these parameters are influenced by genotype and sex.