Since the 1950s, the literature on the determinants of democratization has been dominated by the so-called modernization hypothesis, essentially the claim that higher per capita income leads to more democracy (Lipset Reference Lipset1959). Acemoglu et al. (Reference Acemoglu, Johnson, Robinson and Yared2008, Reference Acemoglu, Johnson, Robinson and Yared2009) have recently demonstrated that empirical support for the modernization hypothesis is not robust to the addition of country fixed effects. As an alternative they have asserted the importance of ‘critical junctures’ in influencing democratization:
[I]n our theory, democratizations occur because of the transitory nature of de facto political power. In some situations, the collective-action problem is easier to solve, opponents of the regime are easier to coordinate, and revolutions are easier and less costly to carry out. These are typically times of crises—for example, harvest failures, economic depressions, international financial or debt crises, and even wars. Such crises and macroeconomic shocks are intrinsically transitory and lead to fluctuations in de facto political power. Our theory therefore predicts that democratizations are more likely to arise in a situation of economic or political crisis (Acemoglu and Robinson Reference Acemoglu and Robinson2006, 31–2).
A recent article by Brückner and Ciccone (Reference Brückner and Ciccone2011) appears to offer strong support for the view that economic crises significantly influence democratization. Controlling for country fixed effects, they find a statistically significant link between adverse lagged country-level rainfall shocks, negative economic growth shocks and subsequent democratization in Sub-Saharan Africa in recent decades. Brückner and Ciccone examine the reduced-form relationship between lagged rainfall levels and subsequent changes in democracy, as well as the link between GDP levels and subsequent changes in democracy using rainfall levels as instruments for GDP.
We show that the Brückner and Ciccone (Reference Brückner and Ciccone2011) result does not survive several basic robustness checks and conclude that it does not offer compelling support for the ‘critical junctures’ view of democratization. Our analytical approach is deliberately minimalist: we stick as closely as possible to Brückner and Ciccone's econometric strategy. The basis for all analysis is the replication dataset and computer statistical program (namely, a STATA do-file) provided by Brückner and Ciccone on the Econometrica website. We then extend their analysis in three natural ways.Footnote 1
First, we simply check the robustness of their results (which are based on Polity data) to different measures of democracy. The first of these was developed by Przeworski et al. (Reference Przeworski, Alvarez, Cheibub and Limongi2000) and later updated by some of Przeworski's co-authors (Cheibub, Gandhi and Vreeland Reference Cheibub, Gandhi and Vreeland2010). This robustness check is especially important since Polity is a subjective measure of democracy, and some scholars of democracy have long been concerned that exclusively relying on subjective measures of democracy may result in capturing perceptions of democracy rather than the phenomenon itself. The Przeworksi et al. measure is based on behavior and is thus less subjective; a country is coded as a democracy only if there has been a turnover in government following an election. Since Brückner and Ciccone's dependent variable is change in democracy, we convert Przeworski et al.'s binary measure into a change measure (which can take on values of +1, 0 or −1).
Second, it is important to check whether the results based on one subjective perception of democracy (Polity) are robust to using another subjective perception of democracy. We do this by conducting additional robustness checks with the political rights index developed by Freedom House (2007). This widely used dataset aims to measure how freely people participate in the political process, including the rights to vote freely, run for office, join political parties and organizations, and elect representatives (Freedom House 2010).
A third reason to subject Polity to a robustness check relates to recently expressed concerns about whether it correctly captures the length of spells of authoritarian rule (Geddes, Wright and Frantz Reference Geddes, Wright and Frantz2012, 19). Barbara Geddes and her colleagues offer the most systematic examination of autocratic government (Geddes, Wright and Frantz Reference Geddes, Wright and Frantz2012). Her procedures for data collection – which are arguably more objective than Polity's – find autocratic spells that are very similar in length to those in the Przeworski et al. dataset, and are significantly different from those in the Polity dataset (Geddes, Wright and Frantz Reference Geddes, Wright and Frantz2012, 19).Footnote 2 Our third democracy robustness check thus employs the Geddes, Wright and Frantz dataset. Like for the Przeworski et al. measure, we convert a binary measure into a measure that can take a positive, negative or zero value.Footnote 3
In addition to robustness checks using alternative democracy measures, we correct an omission in Brückner and Ciccone's analysis: their failure to include contemporaneous economic and rainfall shocks as explanatory variables. The structure of their IV regressions, in the notation of their article, is one in which the change in democracy between years t and t + 1 is regressed on predicted GDP in period t − 1. The notation of their article and their do-file differ, but are equivalent. In the STATA do-file, the only instrumented variable is the second lag (t − 2) of GDP, while the dependent variable is democracy in period t minus democracy in period t − 1.Footnote 4 We employ this latter do-file notation in our text and tables below. The key point to note is that contemporaneous GDP values are not included in the second stage of their IV regressions. In other words, GDP in both period t and t − 1 are omitted variables, even though influential recent theory—including Acemoglu and Robinson (Reference Acemoglu and Robinson2006, Reference Acemoglu and Robinson2008) and Chassang and Padro-i-Miquel (Reference Chassang and Padro-i-Miquel2009)—suggests that these contemporaneous variables are the most likely determinants of sudden political change. Even if GDP in period t − 2 is particularly influential, there is no theoretical justification (to our knowledge) for excluding contemporaneous GDP shocks from the analysis. At best one may argue that GDP in period t should be excluded because some of the income is potentially incurred after the democratic change occurred (in an annual-level dataset). However, there is no compelling reason to exclude GDP from period t − 1.
As a final set of robustness checks, we use the updated versions of Brückner and Ciccone's GDP, rainfall and Polity datasets, and extend the analysis to the most recent period possible (in some specifications) to gauge the robustness of their results to the most complete and corrected data.
As we detail below, each of these three sets of robustness checks causes the main findings in Brückner and Ciccone (Reference Brückner and Ciccone2011) to lose statistical significance at traditional confidence levels, suggesting that their main empirical results are rather fragile and calling into question the conclusion that their work provides rigorous support for the role of economic shocks in driving democratization in Africa. We discuss further implications of our findings for the large and growing interdisciplinary literature on the causes of democratization in the conclusion.
EMPIRICAL RESULTS
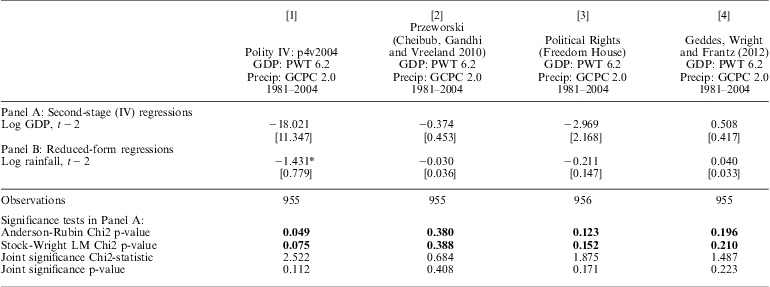
In Table 1, Column 1 we replicate Brückner and Ciccone's core instrumental variables result using the Polity2 dataset (their Table V, Column 1). To support their claim of statistical significance in their instrumental variables specifications, they rely exclusively on a single weak instruments robust significance test. The resulting p-value is robust in the sense that the standard errors are corrected to take into account the extent to which the instruments are weak. Brückner and Ciccone exclusively report the results offered by the Anderson-Rubin chi-squared test. We additionally report the results from another valid test, the Stock-Wright Lagrange Multiplier chi square test (which is also provided in the STATA output but not reported by Brückner and Ciccone)Footnote 5. Both procedures test the joint significance of the endogenous variables.Footnote 6
Rainfall, GDP and Different Measures of Democracy

(1) Column 1 is the original Brückner and Ciccone specification.
(2) The dependent variable in Column 2 is the change in Przeworski's democracy indicator from Cheibub, Gandhi and Vreeland (2010). In levels, a value of 1 indicates a democratic regime and 0 otherwise.
(3) The dependent variable in Column 3 is the Political Rights index from Freedom House, taken from the dataset published online by Brückner and Ciccone.
(4) The dependent variable in Column 4 is the change in the Geddes, Wright and Franz (2012) democracy indicator. In levels, a value of 1 indicates a democratic regime, and a value of 0 an autocracy.
(5) All regressions include country fixed effects, country time trends and common time effects.
(6) Robust standard errors (clustered at the country level) in brackets.
(7) The joint significance p-value and Chi2-statistic refer to tests that do not account for weak instruments.
(8) ***p < 0.01, **p < 0.05, *p < 0.1, based on p-values that do not account for weak instruments.
(9) Anderson-Rubin and Stock-Wright p-values (in bolded text) are robust to weak instruments.
The rationale for reporting both tests is that there is no consensus in the econometrics literature about which of these two tests is most appropriate (Andrews and Stock Reference Andrews and Stock2005). In large samples the choice should not matter, because the tests are asymptotically equivalent. A complete picture of the robustness of the results thus requires reporting the results of both tests. For comprehensiveness we also report the traditional p-values (that is, p-values that do not account for weak instruments). In the following pages we will show that these tests coincide in that the null hypothesis of no effect cannot be rejected at conventional levels of confidenceFootnote 7.
Column 1 shows that with Polity2, the 5 percent level of significance is achieved with the Anderson-Rubin chi-squared test, while a 10 percent level of significance is achieved with Stock-Wright. The reduced-form estimate in Panel B is also significant at 10 percent. The change in significance from Brückner and Ciccone's reduced-form result—which they report to be statistically significant at 5 percent—is a result of our use of the correct reg command in STATA for a standard ordinary least square (OLS) regression, as opposed to their use of ivreg2; we discuss this issue further below. We now subject these results to changes in the measure of democracy.
In Column 2, we show the results using the Przeworski et al. measure of democracy (Cheibub, Gandhi and Vreeland Reference Cheibub, Gandhi and Vreeland2010). Unlike with the Polity data, the main instrumental variables estimates are no longer statistically significant. The same pattern is apparent in Column 3, where we present the results using the political rights index developed by Freedom House.Footnote 8 The same is true with the Geddes, Wright and Frantz measure (Column 4). It is apparent that Brückner and Ciccone's central result is not robust to alternative definitions of democracy. The marginal statistical significance (at the 10 percent level) of the reduced-form estimate also vanishes when using alternative definitions of democracy. We examine the results with these other measures in greater detail in subsequent tables.
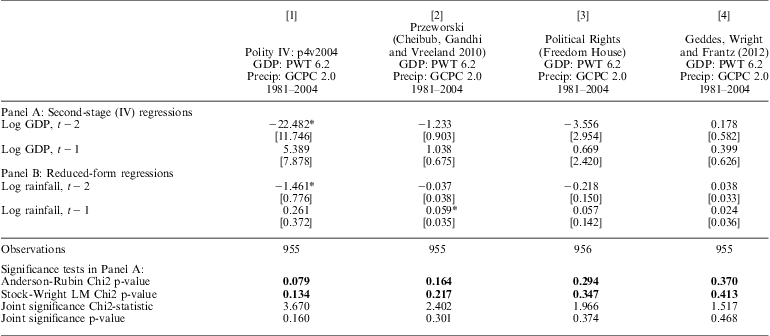
As described above, an important implication of recent theoretical work is that contemporaneous shocks are key drivers of democratic change (Acemoglu and Robinson Reference Acemoglu and Robinson2006, Reference Acemoglu and Robinson2008; Chassang and Padro-i-Miquel Reference Chassang and Padro-i-Miquel2009), so including them is necessary for valid inference. In Table 2 we add contemporaneous shocks as explanatory variables to the specifications displayed in Table 1, which are omitted variables in Brückner and Ciccone's main specification. The table displays the effects of adding rainfall and GDP in t − 1. The results here, as elsewhere, are no better if GDP and rainfall in period t are also added (not shown). As may be observed in Table 2, none of the main coefficient estimates is negative and statistically significant at 95 percent confidence for any of the democracy measures. Brückner and Ciccone's Table 3, Column 1 reports a regression that seems to be equivalent to our Table 2 Panel B, Column 1. The point estimates of the coefficients are the same, but the p-values differ (0.043 in Brückner and Ciccone, 0.067 in this article). According to their online replication materials (the STATA do-file and dataset from the Econometrica website), the result reported in Brückner and Ciccone's article is obtained using the ivreg2 command with no excluded instruments. In Panel B of Table 2 we present the reduced-form output generated by STATA (which can also be obtained by running OLS regressions with the standard reg command). The documentation materials on the ivreg2 command state that Brückner and Ciccone's procedure should render the same results as OLS, but this does not appear to hold in practice. We consider the reduced-form results from a standard OLS regression to be more reliable than the results from an IV regression (ivreg2) run with no instruments, and thus report the OLS results throughout this article.
Sensitivity of Brückner and Ciccone Results to the Inclusion of Contemporaneous Shocks
(1) The dependent variable in Column 1 is the change in Polity IV index.
(2) The dependent variable in Column 2 is the change in Przeworski's democracy indicator from Cheibub, Gandhi and Vreeland (2010). In levels, a value of 1 indicates a democratic regime and 0 otherwise.
(3) The dependent variable in Column 3 is the change in the Political Rights index from Freedom House, taken from the dataset published online by Brückner and Ciccone.
(4) The dependent variable in Column 4 is the change in the Geddes, Wright and Franz (2012) democracy indicator. In levels, a value of 1 indicates a democratic regime, and a value of 0 an autocracy.
(5) All regressions include country fixed effects, country time trends and common time effects.
(6) Robust standard errors (clustered at the country level) in brackets.
(7) The joint significance p-value and Chi2-statistic refer to tests that do not account for weak instruments.
(8) ***p < 0.01, **p < 0.05, *p < 0.1, based on p-values that do not account for weak instruments.
(9) Anderson-Rubin and Stock-Wright p-values (in bolded text) are robust to weak instruments.
Dependent Variable: Change in Polity2 Index
(1) Column 1 is the original Brückner and Ciccone specification.
(2) All regressions include country fixed effects, country time trends and common time effects.
(3) Robust standard errors (clustered at the country level) in brackets.
(4) The joint significance p-value and Chi2-statistic refer to tests that do not account for weak instruments.
(5) ***p < 0.01, **p < 0.05, *p < 0.1, based on p-values that do not account for weak instruments.
(6) Anderson-Rubin and Stock-Wright p-values (in bolded text) are robust to weak instruments.
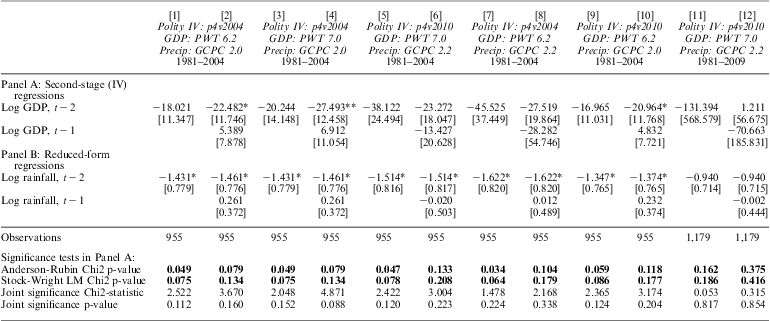
We now conduct various additional robustness checks involving the use of updated measures of the Penn World Tables GDP (PWT 7.0)Footnote 9, Rainfall GPCP (version 2.2) and Polity (version p4v2010) datasets. In Table 3, we focus exclusively on robustness checks without bringing in the non-Polity democracy measures. Columns 1–10 use the same time period as Brückner and Ciccone, while the last two columns show results when the sample is extended to 2009. In Column 1 we begin with Brückner and Ciccone's original specification and then add GDP and rainfall in t − 1 in Column 2. (These are the same specifications as Table 1 Column 1, and Table 2 Column 1). In Columns 3 and 4 we present results with the latest GDP dataset, keeping the Polity and rainfall datasets unchanged. In Columns 5 and 6 we use the latest the versions of the Polity, GDP and rainfall datasets. In Columns 7 and 8 we use the latest version of the rainfall dataset with the old versions of the other datasets. In Columns 9 and 10 we use the latest version of the Polity dataset with old versions of the other two datasets. Finally, in Columns 11 and 12 we extend the data to 2009 while using the latest versions of all the datasets.
While with the use of the Polity data the main coefficient estimates are occasionally statistically significant at traditional levels and the reduced form is significant at the 10 percent level in Columns 1 through 10, the most noteworthy findings are contained in Columns 6, 11 and 12. Column 6 shows that even with the Polity data, use of the latest versions of all the datasets means that none of the IV measures are statistically significant when GDP at t − 1 is included as an explanatory variable. Columns 11 and 12 show that neither the main coefficient estimates nor the reduced form coefficients is statistically significant when the data is extended to 2009.Footnote 10
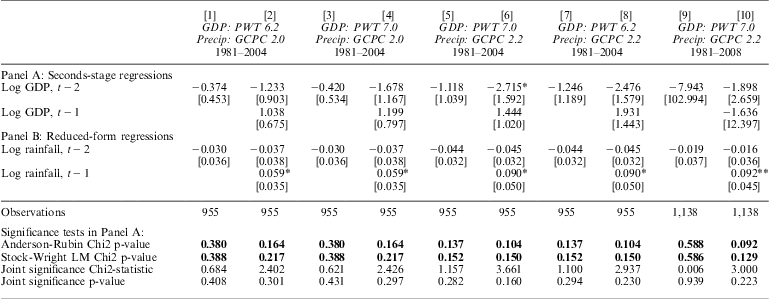
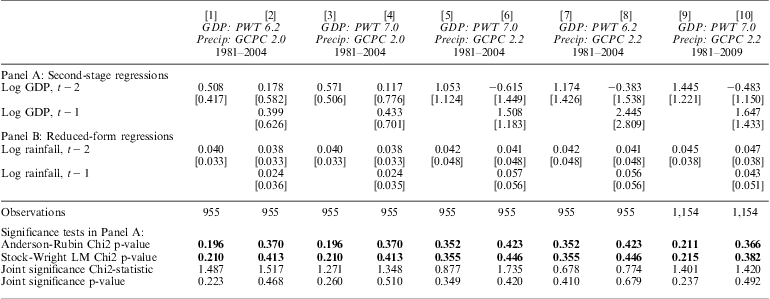
We now apply the same robustness checks with respect to updated GDP and rainfall datasets while using other democracy measures. Table 4 uses the Przeworski et al. measure; none of the coefficient estimates is negative and significant at 95 percent confidence, either according to the traditional p-values or the weak instrument tests. The Brückner and Ciccone results are also not robust with the previous version of the Przeworski et al. data (not shown).
Dependent Variable: Change between Democracy and Dictatorship (Przeworski et al. Measure, from Reference Cheibub, Gandhi and VreelandCheibub et al. 2010)
(1) Change in Przeworski democracy indicator from Cheibub, Gandhi and Vreeland (2010). In levels, a value of 1 indicates a democratic regime and 0 otherwise.
(2) All regressions include country fixed effects, country time trends and common time effects.
(3) Robust standard errors (clustered at the country level) in brackets.
(4) The joint significance p-value and Chi2-statistic refer to tests that do not account for weak instruments.
(5) ***p < 0.01, **p < 0.05, *p < 0.1, based on p-values that do not account for weak instruments.
(6) Anderson-Rubin and Stock-Wright p-values (in bolded text) are robust to weak instruments.
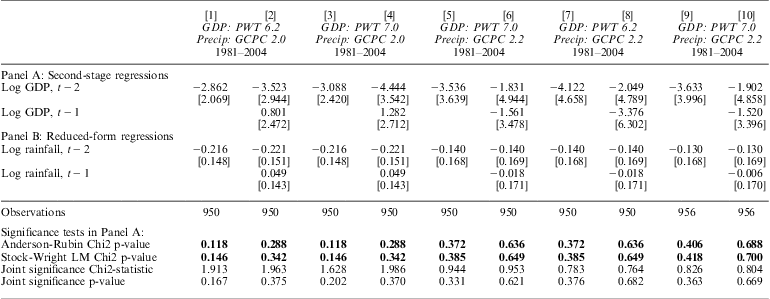
Table 5 reports the results using the change in political rights index developed by Freedom House as the dependent variable. This table is of particular interest because in their online appendix Table IX Column 2, Brückner and Ciccone appear to show a successful robustness check for their main IV specification using this data. Note that in the notation of Brückner and Ciccone's article, the dependent variable is the change in democracy between t and t + 1, while the core explanatory variable in the instrumental variables regression is GDP in period t − 1. (This is equivalent to our notation as per their do-file, in which we examine democracy change between t − 1 and t and use rainfall in t − 2 as the main explanatory variable). In their core instrumental variables regression with Polity2, Brückner and Ciccone use only GDP in t − 1 (in the notation of their article) as their independent variable. However in the robustness check that they report with Freedom House (in their supplementary appendix), they unaccountably switch to only using GDP in period t − 2 (in the notation in their article). In the equivalent language of the do-file and our article (where the left-hand side is change in democracy from t − 1 to t), they switch from using only GDP in t − 2 for the core Polity IV regression to only using GDP in t − 3 for the Freedom House robustness check. This, of course, does not make for a true robustness check of the core specification; we conduct such a test here.
Change in Political Rights Index (Freedom House 2007)
(1) Change in Freedom House Political Rights Index (2007).
(2) All regressions include country fixed effects, country time trends and common time effects.
(3) Columns 1 through 8 are restricted to observations from the original Brückner and Ciccone sample with valid data for the political rights index. Columns 9 and 10 include all observations with valid data.
(4) Robust standard errors (clustered at the country level) in brackets.
(5) The joint significance p-value and Chi2-statistic refer to tests that do not account for weak instruments.
(6) ***p < 0.01, **p < 0.05, *p < 0.1, based on p-values that do not account for weak instruments.
(7) Anderson-Rubin and Stock-Wright p-values (in bolded text) are robust to weak instruments.
When GDP in t − 2 (in the notation of the do-file and our article) is the independent variable, to be consistent with the core Brückner and Ciccone Polity2 specification, the coefficient estimate is no longer statistically significant at the 95 percent confidence level. In Column 3 of Tables 1 and 2, we already saw the non-robustness of Brückner and Ciccone's core results for GDP in t − 2 to Freedom House data using the sample in Brückner and Ciccone's supplementary appendix (n = 956). Columns 1–8 of Table 5 show results dropping the six observations that are offered by Freedom House, but not by the core Polity2 measure.Footnote 11 The structure of the first eight columns is the same as in the previous table, with different permutations of datasets. The last two columns present results with the latest versions of datasets with the full range of observations offered by Freedom House. As shown in the table, neither the main coefficients nor the reduced-form estimates is statistically significant.Footnote 12
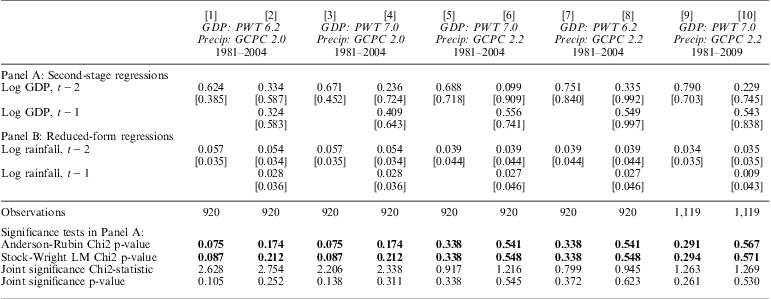
Finally, we address the results using the Geddes, Wright and Frantz (Reference Geddes, Wright and Frantz2012) dataset. Since this dataset is missing 35 country-year observations that we used in the previously presented regressions, we present these results in two ways. First, in Table 6 we present results in which we fill in the missing observations with scores from the Przeworski et al. measure. This is justified by the fact that the specific problem of the potentially inaccurate length of autocratic spells, which motivated this robustness check in the first place, does not appear to be an issue for the Przeworksi et al. measure, as mentioned earlier. However, for assurance that the results are not driven by this imputation, we also present results using only the observations in the Geddes, Wright and Frantz data (in Appendix Table 2). In both of these tables, a score of 1 on the democratic change measure indicates a change from an autocratic to a democratic regime. Once again, there is no evidence in favor of Brückner and Ciccone's core empirical result: neither Table 6 nor Appendix Table 2 has any main coefficient estimates that are statistically significant at 95 percent confidence. We draw special attention to Columns 5 and 6 of Appendix Table 2, which use the latest versions of all datasets.
Change between Democracy and Autocracy (Geddes, Wright and Frantz 2012)
(1) Change in democracy indicator from Geddes, Wright and Franz (2012). In levels, a value of 1 indicates a democratic regime and 0 otherwise.
(2) All regressions include country fixed effects, country time trends and common time effects.
(3) Columns 1 through 8 are restricted to observations from the original Brückner and Ciccone sample with valid democracy data. Columns 9 and 10 include all observations with valid data and expand the analysis to 2009.
(4) Robust standard errors (clustered at the country level) in brackets.
(5) The joint significance p-value and Chi2-statistic refer to tests that do not account for weak instruments.
(6) ***p < 0.01, **p < 0.05, *p < 0.1, based on p-values that do not account for weak instruments.
(7) Anderson-Rubin and Stock-Wright p-values (in bolded text) are robust to weak instruments.
CONCLUSION
In light of the above findings, we argue that Brückner and Ciccone's well-known claim—that adverse rainfall shocks provided a democratic ‘window of opportunity’ in Africa—appears to be premature. Their empirical results do not stand up to several basic robustness checks that we view as essential for scientific credibility. With a slight change in the data used, or in the econometric specification—including the theoretically justified inclusion of contemporaneous income shocks—we can no longer reject the null hypothesis of no impact on democratic change. None of this is to say that economic, weather or other shocks have no effect on democratization (in Africa or elsewhere), but rather that Brückner and Ciccone's analysis does not offer convincing support for the claim.
We hope that our analysis will ultimately contribute to the emerging empirical literature that tests theories of democratization by clearly delineating what we do and do not know, and by clarifying the questions that need to be more rigorously answered to make progress in this important and growing interdisciplinary research area. Moreover, given that there are multiple logical and potentially valid ways of capturing democracy, this article highlights the importance of not placing too much weight on empirical results that hinge exclusively on a single measure of democracy.
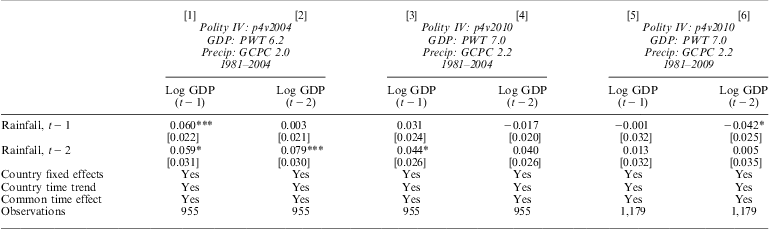
Analysis that Illustrates the First Stage Results in Brückner and Ciccone (2011)
Change between Democracy and Autocracy without Imputation (Geddes, Wright and Frantz 2012)