



1. Introduction
Large-scale vortices are frequently encountered in the atmosphere of the earth and other planets such as Jupiter and Saturn; they also appear as coherent structures such as Gulf Stream rings and meddies in the oceans (Thorpe Reference Thorpe2005). The long life of the Great Red Spot on Jupiter is one of the long-standing mysteries studied by a number of researchers. These large-scale vortices in the atmosphere and the oceans sometimes form a system of vortices such as a vortex pair and an array of vortices. For example, an array of counter-rotating vortices resembling a von Kármán vortex street is often observed in the wake of an isolated island (Etling Reference Etling1989; Potylitsin & Peltier Reference Potylitsin and Peltier1998). On Jupiter, anti-cyclones and cyclones formed a von Kármán vortex street for approximately 50 years (Youssef & Marcus Reference Youssef and Marcus2003). These arrays of vortices can be generated by instabilities of a jet flow and a shear flow (the Kelvin–Helmholtz instability), the baroclinic instability and other mechanisms.
The instability of the vortices on the atmosphere and the oceans is one of their most fundamental properties required for understanding their dynamics and fate. For example, most of the eddies appearing on the surface of the ocean are cyclonic, while sub-surface eddies can be anti-cyclonic (Thorpe Reference Thorpe2005); the von Kármán vortex street in the wake of an isolated island sometimes becomes asymmetric with anti-cyclonic vortices being nearly destroyed (Potylitsin & Peltier Reference Potylitsin and Peltier1998; Stegner, Pichon & Beunier Reference Stegner, Pichon and Beunier2005). The preference in the sense of rotation of the vortices is most likely caused by rotation of the system and stratification, which strongly affect the motion of the vortices in the atmosphere and the oceans. In our previous work (Hattori et al. Reference Hattori, Suzuki, Hirota and Khandelwal2021), the linear stability of a periodic array of vortices in non-rotating stratified fluids has been investigated in detail. The effects of rotation are studied in the present work.
Vortices in rotating stratified fluids are subject to several types of instability. The elliptic instability occurs when the streamlines near the centre of a vortex are elliptical (Miyazaki & Fukumoto Reference Miyazaki and Fukumoto1992; Leweke & Williamson Reference Leweke and Williamson1998; Miyazaki & Adachi Reference Miyazaki and Adachi1998; Leblanc & Cambon Reference Leblanc and Cambon1998; Otheguy, Billant & Chomaz Reference Otheguy, Billant and Chomaz2006a; Aspden & Vanneste Reference Aspden and Vanneste2009; Guimbard et al. Reference Guimbard, Le Dizès, Le Bars, Le Gal and Leblanc2010). The centrifugal instability appears depending on the vorticity distribution and the rate of rotation of the system (Leblanc & Cambon Reference Leblanc and Cambon1998; Potylitsin & Peltier Reference Potylitsin and Peltier1998, Reference Potylitsin and Peltier1999). The hyperbolic instability can occur near the hyperbolic stagnation points (Friedlander & Vishik Reference Friedlander and Vishik1991; Lifschitz & Hameiri Reference Lifschitz and Hameiri1991; Sipp & Jacquin Reference Sipp and Jacquin1998; Pralits, Giannetti & Brandt Reference Pralits, Giannetti and Brandt2013; Suzuki, Hirota & Hattori Reference Suzuki, Hirota and Hattori2018; Singh & Mathur Reference Singh and Mathur2019); in a two-dimensional incompressible flow, the stream function is approximated as  $\varPsi (x,y)=a x^2 + bxy + cy^2$ at a stagnation point
 $(x,y)=(0,0)$; it is called a hyperbolic stagnation point when
 $b^2-4ac>0$, while it is an elliptic stagnation point when
 $b^2-4ac<0$ (figure 1). The hyperbolic instability occurs in the absence of stratification (pure hyperbolic instability), while stratification changes the resonance condition for it and the characteristics (strato-hyperbolic instability). It is particularly important for an array of vortices because the flow always possesses hyperbolic stagnation points. The zigzag instability (Billant & Chomaz Reference Billant and Chomaz2000a,Reference Billant and Chomazb,Reference Billant and Chomazc; Otheguy, Billant & Chomaz Reference Otheguy, Billant and Chomaz2006b; Deloncle, Billant & Chomaz Reference Deloncle, Billant and Chomaz2008; Waite & Smolarkiewicz Reference Waite and Smolarkiewicz2008; Billant Reference Billant2000; Billant et al. Reference Billant, Deloncle, Chomaz and Otheguy2010), the radiative instability (Le Dizès & Billant Reference Le Dizès and Billant2009) and the transient growth (Arratia, Caulfield & Chomaz Reference Arratia, Caulfield and Chomaz2013; Gau & Hattori Reference Gau and Hattori2014) also occur in general.
Steamlines near (a) a hyperbolic stagnation point, (b) an elliptic stagnation point.

How rotation and/or stratification affect the above instabilities has been studied in several previous papers. Miyazaki & Fukumoto (Reference Miyazaki and Fukumoto1992) studied the linear stability of an unbounded elliptical flow in stratified fluids, while Miyazaki (Reference Miyazaki1993) extended the analysis including rotation effects. This problem was also studied by Leblanc (Reference Leblanc2003), who obtained explicit conditions for the elliptic instability by local stability analysis. The inviscid waves on a Lamb–Oseen vortex in a rotating stratified fluid were studied by Le Dizès (Reference Le Dizès2008); the condition for the elliptic instability in the presence of strain was discussed, although no result for the growth rate was shown. Guimbard et al. (Reference Guimbard, Le Dizès, Le Bars, Le Gal and Leblanc2010) investigated the effects of stratification on the elliptic instability in a rotating cylinder not only by experiments but also by theoretical analysis. The instability condition and the growth rate were shown to converge to those obtained by Leblanc (Reference Leblanc2003) in the short-wave limit. The centrifugal instability has been studied extensively since the discovery of the Rayleigh criterion (Rayleigh Reference Rayleigh1917); a criterion for rotating fluids has been derived by Kloosterziel & van Heijst (Reference Kloosterziel and van Heijst1991). Leblanc & Cambon (Reference Leblanc and Cambon1998) investigated the linear stability of the Stuart vortices in rotating non-stratified fluids by modal stability analysis; the centrifugal, elliptic and pure hyperbolic instabilities were found. Sipp, Lauga & Jacquin (Reference Sipp, Lauga and Jacquin1999) studied the linear stability of the two-dimensional (2-D) Taylor–Green vortices in rotating non-stratified fluids by local and modal stability analysis; they also found the three instabilities reported by Leblanc & Cambon (Reference Leblanc and Cambon1998). Leblanc & Godeferd (Reference Leblanc and Godeferd1999) showed the structures of the pure-hyperbolic-instability modes in the 2-D Taylor–Green vortices by direct numerical simulation (DNS). Potylitsin & Peltier (Reference Potylitsin and Peltier1998) investigated the stability of periodic vortices in rotating stratified fluids by modal stability analysis; the base flow is a quasi-steady state obtained by relaxation at low Reynolds numbers. According to them, anti-cyclonic vortices are strongly destabilized by weak rotation but stabilized by strong rotation; they also claimed that strong stratification stabilizes the vortices. These results were obtained from numerical analysis with limited resolution (the number of modes in one direction is  $N_t=37$, which is much smaller than
 $500$ in the present work) at low Reynolds numbers (
 ${{Re}}=300$). Potylitsin & Peltier (Reference Potylitsin and Peltier1999) investigated the stability of the Stuart vortices in rotating non-stratified fluids by modal stability analysis. Three types of instability were found: the elliptic, the centrifugal and the (pure) hyperbolic instabilities. Deloncle, Billant & Chomaz (Reference Deloncle, Billant and Chomaz2011) investigated the stability of vortex arrays including the von Kármán vortex street in a stratified and rotating fluid assuming that the core size of the vortices is much smaller than the distance between the vortices; the zigzag instability and the 2-D pairing instability were shown to be dominant for the ‘well-separated’ vortices.
Although several important aspects of the instabilities of arrays of vortices in stratified and/or rotating fluids have been elucidated, our understanding is still far from complete; there are only two papers on the arrays of vortices in rotating stratified fluids (Potylitsin & Peltier Reference Potylitsin and Peltier1998; Deloncle et al. Reference Deloncle, Billant and Chomaz2011). In particular, it is difficult to predict which instability is dominant for a given flow because the problem depends on multiple key parameters: the rotation rate of the system, the strength of stratification and the vorticity distribution, which is partially characterized by the strain rates at the stagnation points and the maximum vorticity. Moreover, the vertical scale is much smaller than the horizontal scale of the vortices in the atmosphere and the oceans; strong stratification also makes the characteristic length scale in the vertical direction small (Billant & Chomaz Reference Billant and Chomaz2001). This implies that stability properties in a wide range of wavenumbers should be explored because the vertical wavenumber is often bounded from below because of geometric constraint. The results obtained so far are limited to either low numerical resolution, low Reynolds numbers or a narrow range of parameter values. Thus, the stability properties of arrays of vortices in rotating stratified fluids should be further explored for a wide range of parameter values with higher resolution from a unified point of view.
In this paper, we study the linear stability of arrays of vortices in rotating stratified fluids. We clarify the condition for each instability and how the growth rate and other characteristics of the instability depend on rotation and stratification. First, we use the local stability analysis in the limit of infinite Reynolds number and large wavenumber since it is a powerful tool for parametric study; we also emphasize that it also provides physical insight into the instabilities, which is not always found by modal stability analysis. Next, the stability properties at finite Reynolds numbers and wavenumbers are obtained by modal stability analysis, where the types of modes are identified with the help of local stability results. We also show the existence of a global mode corresponding to the instability found by Sipp et al. (Reference Sipp, Lauga and Jacquin1999) and Godeferd, Cambon & Leblanc (Reference Godeferd, Cambon and Leblanc2001) only by local stability analysis. We choose the 2-D Taylor–Green vortices as a base flow. There are several reasons for this choice: first, it is one of the few exact solutions of periodic arrays of vortices in rotating stratified fluids; second, it possesses both hyperbolic and elliptic stagnation points, which are important ingredients of arrays of vortices; third, it has been studied in previous work as a typical example of periodic arrays of vortices; and, as mentioned above, the effects of rotation on the stability of the 2-D Taylor–Green vortices have been studied by Sipp et al. (Reference Sipp, Lauga and Jacquin1999) and those of stratification have been studied in our previous work (Suzuki et al. Reference Suzuki, Hirota and Hattori2018; Hattori et al. Reference Hattori, Suzuki, Hirota and Khandelwal2021). However, these two effects have not been considered simultaneously. The present work contributes to understanding the stability of vortices in rotating stratified fluids.
This paper is organized as follows. In § 2, the problem is formulated. In § 3, the instability condition and an estimate for the growth rate based on the local stability analysis are summarized; this section also includes the mechanism of the instability reported by Sipp et al. (Reference Sipp, Lauga and Jacquin1999) and Godeferd et al. (Reference Godeferd, Cambon and Leblanc2001), which is named as the rotational-hyperbolic instability, and an extended analysis of the elliptic instability. The methods of the numerical stability analysis are explained in § 4. The results on the 2-D Taylor–Green vortices are presented in § 5. We conclude in § 6.
2. Problem formulation
2.1. Governing equations
We consider the linear stability of a periodic array of vortices to three-dimensional disturbances in stably stratified and rotating fluids. The effects of density stratification are taken into account by the Boussinesq approximation. Viscosity is taken into account, while diffusion of density is neglected since its effects are negligible (Hattori et al. Reference Hattori, Suzuki, Hirota and Khandelwal2021). The governing equations are
 $$\begin{gather} \boldsymbol{\nabla}\boldsymbol{\cdot}\boldsymbol{u}=0, \end{gather}$$
 $$\begin{gather}\frac{\partial{\boldsymbol{u}}}{\partial t}+\boldsymbol{u}\boldsymbol{\cdot}\boldsymbol{\nabla}\boldsymbol{u} + 2\varOmega_0 \boldsymbol{e}_z \times \boldsymbol{u} =-\frac{1}{\rho_0} \boldsymbol{\nabla}{p}-g\frac{\rho}{\rho_0}\boldsymbol{e}_z+\nu \Delta \boldsymbol{u}, \end{gather}$$
 $$\begin{gather}\frac{\partial{\rho}}{\partial{t}}+\boldsymbol{u}\boldsymbol{\cdot}\boldsymbol{\nabla}{\rho} =0, \end{gather}$$
where  $\boldsymbol {u}$,
 $p$ and
 $\rho$ are the velocity, pressure and density fields, respectively,
 $\varOmega _0$ is the angular velocity,
 $\rho _0$ is a constant reference density,
 $g$ is the acceleration of gravity and
 $\nu$ is the kinematic viscosity. We consider high-Reynolds-number flows throughout the paper; in the local stability analysis, we neglect viscous diffusion, while the Reynolds number is set to
 ${{Re}}=10^5$ in the modal stability analysis.
We consider a 2-D base flow. The vorticity equation for 2-D flows in a rotating frame under the Boussinesq approximation reads
 \begin{equation} {\dfrac{\partial {\omega_z}}{\partial {t}}} + {\dfrac{\partial {\varPsi}}{\partial {y}}}{\dfrac{\partial {(\omega_z + 2\varOmega_0)}}{\partial {x}}} - {\dfrac{\partial {\varPsi}}{\partial {x}}}{\dfrac{\partial {(\omega_z + 2\varOmega_0)}}{\partial {y}}} = \nu \Delta \omega_z, \end{equation}
where  $\varPsi =-\Delta ^{-1}\omega _z$ is the stream function of the base flow. Since
 $\varOmega _0$ is constant, any 2-D flow that satisfies
 \begin{equation} {\dfrac{\partial {\varPsi}}{\partial {y}}}{\dfrac{\partial {\omega_z}}{\partial {x}}} - {\dfrac{\partial {\varPsi}}{\partial {x}}}{\dfrac{\partial {\omega_z}}{\partial {y}}} = 0 \end{equation}
is steady in the absence of viscous diffusion. Equation (2.5) is the well-known condition for 2-D steady inviscid flows without rotation and stratification. In other words, rotation and stratification do not affect the condition for steadiness under the Boussinesq approximation and uniform rotation.
The base flow is assumed steady not only in local stability analysis but also in modal stability analysis because the growth of instabilities is much faster than the time evolution of the base flow due to viscous diffusion at  ${{Re}}=10^5$. The velocity, pressure and density fields are decomposed as
 $$\begin{gather} \boldsymbol{u}=\boldsymbol{u}_b+\boldsymbol{u}', \end{gather}$$
 $$\begin{gather}p=p_b+p', \end{gather}$$
 $$\begin{gather}\rho=\rho_{0}+{\alpha}z+\rho', \end{gather}$$
where  $(\boldsymbol {u}_b, p_b, \rho _b)$ and
 $(\boldsymbol {u}', p', \rho ')=(u'_x, u'_y, u'_z, p', \rho ')$ are the base flow and the disturbance, the direction of the gravity force is taken as
 $-\boldsymbol {e}_z$ and the base density is assumed to be
 $\rho _b=\rho _0+\alpha z$ with
 $\alpha ={\partial \rho _b}/{\partial z}<0$ being a constant. The magnitude of the disturbance is infinitesimally small. Then the governing equations of the disturbance in non-dimensionalized form are
 $$\begin{gather} \boldsymbol{\nabla}\boldsymbol{\cdot}\boldsymbol{u}'=0, \end{gather}$$
 $$\begin{gather}\frac{\partial{\boldsymbol{u}'}}{\partial t}+(\boldsymbol{u}'\boldsymbol{\cdot}\boldsymbol{\nabla})\boldsymbol{u}_b+(\boldsymbol{u}_b\boldsymbol{\cdot}\boldsymbol{\nabla})\boldsymbol{u}' + \frac{1}{Ro} \boldsymbol{e}_z \times \boldsymbol{u}' =-\boldsymbol{\nabla}{p'}-\rho'\boldsymbol{e}_z+\frac{1}{{{Re}}}\nabla^2 \boldsymbol{u}', \end{gather}$$
 $$\begin{gather}\frac{\partial{\rho'}}{\partial{t}}+(\boldsymbol{u}_b\boldsymbol{\cdot}\boldsymbol{\nabla}){\rho'}-\frac{1}{F_h^2}u'_z =0, \end{gather}$$
where  $Ro =U_0/(2 \varOmega _0 L_0)$ is the Rossby number,
 ${{Re}} =U_0L_0/\nu$ is the Reynolds number,
 $F_h=U_0/(L_0N)$ is the Froude number based on the horizontal scale,
 $N=\sqrt {-{\alpha }g/{\rho }_0}$ is the Brunt–Väisälä frequency, and
 $U_0$ and
 $L_0$ are a characteristic velocity and a length scale, respectively; see § 4 for the actual choice of
 $U_0$ and
 $L_0$. In the following, the values are scaled by
 $U_0$ and
 $L_0$ unless stated explicitly.
In the local stability analysis, the disturbance is assumed to be in the form of a wave packet with short wavelength:
 $$\begin{gather} \boldsymbol{u}'=\left(\boldsymbol{\hat{u}}_0+\delta\boldsymbol{\hat{u}}_1+\cdots \right)\exp\left(\frac{{\rm i}}{\delta}\varPhi\right), \end{gather}$$
 $$\begin{gather}p'=\left(\hat{p}_0+\delta\hat{p}_1+\cdots \right)\exp\left(\frac{{\rm i}}{\delta}\varPhi\right), \end{gather}$$
 $$\begin{gather}\rho'=\left(\hat{\rho}_0+\delta\hat{\rho}_1+\cdots \right)\exp\left(\frac{{\rm i}}{\delta}\varPhi\right), \end{gather}$$
where  $\delta$ is a small parameter proportional to the wavelength and
 $\varPhi$ is eikonal which is assumed to satisfy
 $D\varPhi /Dt=0$ (
 $D/Dt=\partial /\partial t+ \boldsymbol {u}_b \boldsymbol {\cdot } \boldsymbol {\nabla }$). Viscosity is neglected in the local stability analysis. Substituting the above expressions into (2.9)–(2.11) yields a set of ordinary differential equations at the leading order:
 $$\begin{gather} {\dfrac{{\rm{d}} {{\boldsymbol{X}}}}{{\rm{d}} {t}}} = {\boldsymbol{U}}({\boldsymbol{X}}), \end{gather}$$
 $$\begin{gather}{\dfrac{{\rm{d}} {{\boldsymbol{k}}}}{{\rm{d}} {t}}} =-{\boldsymbol{\mathsf{L}}}^{\rm T} {\boldsymbol{k}}, \end{gather}$$
 $$\begin{gather}{\dfrac{{\rm{d}} {{\boldsymbol{a}}}}{{\rm{d}} {t}}} = ( 2{\hat{\boldsymbol{k}}}{\hat{\boldsymbol{k}}}^{\rm T} - {\boldsymbol{\mathsf{I}}} ) {\boldsymbol{\mathsf{L}}}{\boldsymbol{a}} +({\hat{\boldsymbol{k}}}{\hat{\boldsymbol{k}}}^{\rm T}-{\boldsymbol{\mathsf{I}}})r\boldsymbol{e}_z + \frac{1}{Ro} ( {\hat{\boldsymbol{k}}}{\hat{\boldsymbol{k}}}^{\rm T} - {\boldsymbol{\mathsf{I}}} ) {\boldsymbol{e}_z} \times {\boldsymbol{a}}, \end{gather}$$
 $$\begin{gather}\frac{{\rm d}r}{{\rm d}t}= \frac{1}{F_h^2}a_z, \end{gather}$$
where  $\boldsymbol{\mathsf{L}}_{ij} = {\partial U_i}/{\partial x_j}$ and
 $\hat {\boldsymbol {k}}=\boldsymbol {k}/|{\boldsymbol {k}}|$ (Friedlander & Vishik Reference Friedlander and Vishik1991; Lifschitz & Hameiri Reference Lifschitz and Hameiri1991; Leblanc Reference Leblanc1997). Here,
 ${\boldsymbol {X}}$ is the position of the fluid particle and
 $\boldsymbol {k}=\boldsymbol {\nabla }\varPhi$ is the local wavevector, while
 ${\boldsymbol {a}}=\boldsymbol {\hat {u}}_0$ and
 $r=\hat {\rho }_0$ are the amplitudes of the disturbance corresponding to velocity and density, respectively. The incompressibility condition in (2.9) leads to
 ${\boldsymbol {a}} \boldsymbol {\cdot } {\boldsymbol {k}} = 0$, which is satisfied for
 $t>0$ if it holds at
 $t=0$. The base flow is unstable if the amplitude
 $\{{\boldsymbol {a}}, r\}$ grows without bound.
2.2. Useful equations and approximations
Before showing the condition for each instability and the estimate of the growth rate, useful equations and approximations are presented. We are left with four (2.17) and (2.18) after solving (2.15) and (2.16). The incompressibility condition  ${\boldsymbol {a}} \boldsymbol {\cdot } {\boldsymbol {k}} = 0$ implies that the actual degree of freedom is three; it is further reduced to two using conservation of potential vorticity (Aspden & Vanneste Reference Aspden and Vanneste2009; Suzuki et al. Reference Suzuki, Hirota and Hattori2018).
First, we introduce
 \begin{equation} p = \frac{k}{|\boldsymbol{k}_\perp|} {\boldsymbol{k}}_\perp \boldsymbol{\cdot} {\boldsymbol{a}}_\perp = -\frac{kk_z}{|\boldsymbol{k}_\perp|}a_z, \quad q = \left(\frac{k}{|\boldsymbol{k}_\perp|} {\boldsymbol{k}}_\perp{\times} {\boldsymbol{a}}_\perp\right)\boldsymbol{\cdot}{\boldsymbol{e}}_z, \quad s = \frac{k}{|\boldsymbol{k}_\perp|}r \end{equation}
as done by Bayly, Holm & Lifschitz (Reference Bayly, Holm and Lifschitz1996), where  $\boldsymbol {k}_\perp =(k_x, k_y)^{\rm T}$ and
 $\boldsymbol {a}_\perp =(a_x, a_y)^{\rm T}$ are the horizontal projections of
 $\boldsymbol {k}$ and
 $\boldsymbol {a}$, respectively. Then, (2.17) and (2.18) reduce to
 \begin{equation} \frac{{\rm d}}{{\rm
d}t}\left( \begin{array}{@{}c@{}}p\\q\\s\end{array}\right) =
\left( \begin{array}{@{}ccc@{}} \dfrac{{\rm d}}{{\rm
d}t}\log{\dfrac{|\boldsymbol{k}_\perp|}{|\boldsymbol{k}|}}
& \dfrac{2k^2_z\boldsymbol{\mathsf{H}}\boldsymbol{k}_\perp\boldsymbol{\cdot}\boldsymbol{k}_\perp}{|\boldsymbol{k}|^2|\boldsymbol{k}_\perp|^2}
+\dfrac{k_z^2}{Ro k^2} &
\dfrac{|\boldsymbol{k}_\perp|^2}{|\boldsymbol{k}|^2}k_z\\
-\omega_z-{{{Ro}}^{-1}} & -\dfrac{{\rm d}}{{\rm
d}t}\log{\dfrac{|\boldsymbol{k}_\perp|}{|\boldsymbol{k}|}}
& 0\\ -\dfrac{1}{F_h^2 k_z} & 0 & -\dfrac{{\rm d}}{{\rm
d}t}\log{\dfrac{|\boldsymbol{k}_\perp|}{|\boldsymbol{k}|}}\\
\end{array}\right) \left( \begin{array}{@{}c@{}}
p\\q\\s\end{array}\right),
\end{equation}
where
 \begin{equation} {\boldsymbol{\mathsf{L}}} = \left( \begin{array}{@{}cc@{}} {\boldsymbol{\mathsf{L}}}_\perp & 0 \\ 0 & 0 \end{array} \right), \quad \boldsymbol{\mathsf{H}} = \boldsymbol{\mathsf{L}}_\perp \left( \begin{array}{@{}cc@{}} 0 & 1 \\ -1 & 0 \end{array} \right). \end{equation}
By eliminating  $p$ from the equations for
 $p$ and
 $q$, we have
 \begin{equation} {\dfrac{{\rm{d}}^2 {q}}{{\rm{d}} {t}^2}} = U_q q + D_s s, \end{equation}
where
 $$\begin{gather} U_q = \left(\frac{{\rm d}}{{\rm d}t}\log{\frac{|\boldsymbol{k}_\perp|}{|\boldsymbol{k}|}}\right)^2 - \frac{{\rm d}^2}{{\rm d}t^2}\log{\frac{|\boldsymbol{k}_\perp|}{|\boldsymbol{k}|}} - \left(\frac{2k^2_z\boldsymbol{\mathsf{H}}\boldsymbol{k}_\perp\boldsymbol{\cdot}\boldsymbol{k}_\perp}{|\boldsymbol{k}|^2|\boldsymbol{k}_\perp|^2} +\frac{k_z^2}{Ro k^2}\right)(\omega_z+{{{Ro}}^{-1}} ), \end{gather}$$
 $$\begin{gather}D_s=-\frac{|\boldsymbol{k}_\perp|^2}{|\boldsymbol{k}|^2}k_z (\omega_z+{{{Ro}}^{-1}} ). \end{gather}$$
We can also eliminate  $p$ from the equations for
 $q$ and
 $s$, which leads to
 \begin{equation} {\dfrac{{\rm{d}} {q}}{{\rm{d}} {t}}} -F_h^2(\omega_z+{{{Ro}}^{-1}})k_z {\dfrac{{\rm{d}} {s}}{{\rm{d}} {t}}} =-\left(\frac{{\rm d}}{{\rm d}t}\log{\frac{|\boldsymbol{k}_\perp|}{|\boldsymbol{k}|}}\right) (q - F_h^2(\omega_z+{{{Ro}}^{-1}})k_z s). \end{equation}
Since  $\omega _z$ and
 $k_z$ are constant along a streamline, we have
 \begin{equation} {\dfrac{{\rm{d}} {}}{{\rm{d}} {t}}} \left[\left(\frac{|\boldsymbol{k}_\perp|}{|\boldsymbol{k}|}\right) (q - F_h^2(\omega_z+{{{Ro}}^{-1}})k_z s)\right] = 0 \end{equation}
or
 \begin{equation} q - F_h^2(\omega_z+{{{Ro}}^{-1}})k_z s = C_{pv}\frac{|\boldsymbol{k}|}{|\boldsymbol{k}_\perp|}, \end{equation}
where  $C_{pv}$ is a constant. For an unstable solution which grows exponentially, the right-hand side of (2.27) can be neglected so that we have
 \begin{equation} q = F_h^2(\omega_z+{{{Ro}}^{-1}})k_z s. \end{equation}
Then the equation for  $q$ becomes a closed equation
 \begin{equation} {\dfrac{{\rm{d}}^2 {q}}{{\rm{d}} {t}^2}} = V_q q, \end{equation}
where
 \begin{align} V_q &= \left(\frac{{\rm d}}{{\rm d}t}\log \sin \theta \right)^2 - \frac{{\rm d}^2}{{\rm d}t^2}\log \sin \theta \nonumber\\ &\quad - (2\boldsymbol{\mathsf{H}}\hat{\boldsymbol{k}}_\perp\boldsymbol{\cdot}\hat{\boldsymbol{k}}_\perp \cos^2\theta +Ro^{-1}\cos^2\theta )(\omega_z+{{{Ro}}^{-1}})-F_h^{-2}\sin^2\theta, \end{align}
and  $\theta =\cos ^{-1} k_z/|\boldsymbol {k}|$ is the angle of wavevector and
 $\hat {\boldsymbol {k}}_\perp =\boldsymbol {k}_\perp /|\boldsymbol {k}_\perp |$. We use (2.29) in some of the following subsections.
3. Instability condition and estimate of growth rates
In this section, we consider the condition for each instability and estimate the growth rate in the framework of local stability analysis; most of them have been already obtained in previous work, although there are new results for the rotational-hyperbolic instability and the elliptic instability. Our aim is to give concise and useful expressions of the instability condition and the growth rate for each instability under the common scaling, which are not always rigorous but allow us to compare between the instabilities and to interpret the results in § 5 without difficulties. They are summarized in table 1, which are applicable to any flow if the actual values of the strain rates  $\varepsilon _h$ and
 $\varepsilon _e$ at the hyperbolic and elliptic stagnation points, respectively, and the maximum vorticity
 $\omega _{max}$ are available (see table 2 in § 4 for the 2-D Taylor–Green vortices); here, the strain rate is the larger eigenvalue of the
 $2\times 2$ matrix (or the strain tensor)
 $(\boldsymbol{\mathsf{L}}_\perp +\boldsymbol{\mathsf{L}}_\perp ^{\rm T})/2$; note that the sum of the eigenvalues are zero for incompressible flows. It is pointed out that the most essential dependence on the parameters is shown for the growth rate in table 1. Note that the
 $O(1)$ coefficients
 $C_{PH}$,
 $C_{SH}$,
 $C_{RH}$,
 $C_{C}$ and
 $C_{E}$ in table 1 depend on the parameters in general; the actual dependence will be checked numerically in § 5.1 (figure 8). The instability conditions are visualized on the
 $({{{Ro}}^{-1}}, {F_h^{-1}})$ plane in figure 2.
Condition and growth rate estimated by local stability analysis. The  $C_{PH}$,
 $C_{SH}$,
 $C_{RH}$,
 $C_{C}$ and
 $C_{E}$ are
 $O(1)$ coefficients which depend on the parameters in general.

Strain rates at hyperbolic and elliptic stagnation points and maximum vorticity of 2-D Taylor–Green vortices considered in the present paper.

Unstable regions on  $(Ro^{-1}, F_h^{-1})$ plane estimated by local stability analysis. (a) Pure hyperbolic, strato-hyperbolic and rotational-hyperbolic instabilities, (b) centrifugal and elliptic instabilities.

3.1. Pure hyperbolic instability
The pure hyperbolic (PH) instability is due to stretching near the hyperbolic stagnation points (Friedlander & Vishik Reference Friedlander and Vishik1991; Lifschitz & Hameiri Reference Lifschitz and Hameiri1991; Leblanc Reference Leblanc1997). The mechanism and the growth rate can be estimated analytically by investigating the solution to (2.17) at the hyperbolic stagnation points. We set  $\theta =0^\circ$ or
 ${\boldsymbol {k}}_\perp =0$ for which the growth rate is maximum and stratification has no effect as will be confirmed in § 5. Then the equation for
 ${\boldsymbol {a}}_\perp$ reads
 \begin{equation} {\dfrac{{\rm{d}} {{\boldsymbol{a}}_\perp}}{{\rm{d}} {t}}} = \left( \begin{array}{@{}cc@{}} -{\dfrac{\partial {u_b}}{\partial {x}}} & -{\dfrac{\partial {u_b}}{\partial {y}}} + {{{Ro}}^{-1}} \\ -{\dfrac{\partial {v_b}}{\partial {x}}}- {{{Ro}}^{-1}} & -{\dfrac{\partial {v_b}}{\partial {y}}} \end{array} \right) \left( \begin{array}{@{}c@{}} a_x \\ a_y \end{array} \right). \end{equation}
Let us consider a hyperbolic stagnation point where the flow is expanded as  $(u_b, v_b) = \varepsilon _h (x, -y) + O(x^2+y^2)$. Then the above equation becomes
 \begin{equation} {\dfrac{{\rm{d}}
{{\boldsymbol{a}}_\perp}}{{\rm{d}} {t}}} = \left(
\begin{array}{@{}cc@{}} -\varepsilon_h &
{{{Ro}}^{-1}} \\ -{{{Ro}}^{-1}} &
\varepsilon_h \end{array} \right) \left( \begin{array}{@{}c@{}}
a_x \\ a_y \end{array} \right),
\end{equation}
where  $\varepsilon _h={\partial u_b}/{\partial x}=-({\partial v_b}/{\partial y})$ is the strain rate. The eigenvalues of the matrix in (3.2) are given by
 \begin{equation} \lambda^2 = \varepsilon_h^2-{Ro}^{-2}. \end{equation}
Thus, the pure hyperbolic instability occurs when  $|{{{Ro}}^{-1}}| < \varepsilon _h$. The above (3.2) has a simple solution:
 \begin{equation} a_x = a_x(0) {\rm e}^{-\varepsilon_h t}, \quad a_y = a_y(0) {\rm e}^{\varepsilon_h t}, \end{equation}
when  ${{{Ro}}^{-1}}=0$ (Friedlander & Vishik Reference Friedlander and Vishik1991; Lifschitz & Hameiri Reference Lifschitz and Hameiri1991). In this regard,
 $a_y$ is in the stretching phase, while
 $a_x$ is in the compression phase. However, when the fluid particle is away from the hyperbolic stagnation points so that the strain rate is small, the phase of
 $\boldsymbol {a}$ changes approximately as
 $\boldsymbol {a} \propto {\rm e}^{\pm {\rm {i}} {{{Ro}}^{-1}} t}$, which we call the oscillation phase below.
In general, an estimate for the growth rate on a closed streamline is required. In this case, we should take into account that the wave packet does not always grow with the eigenvalue  $\lambda$; it is either stretched or compressed near the hyperbolic stagnation points depending on the direction of
 $\boldsymbol {a}$; when it is away from the hyperbolic stagnation points, the direction of
 $\boldsymbol {a}$ rotates in the oscillation phase. Therefore, the growth rate is estimated as
 $\sigma = C_{PH}(\varepsilon _h^2-{Ro}^{-2})^{1/2}$, where
 $C_{PH} \lesssim 1$ is a coefficient determined by the ratio of time of the stretching phase, in which the fluid particle stays near the stagnation points, and the oscillation phase, in which the fluid particle travels between the stagnation points. In the short-wave limit, the instability condition and the growth rate are unaffected by stratification because it occurs for
 $\theta =0^\circ$ where the stratification effects vanish.
3.2. Strato-hyperbolic instability
The strato-hyperbolic (SH) instability is a variant of the pure hyperbolic instability under stratification effects; it occurs when the exponential growth near the hyperbolic stagnation points is connected with phase shift due to the gravity waves in favour of exponential growth. Although the waves become inertia-gravity waves under rotation effects, the condition and the growth rate are estimated similarly as for the pure hyperbolic instability; the growth rate is estimated as  $\sigma = C_{SH}(\varepsilon _h^2-{Ro}^{-2})^{1/2}$; it is stabilized when
 $|{{{Ro}}^{-1}}| > \varepsilon _h$. The coefficient
 $C_{SH}$ is smaller than
 $C_{PH}$ in general because the ratio of the stretching phase to the oscillation phase decreases for larger
 $\theta$, where the strato-hyperbolic instability occurs. One important difference, however, is that the frequency of the gravity wave should be large enough to generate the phase shift during the fluid particle motion where the frequency is approximated as
 $\omega _{max}/2$; this leads to
 ${F_h^{-1}} \gtrsim \omega _{max}/2$ as an instability condition (Suzuki et al. Reference Suzuki, Hirota and Hattori2018). The resonance condition for the instability derived by Suzuki et al. (Reference Suzuki, Hirota and Hattori2018) can be generalized as
 \begin{equation} \int_{0}^{T/2} \sqrt{Ro^{-2}\cos^2 \theta + F_h^{-2} \sin^2 \theta} \,{\rm d}t = m {\rm \pi}, \end{equation}
where  $T$ is the period of fluid particle motion and
 $m$ is a positive integer. When
 ${F_h^{-1}}$ is large, the left-hand side of the above equation increases monotonically with
 $\theta _0$, so that the resonance condition is satisfied for
 $|{{{Ro}}^{-1}}| \lesssim 2m{\rm \pi} /T \lesssim {F_h^{-1}}$; thus, the strato-hyperbolic instability exists in the limit of strong stratification.
3.3. Rotational-hyperbolic instability
Although the pure hyperbolic instability is stabilized for  $|{{{Ro}}^{-1}}| > \varepsilon _h$, the potential
 $V_q$ in (2.29) oscillates periodically along streamlines near the cell boundaries. In fact,
 $V_q$ is approximated as
 \begin{equation} V_q \approx-{\dfrac{{\rm{d}}^2 {}}{{\rm{d}} {t}^2}} \log \sin \theta - {Ro}^{-2} \cos^2\theta - F_h^{-2} \sin^2\theta \end{equation}
near the cell boundaries; the first term is the main source of oscillation, while the other terms are responsible for the inertia-gravity waves. This oscillation can resonate with the inertia-gravity waves to give rise to another instability; we call it rotational-hyperbolic (RH) instability because it is the motion near the hyperbolic points which is responsible for the oscillation of  $V_q$. This instability has been shown by Sipp et al. (Reference Sipp, Lauga and Jacquin1999) without much attention and found by Godeferd et al. (Reference Godeferd, Cambon and Leblanc2001) both by local stability analysis, while its nature should be further explored because the corresponding unstable mode has not been found in modal stability analysis. Since the time period of the fluid particle motion is large on streamlines near the cell boundaries, the resonance occurs for small frequency of the inertia-gravity waves:
 $\theta \approx {\rm \pi}/2$ and small
 ${F_h^{-1}}$. The growth rate is estimated as
 $\sigma = C_{RH} \varepsilon _h$, where
 $C_{RH}$ is in general smaller than
 $C_{PH}$ since the wavevector angle
 $\theta$ is larger than the pure hyperbolic instability. The resonance condition for the rotational-hyperbolic instability is the same as (3.5) for the strato-hyperbolic instability; since it is satisfied for
 $\min (|{{{Ro}}^{-1}}|,{F_h^{-1}}) \lesssim 2m{\rm \pi} /T \lesssim \max (|{{{Ro}}^{-1}}|,{F_h^{-1}})$, the rotational-hyperbolic instability exists in the limit of strong stratification or rotation, although the growth rate becomes small for higher resonance (large
 $m$).
3.4. Centrifugal instability
The centrifugal (C) instability has been studied extensively since the discovery of the Rayleigh criterion (Rayleigh Reference Rayleigh1917); a criterion for rotating fluids was derived by Kloosterziel & van Heijst (Reference Kloosterziel and van Heijst1991). We set  $\theta =0^\circ$ or
 ${\boldsymbol {k}}_\perp =0$ where the growth rate is maximum and stratification has no effect. In addition, we approximate the base flow by an axisymmetric flow
 \begin{equation} \boldsymbol{U}=U_\varTheta^{(0)}(R) {\boldsymbol{e}}_{\varTheta} \end{equation}
in the polar coordinates  $(R, \varTheta )$ centred at an elliptic stagnation point to obtain concise expressions for the instability condition and growth rate. Then the equation for
 ${\boldsymbol {a}}_\perp =a_R{\boldsymbol {e}}_{R}+a_\varTheta {\boldsymbol {e}}_{\varTheta }$ reads
 \begin{equation} {\dfrac{{\rm{d}}
{}}{{\rm{d}} {t}}} \left( \begin{array}{@{}c@{}} a_R \\
a_\varTheta \end{array} \right) + \varOmega_p \left(
\begin{array}{@{}c@{}} -a_\varTheta \\ a_R \end{array} \right) =
\left( \begin{array}{@{}cc@{}} 0 & \varOmega_p +
{{{Ro}}^{-1}} \\ -{\dfrac{{\rm{d}}
{U_\varTheta^{(0)}}}{{\rm{d}} {R}}}-
{{{Ro}}^{-1}} & 0 \end{array} \right) \left(
\begin{array}{@{}c@{}} a_R \\ a_\varTheta \end{array} \right),
\end{equation}
where  $\varOmega _p={U_\varTheta ^{(0)}}/{R}$ is the rotation rate of a fluid particle. The above equation is reduced to
 \begin{equation} {\dfrac{{\rm{d}}^2 {a_R}}{{\rm{d}} {t}^2}} =-2\left(\varOmega_p + \frac{{{{Ro}}^{-1}}}{2} \right) (\omega_z+{{{Ro}}^{-1}}) a_R, \end{equation}
where  $\omega _z={{\rm {d}}U_\varTheta ^{(0)}}/{{\rm {d}}R}+{U_\varTheta ^{(0)}}/{R}$ is the vorticity. Thus, the Rayleigh criterion in rotating fluids is recovered as the condition for the centrifugal instability:
 \begin{equation} \left(\varOmega_p + \frac{{{{Ro}}^{-1}}}{2} \right) (\omega_z+{{{Ro}}^{-1}}) < 0 \end{equation}
or
 \begin{equation} -2\varOmega_p < {{{Ro}}^{-1}} <- \omega_z \end{equation}
on each streamline. We assume that  $\omega _z$ decreases monotonically with
 $R$ and
 $\omega _z\ge 0$. Then,
 $\varOmega _p$ is maximum at
 $R=0$ where
 $2\varOmega _p=\omega _z(0)=\omega _{max}$, by which the instability condition becomes
 \begin{equation} -\omega_{max} < {{{Ro}}^{-1}} < 0. \end{equation}
The maximum growth rate depends on the vorticity distribution. The growth rate at a given streamline takes the maximum value when  $-{{{Ro}}^{-1}}=\varOmega _p(R)+\omega _z(R)/2$:
 \begin{equation} \sigma = \varOmega_p-\frac{\omega_z}{2} = C_C \omega_{max}, \end{equation}
where  $C_C$ is an
 $O(1)$ coefficient.
3.5. Elliptic instability
The elliptic (E) instability in rotating stratified fluids was studied by Kerswell (Reference Kerswell2002) and Leblanc (Reference Leblanc2003) for the unbounded case, and by Guimbard et al. (Reference Guimbard, Le Dizès, Le Bars, Le Gal and Leblanc2010) for the flow inside a rotating cylinder; see also Godeferd et al. (Reference Godeferd, Cambon and Leblanc2001) for the rotating non-stratified case and Miyazaki & Fukumoto (Reference Miyazaki and Fukumoto1992) for the non-rotating stratified case. Here we derive a new result required for interpretation of the results in § 5 after recovering the results obtained by Kerswell (Reference Kerswell2002) and Leblanc (Reference Leblanc2003).
We assume that the base flow is a sum of an axisymmetric flow and a weak straining flow:
 \begin{equation} \boldsymbol{U}=U_\varTheta^{(0)}(R) {\boldsymbol{e}}_{\varTheta} + \varepsilon_e \left[U_R^{(1)}(R) \sin 2\varTheta {\boldsymbol{e}}_{r} +U_\varTheta^{(1)}(R) \cos 2\varTheta {\boldsymbol{e}}_{\varTheta}\right]. \end{equation}
The potential in (2.29) turns out to be
 \begin{align} V_q &=V_q^{(0)} + \varepsilon_e V_{q}^{(1)} \cos 2\varOmega_p t + O(\varepsilon_e^2), \end{align}
 \begin{align} V_q^{(0)} &=-(2\varOmega_p+{{{Ro}}^{-1}})(\omega_z+{{{Ro}}^{-1}}) \cos^2\theta -F_h^{-2}\sin^2\theta, \end{align}
 \begin{align} V_{q}^{(1)} &= 2 \varOmega_p \cos^2\theta \left( \frac{U_R^{(1)}}{R_0} +{\dfrac{{\rm{d}} {U_R^{(1)}}}{{\rm{d}} {R}}} -\frac{U_R^{(1)}}{R_0\varOmega_p} {\dfrac{{\rm{d}} {U_\varTheta^{(0)}}}{{\rm{d}} {R}}}\right) -2 \cos^2\theta (\omega_z+{{{Ro}}^{-1}}) \nonumber\\ & \quad + \left[ -\gamma \sin^2\theta {\dfrac{{\rm{d}} {U_R^{(1)}}}{{\rm{d}} {R}}} -\left(\frac{3}{2}+\gamma\sin^2\theta\right) \frac{U_R^{(1)}}{R_0}\right. \notag\\ &\quad + \left. \frac{U_\varTheta^{(1)}}{R_0} +\left(-\frac{1}{2}+\gamma\sin^2\theta\right) \frac{U_R^{(1)}}{R_0\varOmega_p}{\dfrac{{\rm{d}} {U_\varTheta^{(0)}}}{{\rm{d}} {R}}}\right] \nonumber\\ & \quad -\frac{\sin^2\theta \cos^2\theta}{F_h^2\varOmega_p}\left( \frac{U_R^{(1)}}{R_0} +{\dfrac{{\rm{d}} {U_R^{(1)}}}{{\rm{d}} {R}}} -\frac{U_R^{(1)}}{R_0\varOmega_p} {\dfrac{{\rm{d}} {U_\varTheta^{(0)}}}{{\rm{d}} {R}}}\right), \end{align}
where  $\gamma = 1 + 1/(2Ro \varOmega _p)$. The leading-order term determines the oscillation frequency
 $\omega$ by
 $\omega ^2=-V_q^{(0)}$, while the first-order term can induce resonance so that an instability occurs.
First, we focus on the stability near the elliptic stagnation points. At  $R \approx 0$,
 $\omega _z \approx 2\varOmega _p \approx \omega _{max}$, which gives
 \begin{equation} \omega^2 =-V_q^{(0)} \approx (\omega_{max}+{{{Ro}}^{-1}})^2 \cos^2\theta +F_h^{-2}\sin^2\theta. \end{equation}
The resonance condition is
 \begin{equation} \omega = \frac{n}{2} \omega_{max}, \end{equation}
which gives, for  $n=1$,
 \begin{equation} \cos^2\theta = \frac{1}{4} \frac{\omega_{max}^2-4F_h^{-2}}{(\omega_{max}+{{{Ro}}^{-1}})^2-F_h^{-2}}. \end{equation}
When (3.20) has a solution, the growth rate is obtained as
 \begin{equation} \sigma = \frac{\varepsilon_e}{64} \left|\frac{(\omega_{max}^2-4F_h^{-2})\left(3\omega_{max}+2{{{Ro}}^{-1}}\right)^2}{\left[(\omega_{max}+{{{Ro}}^{-1}})^2-F_h^{-2}\right] \omega_{max}^2} \right|, \end{equation}
which recovers the result by Leblanc (Reference Leblanc2003) with  $\omega _{max}=2, {{{Ro}}^{-1}}=2f, F_h^{-1}=2n$ and
 $\varepsilon =\delta /2$. The instability condition is obtained by considering
 $0 \le \cos ^2\theta \le 1$ in (3.20): when
 ${F_h^{-1}}<\omega _{max}/2$,
 \begin{equation} {{{Ro}}^{-1}} <-\tfrac{3}{2} \omega_{max} \quad \text{or} \quad {{{Ro}}^{-1}} >-\tfrac{1}{2} \omega_{max}, \end{equation}
and when  ${F_h^{-1}}>\omega _{max}/2$,
 \begin{equation} -\tfrac{3}{2} \omega_{max} < {{{Ro}}^{-1}} <-\tfrac{1}{2} \omega_{max}. \end{equation}
Next, we consider the stability away from the elliptic stagnation points. The resonance condition is
 \begin{equation} \varOmega_p^2 =(2\varOmega_p+{{{Ro}}^{-1}})(\omega_z+{{{Ro}}^{-1}}) \cos^2\theta +F_h^{-2}\sin^2\theta. \end{equation}
It is not elucidating to consider a solution to the above equation since  $\varOmega _p$ and
 $\omega _z$ depend on
 $R$ differently. However, the case
 $\theta =0^\circ$, for which stratification effects vanish, turns out to be useful in interpreting the results in § 5. In this case, we have
 \begin{equation} \left(1+\frac{{{{Ro}}^{-1}}}{2\varOmega_p}\right) \left(\frac{\omega_z}{2\varOmega_p}+\frac{{{{Ro}}^{-1}}}{2\varOmega_p}\right) = \frac{1}{4}. \end{equation}
By noting that the vorticity  $\omega _z$ decays more rapidly with
 $R$ than
 $\varOmega _p$, which implies
 ${\omega _z}/{2\varOmega _p} \le 1$, a solution to (3.25) for
 $R$ exists when
 \begin{equation} -\frac{\omega_{max}}{2} \lesssim {{{Ro}}^{-1}} \lesssim 0. \end{equation}
Combined with (3.23), the instability condition for  ${F_h^{-1}}>\omega _{max}/2$ becomes
 \begin{equation} -\tfrac{3}{2}\omega_{max} < {{{Ro}}^{-1}} \lesssim 0. \end{equation}
The dependence of the growth rate (3.21) on the parameters is not simple. We write  $\sigma =C_{E} \varepsilon _e$, where
 $C_{E}$ depends on
 ${{{Ro}}^{-1}}$,
 ${F_h^{-1}}$ and
 $\omega _{max}$. For the non-stratified case
 ${F_h^{-1}}=0$,
 $C_{E}$ decreases with
 ${{{Ro}}^{-1}}$ when
 ${{{Ro}}^{-1}}>0$;
 $C_{E}$ increases with
 $|{{{Ro}}^{-1}}|$ when
 $-\omega _{max}/2 < {{{Ro}}^{-1}}<0$.
4. Numerical procedure
4.1. Base flow
We choose the 2-D Taylor–Green vortices (figure 3) as a base flow as was done by Suzuki et al. (Reference Suzuki, Hirota and Hattori2018) and Hattori et al. (Reference Hattori, Suzuki, Hirota and Khandelwal2021). The 2-D Taylor–Green vortices are an array of vortices doubly periodic in horizontal directions. The vorticity is
 \begin{equation} \omega(x,y) = \omega_{max} \sin \frac{2{\rm \pi} x}{A} \sin 2{\rm \pi} A y, \end{equation}
where  $A^2$ is the ratio of the spatial period
 $L_x=A$ in
 $x$ and
 $L_y=1/A$ in
 $y$. Each vortex is contained in a rectangular cell where the vertices are hyperbolic points. The sign of vorticity in a cell is opposite to that in the neighbouring cells forming a staggered lattice of vortices. The vorticity is parallel to the vertical direction. The base flow is steady in the absence of viscous diffusion since the stream function
 \begin{equation} \varPsi(x,y) = \frac{\omega_{max}}{(2{\rm \pi})^2 (A^2 + A^{-2})} \sin \frac{2{\rm \pi} x}{A} \sin 2{\rm \pi} A y, \end{equation}
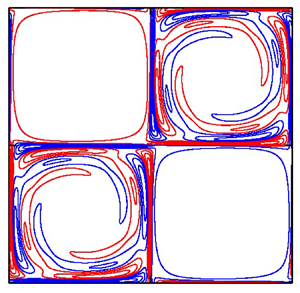
Streamlines of 2-D Taylor–Green vortices.  $\varepsilon _e/\omega _{max}=0.2$. The solid (red) and dashed (blue) lines correspond to positive and negative values of the stream function, respectively. The contour levels are
 $\varPsi /\varPsi _{max} = \pm 0.16, 0.32, \ldots, 0.96$.

Scaling and the base-flow parameter have been chosen as in our previous work (Suzuki et al. Reference Suzuki, Hirota and Hattori2018; Hattori et al. Reference Hattori, Suzuki, Hirota and Khandelwal2021) for comparison purposes. Namely, the characteristic length has been set to the geometric mean of the rectangular cell  $L_0=(L_xL_y)^{1/2}/2=1$, while the characteristic velocity has been chosen as
 \begin{equation} U_0 = \frac{\omega_{max}L_0}{2{\rm \pi}} = 1. \end{equation}
Two cases are considered: (i)  $A=1$, which implies
 $L_x=L_y$ and
 $\varepsilon _e/\omega _{max}=0$, and (ii)
 $A=(7/3)^{1/4}$, which implies
 $L_x/L_y=\sqrt {7/3}$ and
 $\varepsilon _e/\omega _{max}=0.2$. Other choices of scaling are possible; for example, the Rossby number and the Froude number are divided by
 $2{\rm \pi}$ if we choose
 $\omega _{max}$, as the time scale as was done by Sipp et al. (Reference Sipp, Lauga and Jacquin1999).
4.2. Local stability analysis
The numerical method for local stability analysis is essentially the same as that of Suzuki et al. (Reference Suzuki, Hirota and Hattori2018) except that the Coriolis force is taken into account in the present work. Equations (2.15)–(2.18) were integrated in time by the fourth-order Runge–Kutta method. We consider periodic orbits of fluid particles throughout this paper. We also assume that the wavevector  $\boldsymbol {k}$ is time-periodic which is a necessary condition for exponential instability on the periodic orbits. It is known that
 $\boldsymbol {k}$ is time-periodic if it is perpendicular to the streamline initially:
 \begin{equation} \boldsymbol{k}(0)\boldsymbol{\cdot}\boldsymbol{u}_b(\boldsymbol{X}(0))=0. \end{equation}
Then the time evolution of amplitude is described by a Floquet matrix  $\boldsymbol{\mathsf{F}}$ since the matrices which appear in (2.17) is also time-periodic:
 \begin{equation} \{ \boldsymbol{a}, r\}(t+T)=\boldsymbol{\mathsf{F}}(T)\{ \boldsymbol{a}, r\}(t), \end{equation}
where  $T$ is the period of
 $\boldsymbol {k}$ which coincides with that of the particle motion
 $\boldsymbol {X}$. Our task is to calculate the eigenvalues
 $\{ \mu _i \}$ of
 $\boldsymbol{\mathsf{F}}(T)$ which determines the growth rate as
 \begin{equation} \sigma_i=\frac{\log{|\mu_i|}}{T}. \end{equation}
Given the strength of rotation and stratification by the Rossby number  $Ro$ and the Froude number
 $F_h$, the initial conditions should be specified to have particular solutions. Among the initial conditions, one parameter, which is denoted by
 $\beta$ in the following sections, is required for
 $\boldsymbol {X}(0)$ to identify a streamline in a 2-D flow. We set
 \begin{equation} \boldsymbol{X}(0)=\left(\frac{L_x}{4}(1-\beta), \frac{L_y}{4}, 0\right)^{\rm T}, \quad 0 \le \beta <1. \end{equation}
The elliptic stagnation point corresponds to  $\beta =0$, while
 $\beta =1$ corresponds to the cell boundaries.
Another parameter is required for  $\boldsymbol {k}(0)$ to specify the direction of the wavevector which satisfies (4.4); we take the angle between
 $\boldsymbol {e}_z$ and
 $\boldsymbol {k}(0)$, which is denoted by
 $\theta _0$. It should be pointed out that the magnitude of
 $\boldsymbol {k}(0)$ is arbitrary since the right-hand side of (2.17) depends only on the direction of
 $\boldsymbol {k}$ and is independent of the magnitude after taking the short-wave limit. For the amplitudes
 $\boldsymbol {a}(0)$ and
 $r(0)$, three independent initial conditions satisfying the incompressibility condition
 $\boldsymbol {a}(0)\boldsymbol {\cdot } \boldsymbol {k}(0)=0$ are considered; the results do not depend on the choice of the initial conditions since the space spanned by the three initial conditions is common. As a result, we obtain the largest growth rate
 $\sigma$ as a function of
 $\beta$,
 $\theta _0$,
 $Ro$ and
 $F_h$:
 $\sigma =\sigma (\beta, \theta _0, Ro, F_h)$.
4.3. Modal stability analysis
In the modal stability analysis, (2.9)–(2.11) were solved numerically by the Fourier spectral method (Peyret Reference Peyret2010) assuming periodic boundary conditions in all three directions, as was done by Hattori et al. (Reference Hattori, Suzuki, Hirota and Khandelwal2021). The time marching was performed by the fourth-order Runge–Kutta method.
Since the base flow is 2-D, the time evolution of disturbances is separable in the vertical direction. Thus, we set
 \begin{equation} \boldsymbol{u}' = {\rm e}^{{\rm{i}} k_z z} \sum_{k_x=-K_x}^{K_x}\sum_{k_y=-K_y}^{K_y} \tilde{\boldsymbol{u}}_{k_x,k_y} \exp({{\rm i} [k_x (x/L_x)+k_y (y/L_y)]}) \end{equation}
with similar expression for  $p'$ and
 $\rho '$. The number of the Fourier modes is
 $500 \times 500$, the same as in the study by Hattori et al. (Reference Hattori, Suzuki, Hirota and Khandelwal2021).
The growth rate and frequency were obtained by the method of Krylov subspace (Edwards et al. Reference Edwards, Tuckerman, Friesner and Sorensen1994; Julien, Ortiz & Chomaz Reference Julien, Ortiz and Chomaz2004; Donnadieu et al. Reference Donnadieu, Ortiz, Chomaz and Billant2009; Hattori et al. Reference Hattori, Suzuki, Hirota and Khandelwal2021). Starting from randomized initial conditions, (2.9)–(2.11) were integrated for a certain long time. Intermediate states  $\{(\pmb {u}'(T_0), \rho '(T_0)), (\pmb {u}'(T_0+\Delta T), \rho '(T_0+\Delta T)), \ldots, (\pmb {u}'(T_0+(N_K-1)\Delta T), \rho '(T_0+(N_K-1)\Delta T))\}$ were used as generators of the Krylov subspace. Then the eigenvalues and the eigenmodes were obtained in the
 $N_K$-dimensional Krylov subspace.
In this method, the error of an eigenvalue  $\lambda$ of a linear operator
 $\boldsymbol{\mathsf{L}}$ can be evaluated by
 \begin{equation} \epsilon = \frac{\| {\boldsymbol{\mathsf{L}}}\boldsymbol{v}-\lambda\boldsymbol{v} \|}{\| \boldsymbol{v} \|}, \end{equation}
where  $\boldsymbol {v}$ is the corresponding approximate eigenvector. The error
 $\epsilon$ depends on the initial time of the data
 $T_0$, the interval between the data
 $\Delta T$ and the dimension of the Krylov subspace
 $N_K$. To obtain eigenvalues accurately, several Krylov subspaces were generated from different sets of parameters and the eigenvalue with the smallest error for each eigenmode was chosen. The actual values of the parameters were chosen after trial and error. The number of data
 $N_K$ was fixed to
 $10$, the start time of the data was
 $T_0=195$ or
 $245$ and the interval between the data
 $\Delta T$ was fixed to
 $5$. Typically, the error of the eigenvalue is
 $\epsilon =O(10^{-10})$ for the largest eigenvalue for a fixed wavenumber
 $k_z$, while it increases for subdominant eigenmodes. In the following, we discarded the eigenmodes with
 $\epsilon \ge 10^{-3}$.
4.4. Realizability as a mode
As we see in § 5, the instabilities found by local stability analysis are not always found in modal stability analysis at finite Reynolds numbers since high-wavenumber modes are damped by viscous damping. In this case, the corresponding region of the instability in the  $(\beta, \theta _0)$ plane is often thin so that it is difficult to construct an unstable mode. It is worth noting that Bayly (Reference Bayly1988) derived a condition for construction of an unstable eigenmode from local solutions of the form (2.12)–(2.14); the spatial width of the mode is approximately
 $[-\sigma ''(\beta )/2C(\beta )]^{-1/4}$, where
 $C(\beta )$ is an integral along a streamline and
 $C(\beta )>0$ is the condition since
 $\sigma ''(\beta )$ is normally negative. When
 $|\sigma ''(\beta )|$ is small, the unstable region in the local stability analysis is wide and the corresponding mode has a large spatial width; in other words, the radial wavenumber of the mode is small. Therefore, the eigenmode corresponding to a wider unstable region in the
 $(\beta, \theta _0)$ plane is less affected by viscous damping. Moreover, if the unstable region is wide in the
 $\theta _0$ direction, an eigenmode constructed by superposition of the local solutions can avoid viscous damping at lower Reynolds numbers.
With the above in mind, we intuitively introduce the following quantity:
 \begin{equation} \mathcal{R} = \int_{S} \sigma \sin\theta_0 \,{\rm d}\beta \,{\rm d}\theta_0, \end{equation}
where  $S$ is the region of an instability on the
 $(\beta, \theta _0)$ plane, to quantify realizability as a mode of each instability; eigenmodes corresponding to an unstable region may not be found at finite Reynolds numbers and finite wavenumbers if
 $\mathcal {R}$ is small. It should be noted that existence of a mode depends on the Reynolds number; the critical Reynolds number at which a particular mode appears would increase as
 $\mathcal {R}$ decreases. In the above definition of realizability
 $\mathcal {R}$, the factor
 $\sin \theta _0$ is required to account for the solid angle since
 $\theta _0$ is the polar angle of a wavevector from the vertical axis in three dimensions. It should be pointed out that this is a crude approximation; for example, it would be better to replace
 $\theta _0$ by the average of
 $\theta$. However, it is sufficient to interpret the results of modal stability analysis since only the order of magnitude of
 $\mathcal {R}$ matters.
5. Results
In this section, we show the results of local and modal stability analysis of the 2-D Taylor–Green vortices.
5.1. Results of local stability analysis
First, we show how each instability appears in local stability analysis by observing the growth rate  $\sigma (\beta, \theta _0, Ro, F_h)$ as a function of
 $\beta$ and
 $\theta _0$ for given values of
 $Ro$ and
 $F_h$. We choose the values of
 $Ro$ and
 $F_h$ to cover nearly all conditions for the instabilities in table 1:
 ${F_h^{-1}}=0 (< \omega _{max}/2)$ and
 $5 (> \omega _{max}/2)$, and
 $|{{{Ro}}^{-1}}|=0, 2 (< \varepsilon _h, \omega _{max}/2)$ and
 $|{{{Ro}}^{-1}}|=4 (> \varepsilon _h, \omega _{max}/2)$ (also see table 2).
Figure 4 shows  $\sigma (\beta, \theta _0, Ro, F_h)$ for the non-stratified case
 $F_h^{-1}=0$, comparing among the Rossby numbers
 $Ro^{-1}=0, \pm 2$ and
 $\pm 4$. Four types of instability are observed: pure hyperbolic instability, centrifugal instability, rotational-hyperbolic instability and elliptic instability. The pure hyperbolic instability appears for
 ${{{Ro}}^{-1}}=\pm 2$ near
 $\beta =1$ (figure 4c,d,g,h). The growth rate is the largest at
 $\theta _0=0^\circ$, while the unstable region extends to large
 $\theta _0$. It does not appear for
 ${{{Ro}}^{-1}}=0$ since the stretching near a hyperbolic stagnation point is cancelled by the compression near the next hyperbolic stagnation point, as explained by Suzuki et al. (Reference Suzuki, Hirota and Hattori2018). The centrifugal instability appears for
 ${{{Ro}}^{-1}}=-4$ as a band
 $0.6 \lesssim \beta \lesssim 0.8$ (figure 4a,b). The growth rate is the largest at
 $\theta _0=0^\circ$, while the unstable region extends to large
 $\theta _0$ as in the case of the pure hyperbolic instability. The rotational-hyperbolic instability is observed for
 ${{{Ro}}^{-1}}=4$ (figure 4i,j). The unstable region emanates from
 $(\beta, \theta _0)=(1,90^\circ )$, becomes thick at
 $\beta \approx 0.9$ and then shrinks as
 $\beta$ decreases. The elliptic instability appears for
 $\varepsilon _e/\omega _{max}=0.2$ (figure 4b,d,f,h,j). It forms a horizontal band emanating from
 $(\beta, \theta _0) \approx (0, 60^\circ )$ for
 ${{{Ro}}^{-1}}=0$ (figure 4f). The band moves to larger
 $\theta _0$ for
 ${{{Ro}}^{-1}}>0$ (figure 4h,j), while it becomes wide for
 ${{{Ro}}^{-1}}=-2$ (figure 4d). The unstable region survives with reduced growth rate near
 $(\beta, \theta _0) = (0,0)$ for
 ${{{Ro}}^{-1}}=-4$ (figure 4b), although the elliptic instability does not occur according to table 1; the lower limit of
 ${{{Ro}}^{-1}}$ for the elliptic instability is
 $-$4.3, as shown later in figure 6, which is larger in magnitude than the limit
 $-\omega _{max}/2=-3.14$. The only remarkable difference between
 $\varepsilon _e/\omega _{max}=0$ and
 $0.2$ is that the elliptic instability appears for
 $\varepsilon _e/\omega _{max}=0.2$. The characteristic features of each instability for
 $\varepsilon _e/\omega _{max}=0.2$ are in good agreement with Sipp et al. (Reference Sipp, Lauga and Jacquin1999) for
 $\varepsilon _e/\omega _{max}=0.3$ (
 $L_x/L_y=2$). The rotational-hyperbolic instability was observed as many thin bands by Godeferd et al. (Reference Godeferd, Cambon and Leblanc2001) for the Stuart vortices; in the present case, the number of bands is small owing to the difference in vorticity distribution.
Growth rate  $\sigma (\beta, \theta _0, Ro, F_h)$ as a function of
 $\beta$ and
 $\theta _0$ obtained by local stability analysis.
 $F_h^{-1}=0$ and (a,c,e,g,i)
 $\varepsilon _e/\omega _{max}=0$ and (b,d,f,h,j)
 $0.2$.
 $Ro^{-1}=$ (a,b)
 $-4$, (c,d)
 $-2$, (e,f)
 $0$, (g,h)
 $2$, (i,j)
 $4$.

Figure 5 shows the growth rate  $\sigma (\beta, \theta _0, Ro, F_h)$ for a stratified case
 $F_h^{-1}=5$. There are several differences from
 $F_h^{-1}=0$. The strato-hyperbolic instability appears for
 ${{{Ro}}^{-1}}=0, \pm 2$ (figure 5c–h). The elliptic instability is stabilized for
 $Ro^{-1} \ge 0$, while it survives for
 $Ro^{-1}=-2$ and
 $-$4, as predicted in § 3.5. It is pointed out that the unstable region of the elliptic instability for
 ${{{Ro}}^{-1}}=-4$ is larger than that of the non-stratified case (figure 4b). The rotational-hyperbolic instability is hardly visible as the growth rate decreases significantly. Most of the unstable regions are compressed to
 $\theta _0=0^\circ$ by stratification; at
 $\theta _0=0^\circ$, however, the effects of stratification vanish according to (2.29) and (2.30). As a result, the maximum growth rates of the pure hyperbolic instability and the centrifugal instability are the same as those for
 $F_h^{-1}=0$.
Growth rate  $\sigma (\beta, \theta _0, Ro, F_h)$ as a function of
 $\beta$ and
 $\theta _0$ obtained by local stability analysis.
 $F_h^{-1}=5$ and (a,c,e,g,i)
 $\varepsilon _e/\omega _{max}=0$ and (b,d,f,h,j)
 $0.2$.
 $Ro^{-1}=$ (a,b)
 $-4$, (c,d)
 $-2$, (e,f)
 $0$, (g,h)
 $2$, (i,j)
 $4$.

To elucidate which instability is dominant and how it depends on stratification and rotation, we focus on the maximum growth rate for fixed magnitude of rotation and stratification in the rest of this subsection:  $\sigma _{max}(Ro, F_h)=\max _{\beta, \theta _0} \sigma (\beta, \theta _0, Ro, F_h)$. Figure 6 shows
 $\sigma _{max}(Ro, F_h)$ as a function of
 ${{{Ro}}^{-1}}$ for
 $(\varepsilon _e/\omega _{max}, F_h^{-1})=(0.2, 1)$. In this figure, maximum is taken for each instability. The four types of instability are observed as in figure 4. Important features of each instability are captured. For example, the pure hyperbolic instability appears for
 $|{{{Ro}}^{-1}}| \lesssim 2.9$. It is worth noting that the growth rate is nearly the same for cyclonic and anti-cyclonic rotation; this is because the pure hyperbolic instability occurs near the cell boundaries where vorticity is weak. The centrifugal instability appears for
 $-6.2 \lesssim {{{Ro}}^{-1}} \lesssim -2.7$ bifurcating from the pure hyperbolic instability; rigorously speaking, it is difficult to distinguish between the pure hyperbolic instability and the centrifugal instability for
 $-2.7 \lesssim Ro^{-1} < 0$. In figure 7, we show how the maximum growth rate
 $\sigma _{max}(Ro, F_h)$ depends not only on rotation but also on stratification;
 $\sigma _{max}(Ro, F_h)$ is plotted against
 $Ro^{-1}$ for selected values of
 $F_h^{-1}$, while the close-up view of
 $\sigma _{max}(Ro, F_h)$ for weak rotation
 $|{{{Ro}}^{-1}}| \le 0.25$ is shown in the insets. Also shown in this figure is the realizability
 $\mathcal {R}$ introduced by (4.10). Each curve for a fixed value of
 ${F_h^{-1}}$ consists of different types of instability, as observed in figure 6. The dominant instability for
 $\varepsilon _e/\omega _{max}=0$ changes as
 \begin{align} {{{Ro}}^{-1}} \ge 0:& \quad ({\rm{SH}} \ \to) \ {\rm{PH}} \ \to\ {\rm{RH}}, \end{align}
 \begin{align} {{{Ro}}^{-1}} \le 0:& \quad ({\rm{SH}} \ \to) \ {\rm{PH}} \ \to\ {\rm{C}} \ \to\ {\rm{RH}} \end{align}
as  $|{{{Ro}}^{-1}}|$ increases, and for
 $\varepsilon _e/\omega _{max}=0.2$ as
 \begin{align} {{{Ro}}^{-1}} \ge 0:& \quad ({\rm{E / SH}} \ \to) \ {\rm{PH}} \ \to\ {\rm{RH}}, \end{align}
 \begin{align} {{{Ro}}^{-1}} \le 0:& \quad ({\rm{E / SH}} \ \to) \ {\rm{PH}} \ \to\ {\rm{E}} \ (\to\ {\rm{C}}) \ \to {\rm{RH}}, \end{align}
where occurrence of the parenthesized instabilities depends on the magnitude of stratification. We see that the pure hyperbolic instability and the centrifugal instability are unaffected by stratification in figure 7 since the maximum occurs at  $\theta _0=0^\circ$. This does not imply that the actual unstable modes are also independent of stratification since stratification affects mode structures; in fact, realizability
 $\mathcal {R}$ decreases as
 ${F_h^{-1}}$ increases (figure 7c,d), which is more prominent for the anti-cyclonic case (
 ${{{Ro}}^{-1}}<0$) than for the cyclonic case (
 ${{{Ro}}^{-1}}>0$). However, the rotational-hyperbolic instability and the elliptic instability are strongly affected by stratification. The rotational-hyperbolic instability appears for
 ${{{Ro}}^{-1}} \gtrsim 3$ bifurcating from the pure hyperbolic instability, while it also appears for
 ${{{Ro}}^{-1}} \lesssim -4$. The growth rate and the realizability decrease as stratification becomes strong;
 $\mathcal {R}$ almost vanishes for
 ${{{Ro}}^{-1}} <0$, suggesting that it is difficult to observe the corresponding unstable modes at finite Reynold numbers. The growth rate of the elliptic instability, which appears only for
 $\varepsilon _e/\omega _{max}=0.2$, becomes maximum at
 $Ro^{-1} \approx -3.1$. The unstable range is different for
 ${F_h^{-1}} \le 3$ and
 ${F_h^{-1}} \ge 5$, as predicted in § 3.5. The growth rate decreases with
 ${F_h^{-1}}$ for
 ${{{Ro}}^{-1}}>0$ and increases with
 ${F_h^{-1}}$ for
 ${{{Ro}}^{-1}} \lesssim -4$, whereas the maximum growth rate at
 $Ro^{-1} \approx -3.1$ does not depend on stratification. The strato-hyperbolic instability appears for
 $F_h^{-1} \gtrsim 2$; it merges with the pure hyperbolic instability at
 $Ro^{-1} \approx 0.03$. The growth rate decreases with rotation for
 $Ro^{-1}<0$.
Growth rate  $\sigma _{max}(Ro, F_h)$ as a function of
 $Ro$ obtained by local stability analysis.
 $\varepsilon _e/\omega _{max}=0.2$,
 $F_h^{-1}=1$.

(a,b) Growth rate  $\sigma _{max}(Ro, F_h)$ and (c,d) realizability as a function of
 $Ro^{-1}$ obtained by local stability analysis. Also shown as insets in (a,b) are close-up views of the growth rate
 $\sigma _{max}(Ro, F_h)$ for weak rotation
 $-0.25 \le Ro^{-1} \le 0.25$. (a,c)
 $\varepsilon _e/\omega _{max}=0$, (b,d)
 $\varepsilon _e/\omega _{max}=0.2$.

It is of interest to evaluate the coefficients of the growth rate in table 1. Figure 8 shows the coefficient as a function of  ${{{Ro}}^{-1}}$ for each instability. Since the coefficients
 $C_{PH}$ and
 $C_{C}$ are independent of stratification, they are compared between
 $\varepsilon _e/\omega _{max}=0$ and
 $0.2$ (figure 8a,b). We observe that the difference between the cases
 $\varepsilon _e/\omega _{max}=0$ and
 $0.2$ are small; it is also the case for the the strato-hyperbolic instability and the rotational-hyperbolic instability, while the coefficient of the elliptic instability vanishes for
 $\varepsilon _e/\omega _{max}=0$. Thus, the coefficients of the strato-hyperbolic instability, the rotational-hyperbolic instability and the elliptic instability are shown for the same values of
 ${F_h^{-1}}$ as in figure 7 with
 $\varepsilon _e/\omega _{max}=0.2$ (figure 8c,d,e). The magnitude of the coefficients is
 $O(1)$ for all instabilities, while it is small for the centrifugal instability and the strato-hyperbolic instability.
Coefficients which appear in table 1 as a function of  $Ro^{-1}$ obtained by local stability analysis. Panels (a,b) shows
 $C_{PH}$ and
 $C_{C}$, respectively, for
 $\varepsilon _e/\omega _{max}=0$ and
 $0.2$. Panels (c–e) shows
 $C_{SH}$,
 $C_{RH}$ and
 $C_{E}$ for
 ${F_h^{-1}}=0, 1, 2, 3, 5$ and
 $10$, while
 $\varepsilon _e/\omega _{max}$ is fixed to
 $0.2$. The dashed lines in (e) show the analytical values (3.21) for
 ${F_h^{-1}}=0, 2$ and
 $10$.

Figure 8 reveals some features of subdominant modes which are not shown in figure 7. The coefficient of the strato-hyperbolic instability  $C_{SH}$ vanishes for
 ${F_h^{-1}} \le 2$; it increases with
 ${F_h^{-1}}$. The coefficient of the elliptic instability is maximum
 $C_{E}=1.0$ at
 ${{{Ro}}^{-1}}=-3.1$; it is independent of stratification for
 $-3.7 \lesssim {{{Ro}}^{-1}} \lesssim -2.7$, where the maximum growth rate occurs at
 $\theta _0=0$. Also shown in figure 8(e) by the dashed lines is the analytical growth rate (3.21) for
 ${F_h^{-1}}=0, 2$ and
 $10$. It is in good agreement with the numerical results except for intervals near
 ${{{Ro}}^{-1}} = -3.1$ where
 $\theta _0=0$.
Figure 8 also helps us deduce how the coefficients depend on the Rossby number. The coefficients  $C_{PH}$ and
 $C_{RH}$ do not depend on
 ${{{Ro}}^{-1}}$ significantly except for
 ${{{Ro}}^{-1}} \approx 0$ for
 $C_{PH}$, and for
 ${{{Ro}}^{-1}} \approx 3$ and
 $-$4 for
 $C_{RH}$. The coefficient of the centrifugal instability decreases with
 $|{{{Ro}}^{-1}}|$ as the unstable region moves to small
 $\beta$; this is understood by the expression of the growth rate (3.13) since the difference between
 $2\varOmega _p$ and
 $\omega _z$ decreases as
 $\beta$ decreases. Figure 8(b) suggests that the relation between
 $C_{C}$ and
 ${{{Ro}}^{-1}}$ can be approximated as
 \begin{equation} C_{C} \propto 1-\frac{|{{{Ro}}^{-1}}|}{\omega_{max}}, \end{equation}
which can be applicable when vorticity is non-negative and decreases monotonically with  $\beta$. However, it is not easy to find an explicit relation analytically since it depends on the velocity distribution of the vortex in a nonlinear way.
The numerical results obtained by local stability analysis in this subsection are in good agreement with predictions in § 3. Occurrence of each instability, its growth rate and their dependence on rotation and stratification have been elucidated in detail. However, these results should be checked by modal stability analysis, as is done in the next subsection.
5.2. Results of modal stability analysis
In this subsection, we show the results of modal stability analysis of the 2-D Taylor–Green vortices. Two remarks are made before presenting the results. One is about symmetry of the modes. The 2-D Taylor–Green vortices possess several symmetries in the absence of rotation (Sipp et al. Reference Sipp, Lauga and Jacquin1999; Suzuki et al. Reference Suzuki, Hirota and Hattori2018; Hattori et al. Reference Hattori, Suzuki, Hirota and Khandelwal2021). However, rotation breaks mirror symmetry with respect to  $x=mL_x/2$ and
 $y=nL_y/2$, where
 $m$ and
 $n$ are integers. The symmetries that survive under rotation are translations
 $(x, y; \omega _z) \to (x+n(L_x/2), y\pm n(L_y/2); \omega _z)$ and a
 ${\rm \pi}$ rotation
 $(x, y; \omega _z) \to (-x, -y; \omega _z)$. Thanks to the latter symmetry, the unstable modes can be classified into symmetric and anti-symmetric modes: the mode is symmetric when it satisfies
 \begin{gather} u'(-x,-y,z)=-u'(x,y,z), \quad v'(-x,-y,z)=-v'(x,y,z), \end{gather}
 \begin{gather} w'(-x,-y,z)=w'(x,y,z), \quad \rho'(-x,-y,z)=\rho'(x,y,z), \end{gather}
while it is anti-symmetric when it satisfies
 \begin{gather} u'(-x,-y,z)=u'(x,y,z), \quad v'(-x,-y,z)=v'(x,y,z), \end{gather}
 \begin{gather} w'(-x,-y,z)=-w'(x,y,z), \quad \rho'(-x,-y,z)=-\rho'(x,y,z). \end{gather}
One of the above sets of conditions was imposed to obtain the modes of each symmetry separately. The other remark is that we cannot distinguish between the cyclonic ( $Ro>0$) and the anti-cyclonic (
 $Ro<0$) modes rigorously; since the 2-D Taylor–Green vortices consist of vortices with positive vorticity and those with negative vorticity located in a staggered arrangement, the unstable modes have non-vanishing amplitudes both in the cyclonic vortices and in the anti-cyclonic vortices in general. This is indeed the case for weak rotation; as wee see below, however, the modes are nearly cyclonic or anti-cyclonic when rotation is strong. To see whether the mode is cyclonic, anti-cyclonic or in-between, we define the enstrophy ratio by
 \begin{equation} \phi = \frac{\varPhi_1}{\varPhi_1+\varPhi_2}, \quad \varPhi_i = \int_{D_i} |\boldsymbol{\omega}'|^2 \,{\rm d}x\,{\rm d}y\,{\rm d}z, \end{equation}
where  $D_1$ and
 $D_2$ are the domains occupied by anti-clockwise and clockwise vortices, respectively,
 \begin{equation} D_i = \left\{(x,y,z) \mid \frac{{\rm i}-1}{2} \le \frac{x}{L_x} \le \frac{{\rm i}}{2}, \ 0 \le \frac{y}{L_y} \le \frac{1}{2}, \ 0 \le \frac{z}{L_z} \le 1 \ \right\}. \end{equation}
The mode is nearly cyclonic when  $\phi$ is close to
 $1$, while it is anti-cyclonic when
 $\phi$ is close to
 $0$, because the sense of rotation of the system is set anti-clockwise in the following analysis.
In the modal stability analysis, the growth rate is a multi-valued function of the vertical wavenumber  $k_z$, the Rossby number
 $Ro$ and the Froude number
 $F_h$:
 $\sigma =\sigma (k_z, Ro, F_h)$. Based on the local stability results, the strength of rotation is chosen from
 $|{{{Ro}}^{-1}}| =0, 1, \ldots, 4$, while one case of vanishing or weak stratification
 ${F_h^{-1}} < \omega _{max}/2$ and another case of strong stratification
 ${F_h^{-1}} > \omega _{max}/2$ are chosen:
 ${F_h^{-1}}=0$ and
 $5$ for
 $\varepsilon _e/\omega _{max}=0$, and
 ${F_h^{-1}}=1$ and
 $5$ for
 $\varepsilon _e/\omega _{max}=0.2$. A few other cases were also considered, but the above sets of parameter values proved sufficient to elucidate the effects of rotation and stratification. The Reynolds number is fixed to
 ${{Re}}=10^5$. In the following, all modes where structures are shown are non-oscillatory (i.e. the complex parts of the eigenvalues are zero), while there also exist oscillatory modes, which are sub-dominant.
5.2.1.  $\varepsilon _e/\omega _{max}=0$

First, we show the results for  $\varepsilon _e/\omega _{max}=0$ to show how each instability appears in modal stability analysis; the difference due to the symmetry of the modes is also checked. Figure 9 shows the growth rate plotted against the vertical wavenumber
 $k_z$ in the absence of stratification (
 $F_h^{-1}=0$). The results are shown for three values of the Rossby number:
 $|Ro^{-1}|=0, 2$ and
 $4$; for each value of
 $|{{{Ro}}^{-1}}|$, symmetric and anti-symmetric modes are shown separately. The line colours show the enstrophy ratio
 $\phi$: cyclonic modes (
 $\phi =1$) and anti-cyclonic modes (
 $\phi =0$) are shown by red and blue lines, respectively. For
 ${{{Ro}}^{-1}}=0$, one symmetric mode of the pure hyperbolic instability and one anti-symmetric mode of mixed hyperbolic instability (Hattori et al. Reference Hattori, Suzuki, Hirota and Khandelwal2021) are observed (figure 9a,b). Since the mirror symmetry with respect to
 $x=mL_x/2$ and
 $y=nL_y/2$ is preserved in the absence of rotation, the enstrophy ratio is
 $\phi =0.5$ for these modes. For
 $|Ro^{-1}|=2$, all modes are due to the pure hyperbolic instability; examples of mode structures are shown in figure 10. The maximum growth rate is
 $\sigma =1.66$, which is larger than
 $\sigma =0.449$ for
 $Ro^{-1}=0$. Weak rotation breaks the balance between stretching and compression at the hyperbolic stagnation points so that many pure-hyperbolic-instability modes appear for
 $Ro^{-1} \neq 0$. There are a few differences between the symmetric and anti-symmetric modes. First, the growth rates of the anti-symmetric modes are larger than those of the symmetric modes. This is due to the symmetry conditions, which make the symmetric modes vanish at the hyperbolic stagnation points; correspondingly, the amplitude of the disturbances is small near the cell boundaries; in fact, the enstrophy ratio of symmetric modes is close to
 $0$ or
 $1$, while it takes intermediate values for the anti-symmetric modes. This reduces the growth rates of the symmetric modes (figure 9c) in comparison to the anti-symmetric modes (figure 9d) because the pure hyperbolic instability is due to stretching near the hyperbolic points. The local stability results showed that the growth rate of the pure hyperbolic instability does not depend on the sense of rotation; this explains the presence of anti-symmetric modes which span both cyclonic and anti-cyclonic vortices with
 $\phi$ close to
 $0.5$ (figure 10b).
Growth rate  $\sigma (k_z, Ro, F_h)$;
 $\varepsilon _e/\omega _{max}=0$,
 $F_h^{-1}=0$;
 $|Ro^{-1}|=$ (a,b)
 $0$, (c,d)
 $2$, (e,f)
 $4$. (a,c,e) Symmetric modes, (b,d,f) anti-symmetric modes. The colour shows the enstrophy ratio
 $\phi$.

Mode structures shown by contours of  $\omega '_z$ on the
 $xy$ plane;
 $\varepsilon _e/\omega _{max}=0, F_h^{-1}=0$ and
 $|Ro^{-1}|=1$. (a) Symmetric pure-hyperbolic-instability mode with
 $k_zL_0=62.8$,
 $\sigma =1.40$ and
 $\phi =0.925$, (b) anti-symmetric pure-hyperbolic-instability mode with
 $k_zL_0=62.8$,
 $\sigma =1.73$ and
 $\phi =0.554$. The contours of
 $\omega '_z$ are drawn for
 $|\omega '_z|/|\omega '_z|_{max} = 0.1, 0.3, 0.5, 0.7$ and
 $0.9$; the red and blue lines correspond to positive and negative values, respectively.

The growth rates for stronger rotation  $|Ro^{-1}|=4$ (figure 9e,f) are smaller than those for
 $|Ro^{-1}|=2$; the maximum is
 $\sigma =0.756$, which is
 $45\,\%$ of that for
 $|Ro^{-1}|=1$. In contrast to weaker rotation case
 $|Ro^{-1}|=2$, there is little difference between the symmetric and anti-symmetric modes. This is because the amplitude of the modes is small near the cell boundaries so that they are unaffected by the symmetry conditions. The modes are nearly cyclonic (red,
 $\phi \approx 1$) or anti-cyclonic (blue,
 $\phi \approx 0$). The pure hyperbolic instability is absent. The cyclonic modes are due to the rotational-hyperbolic instability (figure 11a), while the anti-cyclonic modes are due to the centrifugal instability (figure 11b). The maximum growth rate of the rotational-hyperbolic instability occurs at
 $k_zL_0=16.3$, while that of the centrifugal instability occurs at
 $k_zL_0=44.0$. This difference can be explained by the angle of the wavenumber vector at which the growth rate is maximum in the local stability analysis;
 $\theta _0$ is close to
 $90^\circ$ for the rotational-hyperbolic instability, while
 $\theta _0=0^\circ$ for the centrifugal instability; if we assume that the magnitude
 $k$ of the wavenumber vector is determined by the viscous diffusion and of the same order, then
 $k_z = k \cos \theta _0$ is larger for the centrifugal instability than for the rotational-hyperbolic instability. It is pointed out that there is no anti-cyclonic mode of the rotational-hyperbolic instability, for which the realizability
 $\mathcal {R}$ is small (figure 7c). Next, we show how stratification affects the stability properties. Figure 12 shows the growth rate plotted against the vertical wavenumber for the stratified case (
 $F_h^{-1}=5$). For
 ${{{Ro}}^{-1}}=0$ (figure 12a,b), several modes of the strato-hyperbolic instability and the mixed instability of the pure hyperbolic and strato-hyperbolic instabilities appear as both symmetric and anti-symmetric modes (Hattori et al. Reference Hattori, Suzuki, Hirota and Khandelwal2021).
Mode structures shown by contours of  $\omega '_z$ on the
 $xy$ plane. 2-D Taylor–Green vortices with
 $\varepsilon _e/\omega _{max}=0, F_h^{-1}=0$ and
 $|Ro^{-1}|=4$. (a) Anti-symmetric rotational-hyperbolic-instability mode with
 $k_zL_0=25.1$,
 $\sigma =0.729$ and
 $\phi =0.852$, (b) anti-symmetric centrifugal-instability mode with
 $k_zL_0=62.8$,
 $\sigma =0.626$ and
 $\phi =0$. The contours of
 $\omega '_z$ are drawn as in figure 10.

Growth rate  $\sigma (k_z, Ro, F_h)$. Two-dimensional Taylor–Green vortices with
 $\varepsilon _e/\omega _{max}=0$,
 $F_h^{-1}=5$.
 $|Ro^{-1}|=$ (a,b)
 $0$, (c,d)
 $2$, (e,f)
 $4$. (a,c,e) Symmetric modes, (b,d,f) anti-symmetric modes. The colour shows the enstrophy ratio
 $\phi$.

For  $|Ro^{-1}|=2$ (figure 12c,d), all modes are due to the pure hyperbolic instability (figure 13). The growth rates of the anti-symmetric modes are slightly smaller than those for
 $F_h^{-1}=0$, while the growth rates of the symmetric modes are further reduced. It is worth noting that the anti-cyclonic modes are nearly absent as the enstrophy ratio is larger than
 $0.5$ for most of the branches; this is associated with the asymmetric reduction of realizability by stratification observed in figure 7(c,d). As shown in figure 13, stratification compresses the modes to flatten in the
 $xy$ plane compared to the non-stratified case with the same wavenumber (figure 10) as observed in our previous work for the strato-hyperbolic instability (Hattori et al. Reference Hattori, Suzuki, Hirota and Khandelwal2021).
Mode structures shown by contours of  $\omega '_z$ on the
 $xy$ plane. Two-dimensional Taylor–Green vortices with
 $\varepsilon _e/\omega _{max}=0, F_h^{-1}=5, |{{{Ro}}^{-1}}|=1$. (a) Symmetric pure-hyperbolic-instability mode with
 $k_zL_0=62.8$,
 $\sigma =1.14$ and
 $\phi =0.915$, (b) anti-symmetric pure-hyperbolic-instability-mode with
 $k_zL_0=62.8$,
 $\sigma =1.44$ and
 $\phi =0.722$. The contours of
 $\omega '_z$ are drawn as in figure 10.

For  $|Ro^{-1}|=4$ (figure 12e,f), the growth rates are significantly reduced by stratification. There are no rotational-hyperbolic-instability modes; this is expected since the maximum growth rate as well as the realizability decrease with stratification according to the local stability analysis. The growth rate of the centrifugal instability is reduced in comparison to the non-stratified case, although the maximum growth rate obtained by local stability analysis does not depend on stratification. This point will be discussed later in § 5.3 (see also figure 18).
5.2.2. $\varepsilon _e/\omega _{max}=0.2$

Next, we show the results for  $\varepsilon _e/\omega _{max}=0.2$ to see the effects of strain. We focus on the anti-symmetric modes below since the differences due to the symmetry are similar to the case of
 $\varepsilon _e/\omega _{max}=0$.
Figure 14 shows the growth rate plotted against the vertical wavenumber  $k_z$; the results for weak stratification (
 $F_h^{-1}=1$) and strong stratification (
 $F_h^{-1}=5$) are compared. For
 ${{{Ro}}^{-1}}=0$, all modes are due to the elliptic instability for
 ${F_h^{-1}}=1$ (figure 14a), while the elliptic instability is stabilized by stratification for
 ${F_h^{-1}}=5$ (Suzuki et al. Reference Suzuki, Hirota and Hattori2018) (figure 14b); the mixed-hyperbolic-instability modes and the strato-hyperbolic-instability modes are observed as in the case of
 $\varepsilon _e/\omega _{max}=0$ and
 $F_h^{-1}=5$.
Growth rate  $\sigma (k_z, Ro, F_h)$. Two-dimensional Taylor–Green vortices with
 $\varepsilon _e/\omega _{max}=0.2$.
 $|Ro^{-1}|=$ (a,b)
 $0$, (c,d)
 $2$, (e,f)
 $4$. (a,c,e)
 $F_h^{-1}=1$, (b,d,f)
 $F_h^{-1}=5$. The colour shows the enstrophy ratio
 $\phi$.

For  $|Ro^{-1}|=2$ with
 ${F_h^{-1}}=1$ (figure 14c), most of the modes are due to the pure hyperbolic instability (figure 15a), while some modes of the elliptic instability also exist (figure 15b). The magnitude of the growth rates is comparable to the case
 $\varepsilon _e/\omega _{max}=0$ and
 $F_h^{-1}=0$ (figure 9a,b). For
 ${F_h^{-1}}=5$ (figure 14d), the pure-hyperbolic-instability modes also appear with reduced growth rates (figure 16a). The elliptic instability occurs for
 $|{{{Ro}}^{-1}}|=2$ as anti-cyclonic modes (shown by blue lines in figure 14d).
Mode structures shown by contours of  $\omega '_z$ on the
 $xy$ plane. Two-dimensional Taylor–Green vortices with
 $\varepsilon _e/\omega _{max}=0.2, F_h^{-1}=1$. All modes are anti-symmetric modes. (a) Pure-hyperbolic-instability mode with
 $|{{{Ro}}^{-1}}|=2$,
 $k_zL_0=62.8$,
 $\sigma =1.42$ and
 $\phi =0.441$; (b) elliptic-instability mode with
 $|{{{Ro}}^{-1}}|=2$,
 $k_zL_0=13.8$,
 $\sigma =0.867$ and
 $\phi =0$; (c) rotational-hyperbolic-instability mode with
 $|{{{Ro}}^{-1}}|=3$,
 $k_zL_0=25.1$,
 $\sigma =0.576$ and
 $\phi =0.896$; (d) centrifugal-instability mode with
 $|{{{Ro}}^{-1}}|=4$,
 $k_zL_0=62.8$,
 $\sigma =0.394$ and
 $\phi =0$. The contours of
 $\omega '_z$ are drawn as in figure 10.

Mode structures shown by contours of  $\omega '_z$ on the
 $xy$ plane. Two-dimensional Taylor–Green vortices with
 $\varepsilon _e/\omega _{max}=0.2, F_h^{-1}=5$. All modes are anti-symmetric modes. (a) Pure-hyperbolic-instability mode with
 $|{{{Ro}}^{-1}}|=2$,
 $k_zL_0=62.8$,
 $\sigma =1.11$ and
 $\phi =0.572$; (b) elliptic-instability mode with
 $|{{{Ro}}^{-1}}|=3$,
 $k_zL_0=62.8$,
 $\sigma =1.01$ and
 $\phi =0$. The contours of
 $\omega '_z$ are drawn as in figure 10.

For  $|Ro^{-1}|=4$ with
 ${F_h^{-1}}=1$ (figure 14e), the rotational-hyperbolic instability appears at low wavenumbers
 $k_zL_0 \approx 30$ and the centrifugal instability appears for
 $k_zL_0 \gtrsim 20$ as in the case of
 $\varepsilon _e/\omega _{max}=0$,
 $F_h^{-1}=0$ and
 $|Ro^{-1}|=4$, although the growth rates are smaller. An example of the rotational-hyperbolic-instability modes shown in figure 15(c) is similar to that for
 $\varepsilon _e/\omega _{max}=0$ (figure 11a), while that of the centrifugal-instability modes shown in figure 15(d) is similar to that for
 $\varepsilon _e/\omega _{max}=0$ (figure 11b) except for the aspect ratio in the
 $xy$ plane. For
 ${F_h^{-1}}=5$, however, most of the modes are due to the elliptic instability (figure 16b), while a few modes of the centrifugal instability are observed; no rotational-hyperbolic-instability mode is observed. These are in accordance with the local stability results.
The mode structures of the centrifugal instability for weak stratification shown in figure 15(c,d) are similar to those obtained by Sipp et al. (Reference Sipp, Lauga and Jacquin1999) in the absence of stratification. The elliptic-instability mode shown in figure 15(a,b) is also similar to that of Sipp et al. (Reference Sipp, Lauga and Jacquin1999), although the disturbance has wider distribution in our case; we must also take into account that the mode of Sipp et al. (Reference Sipp, Lauga and Jacquin1999) is shown by energy. The hyperbolic instabilities were not identified as a mode by Sipp et al. (Reference Sipp, Lauga and Jacquin1999); we will confirm the origin of the instabilities including the hyperbolic instabilities in the next subsection.
5.3. Comparison between local and modal stability analysis
In this subsection, we compare the local stability results and the modal stability results. Direct correspondence between the local and modal stability analysis would give a firm physical origin of the unstable modes found in the modal stability analysis because the mechanism of the instability is clear in the local stability analysis. Conversely, it further supports the usefulness of the local stability analysis.
Figure 17 compares the structures of unstable modes to the corresponding solutions to the local stability equations for four cases: the rotational-hyperbolic-instability mode for  $({F_h^{-1}}, {{{Ro}}^{-1}})=(0, 4)$ shown in figure 11(a), the centrifugal-instability mode for
 $({F_h^{-1}}, {{{Ro}}^{-1}})=(0, -4)$ shown in figure 11(b), the pure-hyperbolic-instability mode for
 $({F_h^{-1}}, {{{Ro}}^{-1}})=(5, 1)$ shown in figure 13(b) and the elliptic-instability mode for
 $({F_h^{-1}}, {{{Ro}}^{-1}})=(5, -3)$ shown in figure 16(b). The strato-hyperbolic instability is omitted because it has been already investigated by Suzuki et al. (Reference Suzuki, Hirota and Hattori2018) and Hattori et al. (Reference Hattori, Suzuki, Hirota and Khandelwal2021). The horizontal divergence
 $\boldsymbol {\nabla }_h \boldsymbol {\cdot } \boldsymbol {u}'_h={\partial u'}/{\partial x}+{\partial v'}/{\partial y}$, the vertical component of vorticity
 $\omega '_z$ and the density
 $\rho '$ of the unstable mode on a streamline of nearly largest amplitude of
 $\omega '_z$ are plotted against time of fluid particle motion which is dictated by (2.15) (figure 17a,c,e,g); the corresponding variables
 $p$,
 $q$ and
 $s$ defined by (2.19a–c) of the solution to the local stability equations on the same streamline are shown in figure 17(b,d,f,h), where the values are multiplied by
 ${\rm e}^{-\sigma t}$ to compensate the exponential growth. The values are normalized by the maximum values to resolve arbitrariness of the initial amplitudes in the linear stability analysis. We observe good agreement between the modal and local results; there are some differences in amplitude ratios, but the shapes of the curves are in excellent agreement. Differences between the instabilities are also elucidated; the change in phase is
 $4{\rm \pi}$ for the rotational-hyperbolic and the pure-hyperbolic-instability modes and
 $2{\rm \pi}$ for the elliptic-instability mode, while the variables do not change their signs for the centrifugal-instability mode. These results establish the correspondence between local and modal stability results, clarifying the physical origin of each instability.
Comparison between modal and local stability analysis. (a,c,e,g) Values of  $\boldsymbol {\nabla }_h \boldsymbol {\cdot } \boldsymbol {u}'_h={\partial u'}/{\partial x}+{\partial v'}/{\partial y}$,
 $\omega '_z$ and
 $\rho '$ of the unstable eigenmode obtained by modal stability analysis are shown as a function of time of a fluid particle on the streamline where
 $\omega '_z$ is maximum. (b,d,f,h) Corresponding values of
 $p$,
 $q$ and
 $s$ on the same streamline are multiplied by
 ${\rm e}^{-\sigma t}$ to compensate the exponential growth. (a,b) Rotational-hyperbolic-instability mode with
 $\varepsilon _e/\omega _{max}=0$,
 $F_h^{-1}=0$,
 ${{{Ro}}^{-1}}=4$,
 $k_zL_0=25.1$,
 $\sigma =0.729$ and
 $\beta =0.9$; (c,d) centrifugal-instability mode with
 $\varepsilon _e/\omega _{max}=0$,
 $F_h^{-1}=0$,
 ${{{Ro}}^{-1}}=-4$,
 $k_zL_0=62.8$,
 $\sigma =0.626$ and
 $\beta =0.775$; (e,f) pure-hyperbolic-instability mode with
 $\varepsilon _e/\omega _{max}=0$,
 $F_h^{-1}=5$,
 ${{{Ro}}^{-1}}=1$,
 $k_zL_0=62.8$,
 $\sigma =1.44$ and
 $\beta =0.9$; (g,h) elliptic-instability mode with
 $\varepsilon _e/\omega _{max}=0.2$,
 $F_h^{-1}=5$,
 ${{{Ro}}^{-1}}=-3$,
 $k_zL_0=62.8$,
 $\sigma =1.01$ and
 $\beta =0.225$.

Figure 18 compares the growth rates obtained by the local and modal stability analysis; the growth rate  $\sigma _{max}(Ro, F_h)$ obtained by local stability analysis is shown by lines as a function of
 ${{{Ro}}^{-1}}$ for each instability, while the maximum growth rate obtained by modal stability analysis is shown for selected values of
 ${{{Ro}}^{-1}}$ by solid circles. For the latter, the corrected growth rate in the absence of viscous effects was also estimated by subtracting the viscous contribution as
 \begin{equation} \sigma_{inv} = \sigma - \frac{1}{{{Re}}} \frac{\int \boldsymbol{u'}\boldsymbol{\cdot} \nabla^2 \boldsymbol{u'} \,{\rm d}x\,{\rm d}y\,{\rm d}z}{\int |\boldsymbol{u'}|^2 \,{\rm d}x\,{\rm d}y\,{\rm d}z} \end{equation}
and is included as open circles; it should be noted that this does not coincide with the inviscid limit since the mode structures and the wavenumber are affected by viscous effects. The modal stability growth rates are smaller than  $\sigma _{max}(Ro, F_h)$ except for the special case of the pure hyperbolic instability at
 ${{{Ro}}^{-1}}=0$; this is reasonable since the modal stability growth rate cannot exceed the local stability results. The ratio of the growth rate is between
 $57\,\%$ and
 $99\,\%$ for weak stratification (figure 18a,b), while it drops to
 $24\,\% \sim 68\,\%$ for the pure hyperbolic and centrifugal instabilities for strong stratification (figure 18c,d). The corrected growth rate of the elliptic instability is close to the local stability results. For the centrifugal instability, the corrected growth rate is close to the local stability results for weak stratification; however, the differences are remarkable for strong stratification. As shown by Yim & Billant (Reference Yim and Billant2016), the growth rate of the centrifugal instability is damped by viscous effects even at high Reynolds numbers for strong stratification since the wavenumber giving the maximum growth rate scales as
 $k \propto (Re/F_h)^{1/3}$ and is large. The differences would decrease for much higher Reynolds numbers and a wider range of wavenumbers; this may also be the case for the hyperbolic instabilities, although higher resolution is required to confirm it numerically.
Growth rate  $\sigma _{max}(Ro, F_h)$ as a function of
 $Ro$. Comparison between local stability analysis (lines) and modal stability analysis (solid circles); the growth rate for the inviscid case is also estimated by subtracting the viscous contribution for the modal stability analysis (open circles). (a)
 $\varepsilon _e/\omega _{max}=0$,
 $F_h^{-1}=0$; (b)
 $\varepsilon _e/\omega _{max}=0.2$,
 $F_h^{-1}=1$; (c)
 $\varepsilon _e/\omega _{max}=0$,
 $F_h^{-1}=5$; (d)
 $\varepsilon _e/\omega _{max}=0.2$,
 $F_h^{-1}=5$.

6. Concluding remarks
The linear stability of an array of vortices in rotating stratified fluids has been studied by local and modal stability analysis. The 2-D Taylor–Green vortices are chosen as a base flow. The growth rate and the conditions of each instability are first estimated in the short-wave limit. Next, they are investigated numerically by local stability analysis and modal stability analysis. Several types of instability are identified: the pure hyperbolic instability, the strato-hyperbolic instability, the rotational-hyperbolic instability, the centrifugal instability and the elliptic instability; there are also a few instabilities which consist of two of the above instabilities (mixed hyperbolic instability in figure 9a,b and the mixed instability of the pure hyperbolic and strato-hyperbolic instabilities in figure 12a,b). The zigzag and radiative instability were not found in the present work. The zigzag instability has been found for a vortex pair; it may be absent for the 2-D Taylor–Green vortices because of strong symmetry imposed by double periodicity. It may not be easy to find the radiative instability in the present case because it is not a strong instability (Park & Billant Reference Park and Billant2013). The characteristics of the instabilities and the effects of stratification and rotation are investigated in detail. In the absence of stratification, the pure hyperbolic instability is dominant when rotation is weak, although it vanishes in the non-rotating case; it is stabilized for strong rotation. For strong anti-cyclonic rotation, the elliptic instability or the centrifugal instability becomes dominant depending on the parameter values; further stronger rotation stabilizes both instabilities. For strong cyclonic rotation, the rotational-hyperbolic instability or the elliptic instability becomes dominant, although the growth rate of the latter is smaller than the anti-cyclonic case. When stratification is present, the strato-hyperbolic instability occurs for weak rotation. The rotational-hyperbolic instability and the elliptic instability under cyclonic rotation are weakened by stratification. The pure hyperbolic instability and the centrifugal instability are less affected by stratification, while the mode structures are flattened. Stratification also changes the instability condition of the elliptic instability under anti-cyclonic rotation; although it almost reverses the instability condition at 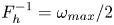 ${F_h^{-1}} = \omega _{max}/2$, it has been found that the unstable region extends to
 ${{{Ro}}^{-1}} \approx 0$ near
 $\theta _0=0^\circ$ in the local stability analysis.
We emphasize that the whole picture of the instability of an array of vortices in rotating stratified fluids has been elucidated. The instability condition and the growth rate depend on the rotation of the system, the magnitude of stratification and the vorticity distribution. The important parameters of the vorticity distribution are the strain rates at the hyperbolic and elliptic stagnation points and the maximum vorticity. The estimates based on the local stability analysis summarized in table 1 are not only in good agreement with the local stability results but also consistent with the modal stability results, whereas some differences remain at a finite Reynolds number as high as  ${{Re}}=10^5$. They would serve as useful sources of information for the instability of vortices in rotating stratified fluids in general and should be valuable for understanding their dynamics.
Another important contribution of the present work is the discovery of the rotational-hyperbolic-instability modes. Although the rotational-hyperbolic instability appeared in the investigation of Sipp et al. (Reference Sipp, Lauga and Jacquin1999) without much attention and was studied by Godeferd et al. (Reference Godeferd, Cambon and Leblanc2001) by local stability analysis, the actual mode has been found for the first time in the present work to the best of the authors’ knowledge. In addition, it has been further shown that the local stability analysis not only serves as a powerful tool for parametric study but also provides physical insight into the instabilities. Introduction of the realizability  ${\mathcal {R}}$ proved helpful for interpreting the modal stability results at finite Reynolds numbers based on the local stability results.
Some future works are listed below. The effects of rotation and stratification on other flows possessing hyperbolic stagnation points, which include the Stuart vortices, vortex pairs and wake vortices such as the von Kármán vortex street, are of interest. How each instability evolves in the nonlinear regime is also of great interest. Some of them can destroy vortices, while some can promote merging of vortices or creation of strong vorticity (Hattori Reference Hattori2016, Reference Hattori2018), which will be studied by direct numerical simulation. In reality, the effects of non-uniform stratification and those of variation of the Coriolis parameter ( $\beta$-effect) would be important; in-plane stratification would also be of great interest, although the base flow should be carefully chosen. They will be also investigated as future works.
Funding
This work was supported by JSPS KAKENHI 17K05561. Numerical calculations were performed on AFI-NITY at the Institute of Fluid Science, Tohoku University.
Declaration of interests
The authors report no conflict of interest.



