

Political scientists are devoting much effort to assessing the impact of religiosity on American political life (e.g., Brint and Schroedel Reference Brint and Schroedel2011; Domke and Coe Reference Domke and Coe2008; Kellstedt Reference Kellstedt, Leege and Kellstedt1993; Putnam and Campbell Reference Putnam and Campbell2010; Wald and Calhoun-Brown Reference Wald and Calhoun-Brown2014; Wilcox and Robinson Reference Wilcox and Robinson2010). So far, these scholars have shown that cues from religious leaders, denomination-specific worldviews, social networks within churches, and the extent to which religiously derived opinions are reinforced in the larger community can all strongly shape political attitudes and behaviors (e.g., Adkins et al. Reference Adkins, Layman, Campbell and Green2013; Djupe and Gilbert Reference Djupe and Gilbert2009; Jelen Reference Jelen1993; Kaufmann Reference Kaufmann2002; Layman Reference Layman1997; McDaniel, Nooruddin, and Shortle Reference McDaniel, Nooruddin and Shortle2011; Putnam and Campbell Reference Putnam and Campbell2010). Religiosity influences how progressive a person's views are likely to be on a wide range of political issues, including beliefs about the capabilities of female political leaders (Setzler and Yanus Reference Setzler and Yanusn.d.) and the desirability of pursuing policies to enhance racial and gender equality (Edgell and Tranby Reference Edgell and Tranby2007; McKenzie and Rouse Reference McKenzie and Rouse2013). Religious engagement and denominational backgrounds also affect many political behaviors, including the likelihood of voting (Smidt, Kellstedt, and Guth Reference Smidt, Kellstedt, Guth, Smidt, Kellstedt and Guth2009) and participation rates in most types of nonelectoral political activities (Driskell, Embry, and Lyon Reference Driskell, Embry and Lyon2008).
One area of behavioral research that might benefit from looking more closely at the influence of religion is the long-standing effort to better understand why so few women enter or win congressional elections. Presently, just one in five U.S. representatives are women, and this gender gap is unlikely to close anytime soon. For the four elections examined in this study, just 19% of the nearly 2,873 Democrats who entered House primaries were female, while women made up just 10% of the 3,326 Republican candidates. Seeking to explain the scarcity of female candidates and nominees, scholars have made much progress in identifying the personal characteristics that leave some voters less disposed to support female candidates (e.g., Anderson, Lewis, and Baird Reference Anderson, Lewis and Baird2011; Dolan Reference Dolan2010, Reference Dolan2014; Koch Reference Koch2002; Sanbonmatsu Reference Sanbonmatsu2002). Other researchers have pinpointed a set of macro-level factors that help explain why women run and perform so much better in some districts than they do in others (e.g., Lawless and Pearson 1998; Ondercin and Welch Reference Ondercin and Welch2009; Palmer and Simon Reference Palmer and Simon2012). Thus far, however, religious factors have barely entered into the discussion of why some congressional electorates are particularly warm or hostile to women candidates.
The central purpose of this article is to begin to fill this gap in the literature by exploring how the overall religiosity of a congressional district, as well as the proportion of its residents who belong to each of America's three largest denominations, can influence the presence and electoral success of women in U.S. House races. My study analyzes how variations in a district's religious environment impact women at each of the three main stages of the electoral process: the decision to enter a primary, securing a party's nomination, and, finally, winning the general election. Using data from a nationwide census of religious congregations, the analyses incorporate measures of each district's religious adherence rates and similar indicators that assess the strength of Roman Catholicism, evangelical Protestantism, and mainline Protestantism. The study spans the four sets of primary and general elections for the House held between 2006 and 2012.
WHY SHOULD A DISTRICT'S RELIGIOUS ENVIRONMENT MATTER FOR FEMALE CANDIDATES?
While the literature on female candidates has largely overlooked religious variables, research in related areas provides a compelling reason for investigating how a community's religious environment affects the recruitment of female politicians and their electoral success. We already know that religious actors are strongly positioned and often inclined to shape candidate and voter behaviors. Churches are the only institutions in many communities that are comparable to political parties with respect to their mobilizational resources and access to large bodies of receptive constituents (Wald, Owen, and Hill Reference Wald, Owen and Hill1988). Moreover, cues from religious leaders, church doctrines, and especially church-based social networks are a prime source of political information for many people (Adkins et al. Reference Adkins, Layman, Campbell and Green2013; Calfano and Djupe Reference Calfano and Djupe2011; Djupe and Gilbert Reference Djupe and Gilbert2009; Smith Reference Smith2010). Recent years have seen an upsurge in church-based political activity across the nation with the goal of securing electoral outcomes that are in line with traditional views of the nuclear family and a woman's role in it (Clarkson Reference Clarkson2013; Domke and Coe Reference Domke and Coe2008; Kaufmann Reference Kaufmann2002; Vogel Reference Vogel2014). In the 2012 cycle, one particularly powerful advocacy group—the Faith and Freedom Coalition—worked with local religious leaders to contact more than 120 million evangelicals and Catholics, and the group distributed 30 million voting guides in some 100,000 churches (Goodstein Reference Goodstein2012; see also Vogel Reference Vogel2014).
Many churches have internal decision-making structures and worldviews that question the value of female leadership in the public sphere, and studies indicate that religiously active individuals are less likely than others to hold egalitarian views of gender roles. Scholars account for this difference by observing that a majority of American church attendees are broadly exposed to messages, situations, and worldviews that both model and justify patriarchal divisions of authority (Davis and Greenstein Reference Davis and Greenstein2009). Thus, people who attend religious services regularly “are much more likely to support the idea that men are supposed to inhabit the public sphere while women are meant to take care of the domestic or private sphere” (Whitehead Reference Whitehead2012, 141). Religious exposure is a critical variable in the transmission and continued reinforcement of patriarchal values because in order “to maintain traditional gender role beliefs, no matter the religious tradition, individuals must have regular interaction with like-minded individuals” (Whitehead Reference Whitehead2012, 141).
Surveys confirm that female politicians in more religious districts face electorates that disproportionately believe that women should adhere to traditional social roles and that female political leaders are less effective. For example, a 2008 Pew Research Center survey asked respondents whether women “should return to their traditional roles.” Just 11% of respondents who did not regularly attend worship services and who were religiously unaffiliated said that women should adhere to traditional roles. In contrast, 27% of religiously active respondents thought that women should keep to traditional activities. Pew researchers also asked whether the underrepresentation of women in national political offices was because “Generally speaking, women don't make as good leaders as men.” Of the religiously unaffiliated respondents, 70% rejected this explanation for female underrepresentation, whereas only half of religious respondents did so. Religious respondents also were much more likely than nonreligious individuals to tell researchers that female politicians are “not tough enough” to hold national political office (Setzler and Yanus n.d.).
Of course, not all of America's religious traditions are committed to preserving traditional gender roles, and many congregations outright reject any form of patriarchy (CBE 2007). The major denominational branches in the United States differ in their core social values, how much gender-based discrimination is practiced within their churches, and the extent to which their followers apply their traditions' religious doctrines to make judgments about the activities of society as a whole (McDaniel, Nooruddin, and Shortle Reference McDaniel, Nooruddin and Shortle2011; Smidt, Kellstedt, and Guth Reference Smidt, Kellstedt, Guth, Smidt, Kellstedt and Guth2009). Because of this, religion and politics scholars have urged social scientists to augment generic indicators of religious activity with a mix of denomination-specific indicators when trying to explain political behaviors (Smidt, Kellstedt, and Guth Reference Smidt, Kellstedt, Guth, Smidt, Kellstedt and Guth2009). Indeed, studies comparing evangelicals, Catholics, and mainline Protestants frequently report large differences across the three groups (Driskell and Lyon 2008; Layman Reference Layman1997; Smith and Walker Reference Smith and Walker2013).
One important area of difference among America's largest religious denominations is in the messages that their adherents hear and observe regarding the appropriateness and capabilities of female leaders. More than half of the nation's faithful individuals belong to evangelical Protestant or Catholic congregations that explicitly exclude women from all top leadership posts (CBE 2007). Church leaders rationalize patriarchal decision-making structures within their congregations as being morally desirable and consistent with divinely allocated traits, roles, and competencies that differ by gender (Deckman Reference Deckman and O'Connor2010; Hunt Reference Hunt and O'Connor2010; Whitehead Reference Whitehead2013; Wilcox, Chaves, and Franz Reference Wilcox, Chaves and Franz2004). Nevertheless, one of the key ways that evangelical Protestantism distinguishes itself from both the mainline branch and Roman Catholicism is its stricter doctrinal assumptions regarding the desirability of limiting female leadership in public activities outside the home (Deckman Reference Deckman and O'Connor2010; Merolla, Schroedel, and Waller Reference Merolla, Schroedel, Waller, Brint and Schroedel2009; Wilcox, Chaves, and Franz Reference Wilcox, Chaves and Franz2004). In contrast, Roman Catholicism has become increasingly circumspect in making claims that patriarchal power arrangements should extend to public roles other than holding clerical appointments. Scholars point to the shortage of male priests to explain why Catholic leaders have become more open to women taking on lay leadership roles, even as “the stark reality is that ultimate decisions on almost all fronts are still reserved to the all-male clergy” (Hunt 2009, 490). On the most progressive end of the spectrum, most—but not all—mainline Protestant congregations have embraced gender equality in both the pulpit and larger society as desirable goals. Although women are still underrepresented within the leadership ranks of most mainline churches, substantial numbers of Protestant women have moved into the clergy and other top leadership roles (Deckman Reference Deckman and O'Connor2010).
WHAT WE STILL DO NOT KNOW ABOUT THE CAUSES OF FEMALE POLITICAL UNDERREPRESENTATION
By asking how a congressional district's religious environment impacts female candidates, my research engages several long-standing areas of scholarly inquiry. First, a great number of gender and politics researchers have investigated the sources of individual-level prejudices toward female politicians running for Congress. Their work shows that various demographic, socioeconomic, and political factors shape how people think about women candidates (e.g., Anderson, Lewis, and Baird Reference Anderson, Lewis and Baird2011; Dolan Reference Dolan2010, 2014; Fulton Reference Fulton2014; Koch Reference Koch2002; Sanbonmatsu Reference Sanbonmatsu2002). So far, however, the analysis of religious variables is largely missing from the scholarship on voters' gender biases in congressional voting. In all but a handful of the dozens of previous experimental and survey-based studies looking at gender stereotyping in politics, scholars have not even considered the possibility that religious identities leave some groups of voters primed to reject candidates who deviate from traditional gender role expectations (but see Setzler and Yanus Reference Setzler and Yanus2015). In the few studies that control for an aspect of religiosity, most researchers operationalize the concept with an interval measure that looks at the frequency of church attendance (Lawless Reference Lawless2004; Sanbonmatsu Reference Sanbonmatsu2002) or prayer (Dolan Reference Dolan1998). This method, however, cannot assess the potential consequences of religious ties to congregations that explicitly ban women from leadership positions or that teach and justify patriarchal worldviews.
Another body of research on female congressional candidate success focuses on variations among district characteristics to explain the emergence and success of women candidates. Here, scholars find that a variety of economic, demographic, and political factors make districts more or less likely to recruit, nominate, and elect women (e.g., Lawless and Fox Reference Lawless and Fox2010; Lawless and Pearson Reference Lawless and Pearson2008; Ondercin and Welch Reference Ondercin and Welch2009; Palmer and Simon Reference Palmer and Simon2012). However, like the work on gender stereotyping, this line of inquiry has yet to closely consider the impact of macro-level variations in religious exposure or the influence of specific denominations within communities.
A number of studies looking at women's representation at the state level indicate that this oversight is a problem. Work by Vandenbosch (Reference Vandenbosch1996), for example, finds that states with high membership rates in Christian congregations, especially in nonegalitarian denominations, elect fewer female state legislators than less religious areas. Merolla and colleagues similarly show that states with larger proportions of evangelical Protestants and Catholics have fewer female officials at almost all levels of government (Merolla, Schroedel, and Waller Reference Merolla, Schroedel, Waller, Brint and Schroedel2009; see also Merolla, Schroedel, and Holman Reference Merolla, Schroedel and Holman2007). Unfortunately, the existing research on macro-level differences in religiosity has been of limited use to congressional scholars because of its lack of any congressional district-level measures of religiosity, heavy focus on state-level outcomes, and exclusive consideration of general elections.
Much of the recent work on the electoral difficulties of female congressional candidates has explored the substantially different political environments for women politicians in the two major parties. Scholars find that even after controlling for a host of socioeconomic factors, Democrats are more interested in electing women than Republicans (Hayes Reference Hayes2011; Sanbonmatsu and Dolan Reference Sanbonmatsu and Dolan2009). Work by Winter shows that the major parties now differ so much in their willingness to support women candidates that most voters see Democrats as “the more feminine party,” while “Republicans are the more masculine” (Reference Winter2010, 588). To date, these scholars have yet to investigate whether religious differences across the major parties' electorates play a major role in why Republican voters are so much less supportive of women candidates. Yet one of the most striking dissimilarities between the current Democratic and Republican electorates is the religiosity of their typical voter. Researchers at the Brookings Institution report that a strong majority (57%) of Republicans are “theological conservatives” because of the rigid orthodoxy of their religious beliefs (Dionne et al. Reference Dionne, Galston, Davis and Tilchin2014, 28). By contrast, just one in three Democrats are theological conservatives, a share that is balanced by nonreligious (17%) and theologically liberal (21%) individuals. The religious homogeneity of the Republican electorate is especially evident among primary voters. In exit surveys from 2012, for example, a majority of Republican primary voters were white evangelical Christians, despite the fact that less than one-quarter of the general population falls into this category (Edsall Reference Edsall2012).
HYPOTHESES, DATA, AND MEASUREMENT
The discussion so far suggests that we need to know more about how religiosity impacts women congressional candidates; however, enough research already has been done in related areas to yield several testable hypotheses on what this relationship should look like. My core expectation is that districts that have larger population shares of religious adherents will be less likely to have female candidates in their primaries and less likely to nominate or elect women.
The analyses also will test three secondary hypotheses related to factors that may mediate the effect of a district's religious environment on women candidates. First, I anticipate that districts with a relatively high proportion of residents who are evangelical Protestants should be unusually hostile to women candidates compared with districts that have larger Catholic and especially mainline Protestant populations. Highly evangelical communities should pose the biggest challenge for female politicians because so many churches in this tradition both ban women from leadership positions and actively seek to maintain traditional gender roles throughout society. At the other end of the spectrum, most mainline Protestant congregations permit women to hold positions of authority and advocate gender equality in and outside of religious life, so having more mainline Protestants in a district should not be harmful to women candidates.
Second, the influence of a district's religious environment on female candidacies and nominations also should vary across the two major parties' primaries. Scholars have noted that the Democratic and Republican parties emphasize a distinctive set of priorities with respect to gender equality, and women candidates typically face more challenges in winning the support of Republican primary voters than Democrats. For our purposes, however, the existing work is less helpful in predicting which party's primaries should be most affected by religiosity or denominational differences. On the one hand, it is consistent with the scholarship reviewed earlier to anticipate that the more religious, more evangelical electorate found in Republican primaries will prove to be especially problematic for female candidates. On the other hand, because the typical Republican primary voter is so much more religious than the electorate as a whole, it may well be that a relatively less supportive electorate for women is the norm in Republican primaries regardless of the particular religious composition of individual districts.
Finally, previous research suggests that religious differences among districts should have the most influence on female candidacy and electoral success in the earliest stages of the election cycle when voters know the least about the candidates. Researchers have documented in other contexts that faith-based political cues are most consequential in electoral settings marked by low voter knowledge, few policy differences among candidates, and sparse media attention (Adkins et al. Reference Adkins, Layman, Campbell and Green2013; Jelen Reference Jelen1993). These conditions all apply most strongly in primaries, where voters typically receive minimal party guidance and many voters need extra motivation to make it to the polls (Dominguez Reference Dominguez2011; McDermott Reference McDermott1997).
The Presence and Success of Female Candidates
My analyses test these hypotheses by looking at three dependent variables: (1) whether at least one woman entered a district's Democratic/Republican primary, (2) whether a woman was nominated in the Democratic/Republican primary, and (3) whether a woman was elected to Congress. The Center for American Women and Politics (CAWP) provided all of the data necessary to create these indicators. CAWP datasheets list the names and partisanship of all female primary candidates in each district for each of the elections held between 2006 and 2012,Footnote 1 and I verified their candidate list for each cycle against the candidate rosters that states submitted to the Federal Election Commission (FEC), which facilitated the elimination of candidates who ran only in special election contests or who filed but then withdrew before their primary. CAWP materials also provided the data to identify female primary and general election winners. As the study's dependent variables are all dichotomous, they are all dummy coded 0–1.
Measuring a District's Religiosity and the Presence of Different Denominations
Testing my main argument requires a measurement of each district's overall religiosity, which I operationalized as the percentage of a district's residents who are affiliated with any religious congregation. To explore the strength of different denominations in the districts, I created similarly coded indicators for the percentage of each district's residents who are mainline Protestants, evangelical Protestants, or Roman Catholics. Nearly 90% of Americans who are religiously affiliated belong to one of these three religious groups.
The source for the district-level religion indicators is the 2000 and 2010 editions of the Religious Congregations and Membership Study (RCMS). The Association of Statisticians of American Religious Bodies (ASARB) administers this decennial census of religious congregations, and its results are used widely in research by demographers because it is the most reliable source of community-level religious membership estimates for the entire United States (Grammich et al. Reference Grammich, Hadaway, Houseal, Jones, Krindatch, Stanley and Taylor2012; Lim Reference Lim2013). ASARB analysts have coded the data so that county-level population estimates for 256 distinct religions are collapsed into the major U.S. religious traditions, as specified in Steensland et al.'s (Reference Steensland, Robinson, Wilcox, Park, Regnerus and Woodberry2000) widely used categorization scheme. In 2010, the RCMS reported that 48.8% of Americans were affiliated with a religious congregation of any type. Roman Catholics made up 19.1% of the nation's population, while evangelical and mainline Protestants comprised 16.2% and 7.3%, respectively. Data quality analyses of the RCMS report that these adherence figures are in line with the denominational breakdowns found in large-N surveys of the percentage of Americans in these denominations who regularly attend services (Lim Reference Lim2013).
Using county-to-district relationship files from the U.S. Census Bureau, I mapped the RCMS's county-level data onto the appropriate congressional districts for each of the 2006–2012 electoral cycles.Footnote 2 When year-specific information is not available between decennial censuses, demographers typically create intercensual population estimates by combining and adjusting data collected from before and after the specific years for which estimates are needed (Adler Reference Adler2002; U.S. Census Bureau 2012). As it was not clear at what rate each district's different religious group populations were shifting between the 2000 and 2010 editions of the RCMS, it was prudent to assume the 2000 census might yield better population estimates for some years and religious groups, while the 2010 results would probably be better for others, especially for the elections closest to when the RCMS was readministered in 2010. Accordingly, the indicators for each electoral cycle proportionally combine data from two RCMS editions, reflecting how far into the decade each election took place. Thus, for the 2006 cycle, each district's religious indicators weigh data from the two RCMS surveys by 0.4 (2000) and 0.6 (2010). For 2008, the estimates weight the RCMS data by 0.2 (2000) and 0.8 (2010). Both the 2010 and 2012 measures rely on the 2010 RCMS exclusively.
Isolating the Effects of Religiosity
Previous research has shown that assessing the effects of a district's religiosity on women candidates also requires controls for a variety of socioeconomic factors. An additive index containing 12 such variables has been analyzed extensively in the research by Palmer and Simon (Reference Palmer and Simon2006, 2012). Their work has been praised for its comprehensive identification of the demographic characteristics that make some congressional districts unusually receptive or hostile to women candidates. These authors' methodology is directly replicated in Ondercin and Welch's (Reference Ondercin and Welch2009) study of female congressional candidate performance between 1992 and 2000, and it is largely reproduced in the analyses here.
Palmer and Simon survey the relevant literature in detail and show in their own analyses that congresswomen are most likely to be elected from geographically smaller districts that are more urban, have a higher share of college graduates, have higher median household incomes, and are more diverse than average with respect to their population shares of African Americans, Latinos, and foreign-born individuals. In contrast, more traditional districts are typically less supportive of women congressional candidates. These include districts located in the South as well as areas that have a disproportionately large blue-collar workforce, higher rates of married women, greater shares of children attending public K–12 schools, and more support for Republican presidential candidates.Footnote 3
Many of the factors identified by Palmer and Simon are so highly intercorrelated that multicollinearity issues complicate multivariate modeling that tries to simultaneously control for all of these factors' independent effects. These scholars, as well as Ondercin and Welch (Reference Ondercin and Welch2009), address this problem by collapsing the 12 measures into a single additive index. Specifically, Palmer and Simon's Women-Friendly Index assigns one point to a district for every instance that it scores above average for an index item positively correlated with the election of congresswomen. Similarly, for each of the index items negatively associated with the election of women, districts are assigned a point if their score is lower than the average for all districts.
My analyses directly duplicate most of Palmer and Simon's measurements to create a 10-point index of women-friendly socioeconomic characteristics. The only deviations from their procedures are that my analyses break out for separate analysis the two measures that most directly capture a district's political culture: whether a district is in the South and its partisan balance (i.e., how Democratic or Republican leaning the district's voting patterns are). The departure from Palmer and Simon's methodology is necessary in order to effectively isolate the influence of religious differences among districts from the effects that political conservatism or a less cosmopolitan outlook in general may have on support for women candidates. Otherwise, my primary motivation for replicating these scholars' index rather than using a handful of separate socioeconomic controls is to enhance the comparability of this study's findings with previously published work on congressional district characteristics and women candidate success. To ensure that my findings are not inadvertently affected by using the additive index in lieu of separate socioeconomic controls, I also calculated each model using a four-variable alternative rendering of Palmer and Simon's index. The alternative models exhibited no multicollinearity issues; however, the results from the more complex analyses neither fit the data much better nor generated any findings contrary to what I report for models using the additive index.Footnote 4
Following the lead of other researchers looking at female underrepresentation, my analyses also control for the effects of several political factors that can influence whether a district is likely to attract women candidates who can win (Lawless and Pearson Reference Lawless and Pearson2008; Ondercin and Welch Reference Ondercin and Welch2009). One such factor is the partisan composition of each district, as constituencies that lean Democratic are more likely to recruit and support female candidates than more Republican areas. The multivariate analyses all control for the effects of a district's partisan composition by using an adapted version of Cook's Partisan Voter Index (PVI) for each electoral cycle.Footnote 5 The PVI scores in the models range from –43 for the least Democratic district to 32 for the most Republican.
Because previous work has found that voters typically presume that women congressional candidates are more supportive of liberal public policies, the partisanship control is supplemented by a district-level measure of political ideology. Specifically, the models include Taunsanovitch and Warshaw's (Reference Tausanovitch and Warshaw2013) constituent preferences index measure, which they assign to each district based on the responses of 275,000 Americans to numerous policy questions asked on various national surveys. To aid in comparisons with the other indicators, these scholars' original scores are rescaled to range from 1 to 100, with the highest scores representing the districts where the median constituent has the most conservative policy preferences.Footnote 6
Scholars also have observed that women are most likely to run and win in districts where new types of candidates can be most competitive (Lawless and Pearson Reference Lawless and Pearson2008; Ondercin and Welch Reference Ondercin and Welch2009; Palmer and Simon Reference Palmer and Simon2012). Because of the possibility that a district's openness to new types of leadership—including electing women politicians—may be linked to its religiosity or to the community's particular history with cultural change, I include two controls for this type of environment. Most of the seats in Congress are presently held by men, and incumbency status is the single most important indicator of whether a new type of politician is likely to be elected. The analyses thus include an indicator coded 0–1 to identify districts with open seats. Similarly, scandals, local issues, or other circumstances specific to a district may create a political opening even when an incumbent is present, and so the analyses also assess each district's overall competitiveness by including a count of the total number of major party candidates entering each cycle. FEC results datasets provided both measures.
Finally, I have followed the lead of other researchers of women-friendly districts by pooling election and district data for multiple electoral cycles in order to smooth out the influence of any idiosyncratic cases or issues specific to any particular election (Ondercin and Welch Reference Ondercin and Welch2009; Palmer and Simon Reference Palmer and Simon2006, Reference Palmer and Simon2012). In order to identify and control for any fixed effects that are attributable to the circumstances of a particular cycle rather than to my variables of interest, the analytical models all include dummy indicators for each election cycle (2006 is the reference category).
ANALYSIS
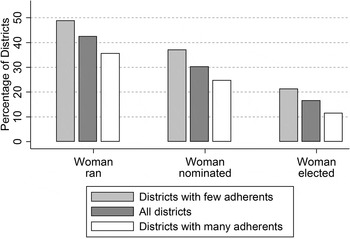
How does a district's religiosity influence the presence and electoral success of women? We can begin to answer the study's central empirical question by looking at how competitive women candidates were in congressional districts between 2006 and 2012, depending on whether they lived in a district with a low, typical, or high proportion of religious residents. To make the comparisons of high- and low- religiosity districts uniform across the analyses, the data summarized in Figure 1 and elsewhere employ standardized measures of “high” and “low” religiosity. Specifically, high-religiosity districts are those in the top quintile of all districts with respect to their share of residents who are affiliated with a congregation (or the referenced religious group in the analyses that look at specific denominations). Low-religiosity districts are areas in the bottom quintile. In the typical high-religion congressional district, about two-thirds (65%) of residents are affiliated with a congregation, while in the typical low-religiosity district, about one-third (37%) of the residents are.
Share of congressional districts that had, nominated, and elected woman candidates, by rates of religious adherence, 2006–2012. The low-religiosity districts are in the bottom quintile with respect to the share of their residents who are affiliated with any religious congregation. The high-religiosity districts are in the top quintile.

The univariate statistics shown in Figure 1 are consistent with my central argument and confirm that the nation's least religious districts were approximately half again more likely than highly religious areas to have women run or be nominated between 2006 and 2012. Low-religion districts also were twice as likely to elect a woman. What these data cannot tell us, however, is whether this connection between a district's religiosity and its outcomes for female candidates reflects something beyond the effects of socioeconomic and political differences identified in the previous literature as important factors for women candidates. For this information, multivariate modeling with socioeconomic controls is required.
District Religiosity, Denominational Strength, and Women Candidates
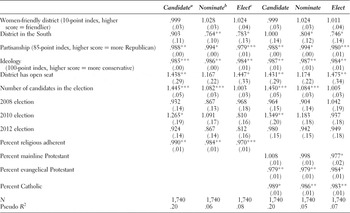
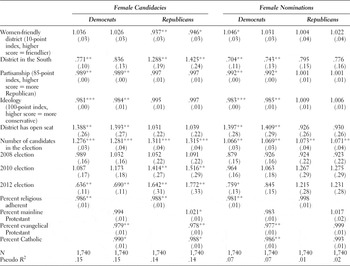
To isolate and assess the impact of a district's religious environment on women candidates, I employed logistic regression models that hold the influence of all other variables constant at their average marginal effects. The three models reported on the left side of Table 1 confirm that religious differences among districts are a significant predictor of women's success even after taking into account other sociodemographic and political factors. Indeed, the predicted probability that at least one woman will run in the typical low-religion district is about 25% higher (p = .45 versus .36) than it is in a highly religious area. The gaps between low- and high-religion districts are even wider when predicting whether a woman will win her party's nomination (her probability is 33% higher in the low-religion district) or be elected to Congress (her probability is twice as high in the low-religion districts). To put these findings in perspective, consider that the gap in female candidate success across low- and high-religion districts is similar in magnitude to what these same models predict when comparing estimates for highly and weakly Republican congressional districts (i.e., comparing estimates for a typical district in the top and bottom quintiles of the PVI).
Logistic regression estimates predicting the likelihood that a district had, nominated, and elected a woman House candidate

Notes: Entries list exponentiated logistic regression coefficients; standard errors in parentheses. The dependent variables are (a) whether at least one woman ran in the district primary for the indicated party, (b) whether a woman was nominated by the party, and (c) whether a woman was elected.
* p < .10; ** p < .05; *** p < .01, one-tailed.
Having established that the overall religiosity of a district has a considerable impact on the electoral environment for women, the discussion now turns to the question of whether the strength of specific denominations in a district also matters. The religious landscape of America's congressional districts is wide-ranging. The incidence of evangelicalism and Catholicism vary from just over half of all residents in the districts with the largest shares of these faiths to virtually none in the nation's least Catholic and evangelical districts. Shares of mainline Protestants fluctuate the least among the major denominations; in the most Protestant district, just shy of one-third of all residents belong to a mainline congregation, while less than 1% do so in the least Protestant area. Districts that have high rates of Catholicism tend to have low rates of mainline Protestantism (r = –.18) and especially evangelical Protestantism (r = –.71).
The three models on the right side of Table 1 analyze the assumption that districts with greater proportions of Catholics and especially evangelical Protestants will be less friendly to women than districts with fewer Catholics or evangelicals. The results are mostly in line with my expectations, although the anticipated difference between highly Catholic and highly evangelical districts does not materialize: both types of districts are similarly problematic for women candidates. As hypothesized, the least and most mainline Protestant districts do not differ in their likelihood of having or nominating female candidates. Unexpectedly, however, more Protestant districts typically will elect fewer women than otherwise similar areas with a weaker Protestant presence.
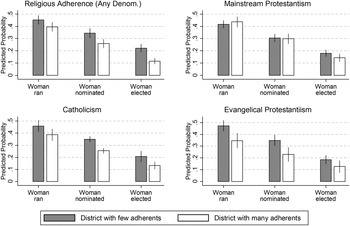
The most straightforward way to investigate and compare the magnitude of each denomination's effects on women candidates is to examine the predicted candidacy, nomination, and election rates for women in relatively high- and low-religiosity districts for each of the denominations. The series of plots in Figure 2 show that highly evangelical and Catholic districts are indeed challenging electoral environments for women. For example, the predicted probability that a woman will be elected from a district that has few evangelical residents is 46% higher (p = .13 versus .19) than is the case for a highly evangelical district. Interestingly, the coefficient in the regression model indicates that a 1% growth in mainline Protestantism is more detrimental to the electoral prospects of a woman than a similar increase in the number of Catholics or evangelicals, but the plotted data highlight the fact that the strength of mainstream Protestantism across districts varies less than the other religions; thus, the probability that a highly Protestant region will elect a women is only modestly lower than the probability than a less Protestant region will.
Religious differences among districts and their probabilities of having, nominating, and electing a woman. Bars plot the predicted probabilities that districts with disproportionately high and low shares of religious residents elected a woman, nominated a woman, or had at least one woman candidate, with all other variables (see Table 1) held constant at their average marginal effects. The lines mark 95% confidence intervals. The low-religiosity estimates are calculated for a district whose religious population share is equal to the mean share for all of the districts in bottom quintile of adherence rates for the noted religious group. The high-religiosity estimates are for a typical district in the top quintile.

The Effects of Religious Differences in Democratic and Republican Primaries
Previous research has found that the Democratic and Republican parties foster differing electoral environments for women candidates, which raises the question of whether the influence of religion on female candidates also varies across primaries. This question can be answered by comparing the effects of the religious variables on female candidacies and nominations in Democratic and Republican primaries.
Turning first to female candidacies, the two models on the far left side of Table 2 isolate the effects of religiosity and the strength of different denominations in Democratic primaries, while the next two models analyze Republican primary results. Contrary to my hypothesis, the results point to no significant differences between the two parties when it comes to the impact of religiosity on female candidacies. Indeed, women in both parties are reluctant to run in highly religious districts, especially those with large shares of Catholics and evangelical Protestants. One interesting difference between the two parties is that Republican women are somewhat more likely to seek seats in districts with higher proportions of mainline Protestants than they are in low-religiosity districts.
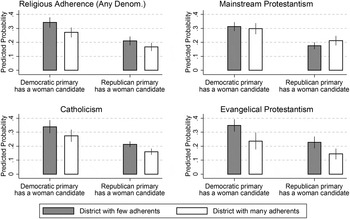
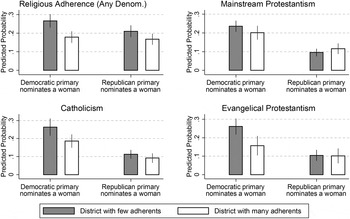
The plotted estimates in Figure 3 provide an alternative way to assess the effect of religiosity on female candidacies within the two parties. Analyzing the data in this way also makes it abundantly clear that religious differences among districts cannot account for all of the stark differences between the two parties with respect to the share of their congressional contests that feature female candidacies. The plots show that Republican primaries in low-religion districts, regardless of which denomination is being examined, are less likely to have a female candidate than Democratic primaries in highly religious districts.
Religious differences among districts and the probability that their major party primaries had at least one woman candidate. Bars compare the predicted probabilities of a woman entering the Democratic/Republican primary in a low- and a high-religion district, with all other variables (see Table 2) held constant at their average marginal effects. The lines mark 95% confidence intervals. The low-religiosity estimates are for a district whose religious population share is equal to the mean share for all of the districts in bottom quintile of adherence rates for the noted religious group. The high-religiosity estimates are for a district in the top quintile.

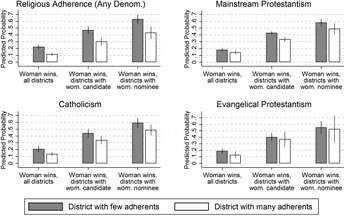
The regression models reported in the two models on the right in Table 2 were used to generate the probability estimates plotted in Figure 4. For the all-Democrat contests, high-religion districts are half as likely to nominate a female Democrat as low-religion communities, and these results closely follow the findings I reported earlier for the nation as a whole. For the Republican primary models, however, the models' fit statistics as well as the values for the individual variable coefficients indicate that none of the religion variables nor any of the other district-level qualities typically associated with women-friendly districts are reliable predictors of female Republican nominations for the 2006–2012 period. While this finding is puzzling in light of the previous scholarship emphasizing the extent to which a district's characteristics determine the success of women candidates, the finding here is consistent with recent survey data indicating that the Republican primary electorate is highly politically homogeneous and religiously orthodox. In other words, the district-level indicators are not able to predict voting behavior in Republican primaries as well as they do in Democratic primaries or general elections simply because Republican primary electorates in the study period behaved quite similarly across the nation regardless of what their districts' overall religious composition looked like.
Religious differences among districts and the probability that their major party primaries nominated a woman. Bars plot the predicted probabilities of nominating a Democratic/Republican woman in low- and high-religion districts, with all other variables (see Table 2) held constant at their average marginal effects. The lines mark 95% confidence intervals. The low-religiosity estimates are calculated for a typical district whose religious population share is equal to the mean share for all of the districts in bottom quintile of adherence rates for the noted religious group. The high-religiosity estimates are for a district in the top quintile.

The Effects of District Religiosity in the General Election
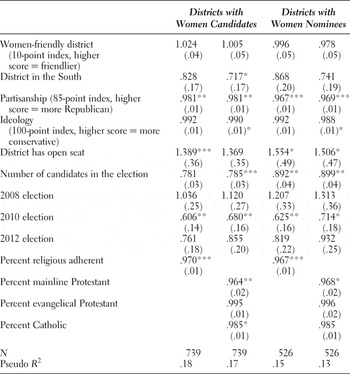
My last hypothesis anticipates that the effects of religiosity will recede as the electoral cycle progresses and increased news coverage, advertising, and especially partisan cues take over as the main drivers of voter choice. The models in Table 3 test this expectation by looking first at the likelihood that a district will elect a congresswoman if at least one woman already has entered either party's primary contest. Next, I analyze how the likelihood of electing a woman changes if we consider only the districts where a woman already has been nominated. If my hypothesis is correct, the religious variables should be weaker predictors of whether a woman candidate will be elected in the second model.
The plotted probability estimates in Figure 5 facilitate a side-by-side comparison of the effects of religious differences at different stages of the election cycle. The predicted probabilities are calculated from the results reported in Table 3 (for just the districts that had women candidates and nominees) and Table 1 (which estimated the likelihood of electing a woman for all districts at the beginning of the election cycle).
Religious differences among districts and their probability of electing a woman, by electoral stage. Bars plot the predicted probabilities of a electing a congresswoman in a low- and a high-religion district at different stages of the electoral cycle, with all other variables (see Tables 1 and 3) held constant at their average marginal effects. The lines mark 95% confidence intervals. The low-religiosity estimates are for a district whose religious population share is equal to the mean share for all of the districts in bottom quintile of adherence rates for the noted religious group. The high-religiosity estimates are for a typical district in the top quintile.

The data collectively provide only modest support for my initial assumption that a district's religiosity has less influence on the success of women candidates as the election cycle advances. The plots show that typical high-religiosity district begins the cycle only half as likely to elect a congresswoman when compared to a similar but relatively unreligious district. If at least one woman enters a primary in both of these districts, the low-religion district is still half again more likely than its high-religion counterpart to elect a woman. Finally, if at least one of the parties in both districts nominates a woman, the low-religiosity district remains 46% more likely than the more faithful district to send a woman to Congress. The other data plots illustrate the influence of varying denominational strengths on the probability that a district will elect a woman at different electoral stages. The results follow essentially the same pattern that what we see for religiosity as a whole, but some of the measures are not significant because the smaller sizes of the sub-population samples.
CONCLUSION
Gender and politics scholars have worked diligently to identify why the U.S. Congress remains so unbalanced in its gender composition despite the fact that women make up slightly more than half of the national electorate. While female candidates now win general congressional elections at the same rate as men, female candidacy and nomination rates for both political parties are still strikingly low. Incumbency and institutional inertia are certainly part of the story behind today's gender gap, but the essential conditions leading to representational inequality are still being replicated. Over the four election cycles covered in this study, women made up just 15% of the candidates entering House primary races, and the ratio of women to men competitors did not equalize at all during the 2006–2012 period. In short, the gender gap will almost certainly continue into the future unless we come to better understand why so many districts are not yet regularly fielding and nominating women.
This study's findings indicate that religious differences are part of the explanation for why district electorates differ in their support of female candidates at all electoral stages. In both parties, less religious districts are much more likely to see women candidates running. At the nomination stage, the effects of a district's level of religiosity are strongly influential in Democratic primaries, but less so in Republican primaries where few women are nominated and typically most voters are evangelicals or religiously active Catholics, even if much of their district is not especially religious. Finally, while the impact of religiosity on female electoral success softens modestly as the election cycle advances, districts in highly religious communities are still only about half as likely to vote for a woman nominee on Election Day as less religious but otherwise similar districts.
This research also indicates that a strong presence by some religious denominations matters more for a district's women candidates than is the case with other faiths. Many evangelical Protestant churches continue to teach their adherents that gender equality in the public sphere is a threat to traditional, divinely prescribed gender roles that should be maintained. Districts with disproportionately high shares of evangelical Protestants thus make for an especially tough political environment for women candidates who by definition do not match what many of these districts' voters think effective leaders should look like. At the other end of the spectrum, most—but still not all—mainline Protestant congregations now embrace the idea that women must have an equal role in decision making inside and outside of church activities. The fact that the least and most Protestant congressional districts in the nation have the same probability of having woman candidates run and nominating them points to the power of religious cues in shaping how a community thinks about female political leaders: where churches do not model or value gender bias, their adherents are less likely to withhold support from female candidates.
Beyond contributing to the literature examining the determinants of women-friendly congressional districts, this study identifies both methodological issues and new research questions that should be considered in future studies of prejudice against female candidates. Most importantly, fully considering a multidimensional set of religious variables should become the norm in gender-focused political research. Better understanding the influence of religiosity—both in general and as a function of denominational differences—may provide critical insights into where negative gender stereotypes and discriminatory behavior come from in the first place and why these biases are still being reproduced today.
Even if future work on female candidates does nothing more than better control for the relevant religious factors, researchers may generate better results. Numerous scholars, for example, have reported that Republicans typically express more bias toward women politicians than Democrats do; however, that work has not explained very well why such prejudices are more prevalent among Republicans. This study suggests that at least some of the attitudes and behaviors being attributed to partisan identities may in fact reflect differences in religious exposure and denominational background that are unevenly distributed across the parties' electoral bases. Similarly, while the leading works on women-friendly districts have attributed much of the variation in district-level support for women candidates to socioeconomic differences among communities, once a district's differences in religiosity and political ideology are taken into account, those socioeconomic differences turn out not to matter very much.
Finally, my findings point to a research area where the study of female congressional candidates could benefit from more qualitative work. This study shows that more religious districts are less likely to attract women candidates or elect them, but there are plenty of individual instances of women winning seats in highly religious districts (e.g., Tennessee's Marsha Blackburn and Diane Black). Are these successful candidates engaging their religious constituencies in ways that distinguish them from the losing candidates in other highly religious districts or from the women winning seats in more secular districts? Experimental research by Calfano and Djupe (Reference Calfano and Djupe2011) suggests that women candidates who make frequent references to their religiosity or religious imagery while campaigning can expect to lose the support of moderate voters who appear to have more concerns about women candidates who use “God speak” than their male counterparts. Nevertheless, it may be that the women who are winning in the nation's most religious districts have identified a set of transferable, effective strategies for talking to religious constituencies that can be modeled by other women in other highly religious districts.
Logistic regression estimates of the likelihood that a district's Democratic and Republican primaries had and nominated a female candidate

Notes: Entries list exponentiated logistic regression coefficients; standard errors in parentheses. The dependent variables are whether at least one woman (a) ran in and (b) was nominated by the indicated party's primary.
*p < .10; **p < .05; ***p < .01, one-tailed.
Logistic regression estimates of the likelihood that a district elected a woman, by electoral stage

Notes: Entries list exponentiated logistic regression coefficients; standard errors in parentheses.
*p < .10; **p < .05; ***p < .01, one-tailed.
SUPPLEMENTARY MATERIAL
To view supplementary material for this article, please visit http://dx.doi.org/10.1017/S1743923X15000616