1. Introduction
Modelling and forecasting mortality is a problem of fundamental importance to the actuary. Data for this purpose come largely from two sources: (a) population mortality data available from either the Human Mortality Database (2009) or government offices of statistics, (b) insurance data collected and collated by some central agency. The Continuous Mortality Investigation (CMI) fulfils this latter role in the UK. In both cases, data are generally available at the aggregate level, ie, deaths and exposures are classified by age at death and year of death. This gives rise to two problems for model building. For population data, the risk set for each age and year of death is heterogeneous with respect to mortality since it contains smokers and non-smokers, different social classes, etc. For insurance data, the risk set is subject to an additional source of heterogeneity: ‘deaths’ are claims on policies, and exposed-to-risk is the number of policy-years lived. Very often, some policyholders have more than one policy and so, for these policyholders, a single death gives rise to multiple claims; this is known as the problem of duplicates. Ideally the data would be deduplicated, ie, policies held by a single life would be consolidated into a single policy; Richards (Reference Richards2008) describes such a process. Unfortunately, such consolidation is not available for historical data such as collected by the CMI. Further, deduplication does not address the problem of the heterogeneity of mortality across the risk set.
Early work tackling the effect of duplicate policies on the estimates of mortality can be found in Seal (Reference Seal1940), Daw (Reference Daw1946, Reference Daw1951), Beard & Perks (Reference Beard and Perks1949), CMI Committee (1957, 1986), and elsewhere. Forfar et al. (Reference Forfar, McCutcheon and Wilkie1988) allowed for the presence of duplicates by scaling the data by a factor known as the ‘variance ratio’, a measure of the level of duplicate policies in the data. We refer to this approach as the method of scaling and return to it later in the paper. This method is only available if the variance ratios are known and in any case does nothing to address the more general problem of heterogeneity. In an important paper, Renshaw (Reference Renshaw1992) showed that it is possible to make proper adjustment for both duplicates and heterogeneity within the modelling process itself.
A frequent question is the following: does the existence of duplicates within a portfolio matter for the estimation of mortality? At first sight, the answer might appear to be no, since the multiple deaths in the numerator are balanced by the additional exposed-to-risk in the denominator. In statistical terms, the estimate of mortality remains unbiased. However, the variance of such an estimate is too small, since it is based on more deaths than we have actually observed (Forfar et al., Reference Forfar, McCutcheon and Wilkie1988). There are other more subtle consequences. The results of simulating portfolio experience based on policies will be less volatile than they should be, since, for example, the lives with multiple policies should take all their sums assured with them when they die, and not just part of them. More formally, using the result from Shaked & Shanthikumar (Reference Shaked and Shanthikumar1997) and Bäuerle (Reference Bäuerle1997), who compared random vectors with different levels of multiplicity, Denuit (Reference Denuit2000) showed how the presence of duplicates leads to a more dangerous portfolio in the supermodular sense.
A standard assumption is that the number of deaths/claims follows a Poisson distribution; see Brouhns et al. (Reference Brouhns, Denuit and Vermunt2002), Currie et al. (Reference Currie, Durban and Eilers2004) and Cairns et al. (Reference Cairns, Blake, Dowd, Coughlan, Epstein, Ong and Balevich2009) for example. The Poisson distribution has equal mean and variance but heterogeneity in general and the presence of duplicates in particular will inflate the variance. Such inflation is known as over-dispersion (McCullagh & Nelder, Reference McCullagh and Nelder1989; Renshaw, Reference Renshaw1992). Using a Bayesian argument, Li et al. (Reference Li, Hardy and Tan2009) assumed that the force of mortality follows a prior gamma distribution within each age/year cell from which it follows that the number of deaths/claims has a negative binomial distribution with variance larger than the mean, as required. Other approaches to the problem of over-dispersion can be found in Williams (Reference Williams1982), Breslaw & Clayton (Reference Breslaw and Clayton1993), Hinde & Demetrio (Reference Hinde and Demetrio1998), for example. In this paper, we adopt the two-stage joint-modelling of mean and dispersion through the extended quasi-likelihood, as described in McCullagh & Nelder (Reference McCullagh and Nelder1989, chap 10). Our reason for adopting the quasi-likelihood approach (as opposed to the negative binomial approach of Li et al., Reference Li, Hardy and Tan2009) is that it allows us to remain within the exponential family, and, as a result, we can essentially adopt a generalized linear model (GLM) approach to model building. Renshaw (Reference Renshaw1992) also used this approach in his paper on the graduation of mortality data in the presence of duplicates. Our contribution is (a) to extend this work to the smoothing and forecasting of 2-dimensional mortality tables, (b) to apply our method to the modelling and forecasting of mortality data by amounts, and (c) to produce a joint model of mortality by lives and amounts with the property that the forecasts by lives and amounts are constrained to be parallel.
The plan of the paper is as follows: in section 2 we define our notation and describe the joint estimation of regression and dispersion parameters with extended quasi-likelihood; in section 3 we show how extended quasi-likelihood applies to P-splines, the smoothing method of Eilers & Marx (Reference Eilers and Marx1996); in section 4 we describe a technique for the adjustment for bias of the estimates of the dispersion parameters. Applications of these methods are described in section 5: (a) we perform a simulation exercise to demonstrate first the effect that over-dispersion has on the smoothing process and second that our methods enable the true underlying smooth curve to be recovered more appropriately; (b) we describe the modelling and forecasting of mortality tables first by lives and then by amounts; (c) we discuss the consistent forecasting of mortality by both lives and amounts. The paper ends with a short conclusion.
2. Model specification and estimation with quasi-likelihoods
Many models for mortality data are based on the Poisson distribution (Brouhns et al. Reference Brouhns, Denuit and Vermunt2002; Currie et al. Reference Currie, Durban and Eilers2004; Cairns et al. Reference Cairns, Blake, Dowd, Coughlan, Epstein, Ong and Balevich2009). This strong assumption fails to account for the over-dispersion that is generally found in mortality data. The alternative assumption that the deaths follow the negative binomial distribution, as used by Li et al. (Reference Li, Hardy and Tan2009), takes us outside the exponential family into a less friendly environment for model building. We now describe estimation with extended quasi-likelihood (McCullagh & Nelder, Reference McCullagh and Nelder1989, chap 10) which allows over-dispersion to be modelled within the exponential family framework.
We suppose that we have independent observations Y = (Y 1, … ,Yn)′. In general the Yi can be counts but we will restrict our description to the case when they are counts of deaths or claims. To simplify the notation, we will not distinguish between random variables and their observations. We supposed that these data can be partitioned into κ classes  , in such a way that each class is homogeneous (by homogeneous we mean that the level of dispersion within each class can be assumed constant). For example, at one extreme if
 then each count has its own dispersion parameter while at the other extreme if
 then a single dispersion parameter applies to all counts. We will be particularly interested in the intermediate case where the dispersion parameter is age dependent in a mortality table; this is consistent with the approach of Forfar et al. (Reference Forfar, McCutcheon and Wilkie1988), Renshaw (Reference Renshaw1992) and Li et al. (Reference Li, Hardy and Tan2009) who use age-dependent dispersion parameters. We will denote by
 the over-dispersion parameter in the class
 ; we note in passing that
 could in theory be less than one, so this approach can also deal with under-dispersion (which the negative binomial cannot). Let
 denote the set of classes and let
 assign observations to classes.
We include dispersion in the model through the first and second moment assumptions

where μ = (μ 1 ,…, μn)′, B is the regression matrix, α is the unknown vector of coefficients, υ(·) is the variance function, g(·) is the link function, g(μ) = (g(μ 1) ,…, g(μn))′, and η is the linear predictor. The case of a Poisson GLM is given by φ ϕ(i ) = 1, ∀i, and υ(·) equal to the identity function. Further, in the Poisson case we can fit the model with maximum likelihood; this requires the distribution that has generated the data. Unfortunately, such a distribution is not available for (2.1). An alternative is the quasi-likelihood framework of Wedderburn (Reference Wedderburn1974), an extension of the familiar likelihood function that allows estimation to take place in more general settings such as (2.1). Under model (2.1), the quasi-likelihood (or more correctly the quasi-log-likelihood) of a single observation Yi is defined as

where
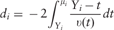
is the deviance component. The estimates of the dispersion parameters φ ϕ(i ) are based on the di. (The normal distribution is a well-known example here since when υ(t) = 1 we have di = (Yi−μi)2, the ith component of the residual sum of squares.) The quasi-likelihood of the sample Y is

If the dispersion parameters are known, the fitting of model (2.1) is reduced to the optimization of the quasi-likelihood (2.4). However, since these parameters are generally unknown they also need to be estimated. Thus we also need the derivative of  to behave like a log-likelihood with respect to the dispersion parameters, that is
 for all
 . For this to be achieved, the quasi-likelihood is usually adjusted (see Nelder & Pregibon, Reference Nelder and Pregibon1987) to the so-called extended quasi-likelihood
 as follows:

where f(·) is some well chosen function. A simple candidate (that we use here) for f(φ) is  where w(·) is any positive function.
If we set

then, at the true value of μ (McCullagh & Nelder, Reference McCullagh and Nelder1989, chap. 10),

We make two comments on (2.6). First, there is a possible confusion of notation; we have adopted the convention that the suffix i, i = 1, …, n, refers to observations, while the suffix  , refers to classes. Second, with the normal distribution, du reduces to the familiar maximum likelihood estimate of σ 2 in the class
 .
Now, corresponding to the model (2.1) for the mean μ, we model the dispersion parameters (for sufficiently large κ) with

for some suitable link function h(·) which we specify below. Within this setting, fitting model (2.1) is reduced to the optimization of the extended quasi-likelihood (2.5) with respect to α and β respectively. This optimization yields the inter-dependent equations


where c and  are the lengths of α and β respectively. Equations (2.10) correspond to the quasi-likelihood estimating equations based on independent responses du with
 and
 . In the GLM setting, equations (2.10) are identical to the estimating equations based on gamma responses du, with shape parameter nu and scale parameter φu/nu. The canonical link for the gamma distribution is the negative inverse function (McCullagh & Nelder, Reference McCullagh and Nelder1989, chap. 2), so we simplify (2.8) by specifying

where the quotient sign is interpreted as element-by-element division. In the parametric setting, we have generalized and unified the two-stage joint modelling of mean and dispersion described in McCullagh & Nelder (Reference McCullagh and Nelder1989, chap. 10), and used by Renshaw (Reference Renshaw1992) for graduation in life insurance. However, mortality data often reveal complex patterns which suggest that a smoothing rather than a parametric approach is more appropriate. In the next section, we extend the above results to the P-spline method of Eilers & Marx (Reference Eilers and Marx1996).
3. Extended quasi-log-likelihood and P-splines
We use the method of P-splines (Eilers & Marx, Reference Eilers and Marx1996) and so the regression matrices B and  are constructed from B-spline bases on the covariates, age at death and year of death. For a description of P-splines from a statistical perspective as applied to modelling mortality see Currie et al. (Reference Currie, Durban and Eilers2004); Richards et al. (Reference Richards, Kirkby and Currie2006) and Richards & Currie (Reference Richards and Currie2009) contain descriptions of P-splines in an actuarial context. The key idea is to overfit the data with rich bases of B-splines, and then apply roughness penalties to the coefficients α and β to achieve smoothness; the roughness penalty on β here assumes that the number of classes,
 , is not too small. Combining the penalization with the extended quasi-likelihood (2.5), we derive an optimal criterion, the penalized extended quasi-likelihood,

In (3.12),  are penalty matrices acting on α and β respectively; here Δ1 and Δ2 are difference matrices (generally of order 2), and λ1 and λ2 are vectors of smoothing parameters. The dimension of λ1 depends of the structure of the data Y and the model matrix B while that of λ2 is a function of the structure of the
 ’s and the model matrix
 .
Optimizing  with respect to α yields the penalized iterative equation

where  represents the diagonal weight matrix in the quasi-likelihood model (2.1) based on the response Y, and
 is the associated working variable; here, a tilde refers to the current estimates, and a hat refers to the updates. This form is similar to the penalized equation encountered in the penalized GLM setting, the difference being that the dispersion parameters are involved in the smoothing process through the weight matrix
 , which is a function of the dispersion parameters. Similarly, optimizing
 with respect to β yields the penalized iterative equation

where  is the diagonal weight matrix in the GLM based on a gamma response
 , and
 is the corresponding working variable.
We note that equations (3.13) and (3.14) are the penalized versions of the scoring equations corresponding to (2.9) and (2.10) but written in matrix form. The precise form of the weight functions  depends on the form of the link functions g(·) and h(·).
For given values of the smoothing parameters λ1 and λ2, the estimation process consists of iterating between (3.13) (the α-step) and (3.14) (the β-step) until convergence is achieved. For the estimation of λ1 and λ2, we step outside the likelihood framework and use a model selection criterion. One of the best known criteria is the Bayesian Information Criterion (BIC) (Schwarz, Reference Schwarz1978) which attempts to balance (a) fit as measured by the deviance with (b) model complexity as measured by the effective dimension. Under the Poisson assumption, the BIC is given by:

where  is the residual deviance, and v is the effective dimension of the model. For count data such as Poisson, (3.15) is appropriate when the value of the dispersion is close to 1; however, if the data are over(under)-dispersed, the deviance will tend to be large(small), with the result that the deviance will also tend to be over(under)-weighted in (3.15). This implies that the effective dimension will also tend to be large(small); we end up by under(over)-smoothing our data. We correct this inappropriate weighting by adjusting the deviance in each class; this gives the scaled BIC:
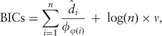
a generalization of the scaled criterion given by Heuer (Reference Heuer1997). Clearly, if there is no over(under)-dispersion in the data, then BIC and BICs are equivalent. Both BIC and BICs require a value for the dimension of the fitted model. If the smoothing parameters are zero, then penalized regression reduces to ordinary regression and the dimension of the model is the number of linearly independent columns in the regression matrix; in our case, if B has c columns then the dimension of the model is c. With penalization the flexibility of the model is reduced and so the dimension of the model is correspondingly reduced. Following Ye (Reference Ye1998) and Ruppert et al. (Reference Ruppert, Wand and Carroll2003), we approximate the effective dimension v by
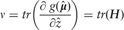
where the hat-matrix H, which maps the working variable  in (3.13) to the fitted value of the linear predictor at convergence, is given by
 . Hence,


The second form (3.19) shows the reduction in the dimension of the model brought about by the penalization. The complete estimation algorithm is as follows:
(i) initialize φu = 1,
 ,
(ii) update μ by solving (3.13) in α with λ1 selected by minimizing (3.16),
(iii) - if
is small, update the φu to their extended quasi-likelihood estimates given by (2.6),- else, update φ by solving (3.14) in β with λ2 selected by minimizing (3.16),
(iv) repeat (ii) and (iii) until convergence is achieved.
 ,
 is small, update the φu to their extended quasi-likelihood estimates given by
In our applications, we will refer to this algorithm as the full extended quasi-likelihood scheme.
4. Bias adjustment
We have already remarked after (2.6) that du reduces to the maximum likelihood estimate of σ 2 in the normal distribution case. This estimate is biased downward and, in the same way, the maximum extended quasi-likelihood estimate of the dispersion parameters also tends to be biased downward, (see Figure 4). This stems from the fact that (2.7) holds only at the true value of μ while μ is generally unknown. An alternative approach is to estimate μ by maximizing criterion (3.12) as before, ie, by solving the iterative equation (3.13), but to look for a different estimate for φ. A potential candidate (analogous to the unbiased estimate of σ 2 in standard normal regression) is the bias corrected mean Pearson statistic in each class:

where ν u is the contribution of the class u to the total dimension ν. Intuitively, from (3.17), we estimate the ν u by

If the number of classes, κ, is small then φu is estimated by  otherwise, we proceed as follows. Instead of relying on the (penalized) extended quasi-likelihood of model (2.1) to estimate φ, we assume a full quasi-likelihood framework for the ‘observations’
 :

We then denote by Q 1 and Q 2 the quasi-likelihood of models (2.1) and (4.22) respectively, and by BICs1 and BICs2 the associated scaled BIC. Conditional on φ, we penalize Q1 in α to get  , and conditional on α, we penalize Q 2 in β to get
 . The estimation algorithm becomes:
(i) initialize φu = 1,
,(ii) update μ by optimizing
in α with λ1 selected by minimizing BICs1,(iii) - if
is small, update the components of φ to their Pearson estimates given by (4.20),- else, update φ by optimizing
in β with λ2 selected by BICs2,(iv) repeat (ii) and (iii) until convergence is achieved.
 ,
 in α with λ1 selected by minimizing BICs1,
 is small, update the components of φ to their Pearson estimates given by
 in β with λ2 selected by BICs2,
In our applications, we will refer to this algorithm as the bias corrected scheme.
5. Applications
We apply our methods to two CMI data sets, the male assured lives data set where age at death runs from 40 to 90 and year of death from 1950 to 2006, and the male pensioner data where age at death runs from 10 to 108 and year of death from 1983 to 2006; the pensioner data are available both by lives and amounts. To be consistent with the actuarial literature, from now on μ will represent a force of mortality instead of a mean, as in the previous sections. The applications we consider assume an over-dispersed Poisson model with a systematic structure (as the case may be) for the dispersion parameters. In section 5.1, through a simulation, we illustrate how over-dispersion affects the smoothing process and how the use of the two schemes presented in the previous section leads to improved estimates. In section 5.2, we use both schemes to fit the 2-dimensional mortality surface and we illustrate the effect of over-dispersion on the extrapolated trends and confidence bands. In section 5.3, we show that both schemes can be used directly (without the need of prior scaling, as in Forfar et al., Reference Forfar, McCutcheon and Wilkie1988) to handle the high level of over-dispersion such as encountered in mortality data by amounts. Lastly, in section 5.4 we consider the joint modelling and forecasting of mortality by lives and amounts; here, we will be concerned to produce consistent forecasts from the two data sets.
5.1. A simulation exercise
We conduct a simulation exercise with two aims: first, to illustrate how dispersion affects the smoothing process and second, to show how the use of the bias corrected scheme (as well as the full extended quasi-likelihood scheme) gives rise to an improved estimate of the true mortality curve. The simulation exercise will be split into two parts: first, a portfolio without duplicates, and second, one with duplicates.
5.1.1. A simulation exercise without duplicates
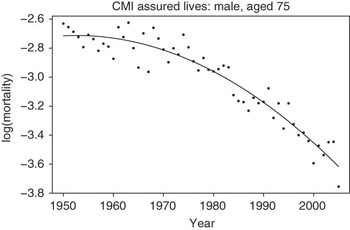
Figure 1 shows log mortality for years 1950 to 2005 for a male aged 75 from the CMI assured lives data set. For the purpose of these simulation exercises, we suppose that underlying log mortality follows the fitted quadratic curve shown, ie, log μt = Q(t) where t is year. We now suppose that we have central exposure  at each year t and suppose that the number of deaths (claims) come from the Poisson distribution:
 . We simulate from this model and estimate the underlying mortality curve using P-splines with a cubic B-spline basis with c = 13 B-splines in the basis, second-order penalty and smoothing parameter chosen by minimizing BIC. This exercise is repeated 2000 times.
Observed mortality (•••) for CMI assured lives, males age 75, together with fitted quadratic curve.

With Poisson errors we have φ = 1. For each simulation i, i = 1, … , 2000, we compute the mean square error

an overall measure of the quality of the fit, and we also compute the bias corrected Pearson estimate  of φ using (4.20). The mean of the MSEs (over the 2000 simulations) was 0.00168.
We now perform a second round of smoothing for each of our 2000 simulations; for the ith simulation, we set  and re-estimate the force of mortality with the penalized iterative equation (3.13) and select the smoothing parameter with the scaled BIC defined in (3.16). The mean of the MSEs was very little changed at 0.00170.
In conclusion, since the quasi-likelihood generalizes the usual likelihood approach, the MSEs obtained with the two approaches are essentially equal, even when the Poisson assumption does hold. In the next section we discuss the situation when the presence of duplicates systematically introduces over-dispersion into the problem. Here we will see a much stronger effect of over-dispersion, and both the bias corrected and the full extended quasi-likelihood schemes outperform the likelihood approach.
5.1.2. A simulation exercise with duplicates
In the previous section we considered a portfolio of 1000 distinct policyholders in each year, where each policyholder was exposed to risk for one year. Now we consider males aged 75 again, but we suppose that we have a portfolio of 1000 policies in each year made up as follows: we have 200 policyholders with a single policy, 150 policyholders with two policies, 100 policyholders with three policies and 50 policyholders with four policies. Hence, we have 500 distinct policyholders (classified into four categories) with a total of 1000 policies, an average of two policies per policyholder. If Ct is the number of claims observed in year t, we have  and var(Ct) = 2500μt; thus the (theoretical) dispersion parameter is φ = 2.5 in each year, ie, the variance of claim numbers has been inflated by a factor of 2.5. Finally we suppose that a policyholder in year t is subject to the same (quadratic) mortality as in the previous section and we repeat the previous simulation exercise for each category of policyholder.
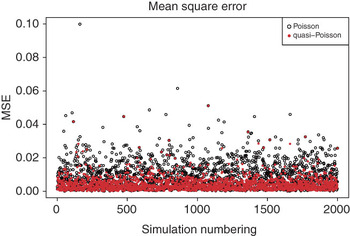
The black colour in Figure 2 shows the MSEs for each simulation based on the penalized likelihood with Poisson errors. The mean of the MSEs was 0.00843 (compared to 0.00168 without duplicates); the presence of over-dispersion has had a negative impact on the smoothing process. We perform a second round of smoothing with the estimated values of the φ’s incorporated into the estimation. The red colour in Figure 2 shows the MSEs after this second round of smoothing; the mean of the MSEs was 0.00428, a drop of almost 49%. The mean of the estimated  ’s (over the 2000 simulations) was 2.4; this is in agreement with the (theoretical) value φ = 2.5.
Mean square error, MSE, with duplicates and φ = 1 (○○○). Mean square error, MSE, with duplicates and φ set to  (•••).

The effective dimension of the fitted model gives another perspective on the effect of over-dispersion. Ignoring over-dispersion gave a mean effective dimension of 7, well in excess of 3, the true dimension of the model, while including over-dispersion reduced the mean effective dimension to 3.44. In general (by examining (3.13) and (3.16)), the flexibility of the fitted curve is reduced by the inclusion of over-dispersion parameters into the estimation process. This has important consequences for forecasting where less volatile curves lead to more stable forecasts.
5.2. Modelling and forecasting over-dispersed mortality tables
Here we consider the problem of modelling and forecasting a mortality table. For illustration, we use the CMI assured lives data with ages 40 to 90 and years 1950 to 2006.
5.2.1. Model specification
We use 2-dimensional P-splines. Details of this method from an actuarial perspective can be found in Richards et al. (Reference Richards, Kirkby and Currie2006) but, in brief, it consists of supposing at age x in year t that

where Bx and Bt are 1-dimensional cubic B-spline bases along age and year respectively, and ⊗ is the Kronecker product; here Dx,t is the number of deaths/claims and Ex,t is the central exposed-to-risk at age x in year t. Smoothness is then achieved by penalizing the regression coefficients separately in the age and year directions, that is, the vector of smoothing parameters λ1 (see equation (3.12)) is a 2-dimensional vector:  , where λ1,x and λ1,t quantify the amount of smoothing in the age and year directions respectively. The penalization not only gives a smooth mortality surface but also allows forecasting to take place as described by Currie et al. (Reference Currie, Durban and Eilers2004).
Here we are interested in incorporating over-dispersion into the 2-dimensional smoothing process in the same fashion as the 1-dimensional case just considered; in other words, we are interested in the effects of replacing the Poisson assumption with a first and second moment assumption, as in (2.1). A starting model is to assume an over-dispersed Poisson model with a common over-dispersion parameter for all observations:

Note that (5.25) is a special case of model (2.1), in which all the observations are assumed to belong to the same class; the variance function is the identity. The structure of the over-dispersion here is very simple, but it is useful for understanding the effect of the dispersion parameters on the smoothing process. A refinement of Model 2 is to allow the dispersion to be age dependent, that is

once again, (5.26) is a special case of model (2.1), where the dispersion classes  comprise the observations of the same age, and the variance function is the identity. Renshaw (Reference Renshaw1992) presented an age dependant dispersion parameter model for graduation in life insurance. We extend Renshaw’s work to two dimensions with the possibility of a general smooth structure for the dispersion parameters (as suggested by Renshaw); furthermore we consider forecasting and discuss the effect of over-dispersion on the associated confidence bands.
5.2.2. Estimation
For models 1, 2 and 3, the space between knots was five years for both age and year, and the smoothing parameters were chosen by minimizing the scaled BIC. In each case, the generalized linear array representation (Currie et al. Reference Currie, Durban and Eilers2006) was used to speed up the computation. Forecasting to 2050 was performed via the penalization by extending the basis in the year direction to 2050, as described in Currie et al. (Reference Currie, Durban and Eilers2004).
Model 1 was fitted as described in Currie et al. (Reference Currie, Durban and Eilers2004), that is by the penalized GLM for D = (Dx,t) with regression matrix B, offset log(E), E = (Ex,t), log link, Poisson error and penalty matrix  , where

In (5.27), Δx and Δt are difference matrices of order 2 (Eilers & Marx, Reference Eilers and Marx1996) in the age and year direction, cx and ct are the number of B-splines in the age and year direction (that is the number of columns in Bx and Bt), and In is the n × n identity matrix.
Models 2 and 3 were each fitted with both the full extended quasi-likelihood and the bias corrected schemes. In both schemes we applied the penalty matrix (5.27) to the coefficient α to achieve smoothness. Model 2 (with a single dispersion parameter) does not require second stage smoothing; we simply update the value of φ either to its extended quasi-likelihood estimate or to its Pearson estimate, as the case may be. In contrast, for Model 3, a second stage smoothing process was implemented to get smooth estimates of the dispersion parameters. This second stage modelling process is easier in the full extended quasi-likelihood scheme in comparison with the bias corrected scheme, since the full extended quasi-likelihood scheme uses the gamma distribution (2.11) with a known shape parameter, whereas the bias corrected scheme assumes a full extended quasi-likelihood scheme (with an unknown dispersion parameter that needs to be estimated) based on the bias corrected mean Pearson statistics (4.20); in the bias corrected scheme the variance function, v*(φu), in (4.22) is set to  . In both cases, we have a 1-dimensional smoothing process in the age direction, and so λ2 is reduced to a scalar, λ2. Hence, we set the regression matrix
 and the penalty matrix
 to

For both schemes, we have used the gamma canonical link function (that is the negative inverse) in the smoothing of the dispersion parameters. Wherever needed, the convergence criterion was the relative error between the current estimate and its update with a tolerance of 10−5.
5.2.3. Results and comments
The estimated forces of mortality obtained with the full extended quasi-likelihood scheme can scarcely be distinguished by eye from those obtained with the bias corrected scheme, since the difference between the estimated over-dispersion parameters from both schemes is not substantial; see Figure 4 and Table 1. For precision however, all the graphics and most of the estimates discussed in this section are those implemented with the bias corrected scheme.
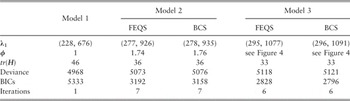
Comparative statistics for Models 1, 2 and 3. FEQS and BCS stand for the full extended quasi-likelihood and the bias corrected schemes respectively.

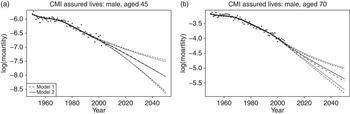
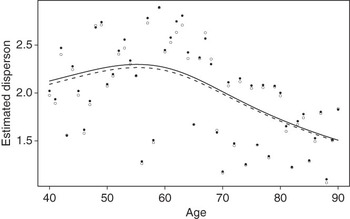
Figure 3 shows the profile views for ages 45 and 70 which result from fitting Models 1 and 2; some statistics are given in Table 1. Figure 4 shows the raw values and the smooth estimates of the φu’s under Model 3. This graphic shows how the full extended quasi-likelihood scheme under-estimates the dispersion parameters compared to the bias corrected scheme.
Fitted and forecast mortality with confidence intervals.

Raw (○○○) and smoothed estimates (-- -) of the φx’s using the full extended quasi-likelihood scheme. Raw (•••) and smoothed estimates (——) of the φx’s using the bias corrected scheme.

We make some comments on the results in Table 1. First, as measured by BICs, Model 2 gives a much superior fit to the data compared to Model 1, with Model 3 a further improvement. Second, the less flexible the fitted model, the larger the deviance; however, the deviance in Model 1 is computed under the assumption that φ = 1, and the relative increase in deviance from 4968 to 5076 as we go from Model 1 to Model 2 is more than compensated for by the additional variance of Model 2 (as measured by its assumed over-dispersion parameter  ). Similar remarks apply to Model 3 compared to Model 2. Third, Figure 3 does not include the output from Model 3; the plotted lines for Model 3 are very close to those shown for Model 2, and we have chosen to omit them; however, the difference between the two fitted models is clearly seen in Table 1.
There are two important conclusions to be drawn from this example: the first concerns the central forecasts and the second the width of the confidence intervals. First, we consider the central forecasts. The effective dimension of the model under the Poisson assumption is 46. If we include the dispersion parameter in the estimation process, the effective dimension is reduced to 36 with Model 2, and to 33 with Model 3; this corresponds to a more robust, ie, less volatile fit. In general, this seems to us to be a desirable property for a forecast. Second, we consider the effect on the confidence intervals. Taking account of the over-dispersion has led to narrower confidence intervals. Why should this be? We argue as follows: smoothing is a compromise between (a) increasing roughness, ie, improved fit to data and (b) increasing smoothness, ie, poorer fit to data. When we include φ we down-weight the fit to data (the deviance is increased from 4968 for Model 1 first to 5076 for Model 2, and then again to 5121 for Model 3) and so decrease the volatility of the fitted model (the effective dimension is decreased first from 46 to 36 and then again to 33). The width of the forecast confidence intervals reflects our faith in the selected model and we will have more faith in the future direction of a forecast in a less volatile model; we conclude that the width of the confidence interval will be decreased. Both of these effects can be seen in Figure 3.
5.3. Smoothing mortality data by amounts
We consider CMI male pensioner data. These data are available both by lives and by amounts from 1983 to 2006 and ages 10 to 108. For this exercise we consider separately the data for those pensioners who are (a) age 65 and (b) age 73 (we will see below why we have chosen these ages). Let D = (D 1, … ,Dn)′ and E = (E 1, …, En)′ denote the numbers of claims and central exposed-to-risk, and let  denote the amount of pension of those that died, the amount at risk and the force of mortality (by amounts) for those pensioners age 65 (or 73 as the case may be). For amounts data, the problem of duplicates arises in two ways:
A: the original problem of duplicate policies in the portfolio, and
B: the much larger problem that amounts data by its very nature contains duplication on a grand scale, since a single death, even of a pensioner with a single pension, generates not one but multiple claims, namely the amount of pension at risk; see Forfar et al. (Reference Forfar, McCutcheon and Wilkie1988).
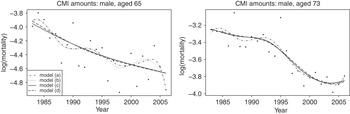
Figure 5 shows a plot of the observed log mortality by amounts, ie, log(D[a]/E[a]) (where the quotient sign is interpreted as element-by-element division). We consider four approaches to smoothing the observed mortality rates; these approaches reflect different attitudes to problems A and B.
Various smooths of mortality by amounts.

(a) Assume
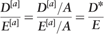
, (ie, ignore both A and B).(b) Define A = E[a]/E, the mean amount at risk per life. Then the vector of raw mortalities by amounts is
(5.29)where D* = D[a]/A. If all policies are for the same amount then D* = D so we assumeThis is the ‘method of scaling’ referred to in our introduction.(c) Assume a quasi-likelihood framework for
, (ie adjust for A and B simultaneously by quasi-likelihood):This model is similar to that discussed by Renshaw & Hatzopoulos (Reference Renshaw and Hatzopoulos1996).(d) Assume a quasi-likelihood framework for
, (ie adjust for B by scaling and for A by quasi-likelihood):
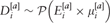 , (ie, ignore both A and B).
 , (ie adjust for A and B simultaneously by quasi-likelihood):

 , (ie adjust for B by scaling and for A by quasi-likelihood):

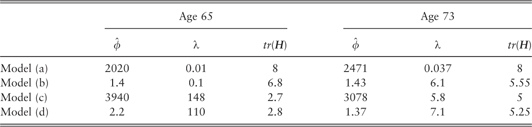
The smooth estimates which result from these four approaches are presented in Figure 5; various summary statistics obtained with the bias corrected scheme are provided in Table 2. We comment on each approach in turn. There are two serious objections to approach (a). Approach (a) is equivalent to assuming that  , the amount at risk, corresponds to
 independent lives, each with an amount at risk of £1. Thus, over-dispersion is an essential part of model (a). Indeed, on smoothing the age 65 data under model (a) we find (after the fitting)
 while
 at age 73. An even more serious objection to model (a) is that it depends on the unit of currency used to measure amounts. Simply by changing the units to hundreds of pounds, say, we alter the amounts claimed and the amounts at risk. The consequence of model (a) is that the fitted curve is substantially under-smoothed, since the exaggerated exposures force the fitted curve to follow the data, as can be seen in both panels of Figure 5.
Estimates of the over-dispersion parameter φ, the smoothing parameter λ and the effective dimension tr(H).
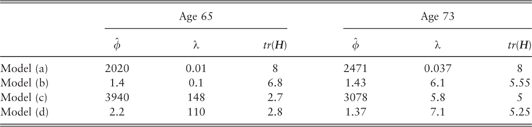
Approach (b) is an attempt to solve the problems with (a). We scale the amounts claimed and the amounts at risk in such a way that the exposed-to-risk is once again measured in terms of policyholders’ lives. Note that the problem with the units of currency is also solved by this scaling. The effect of scaling varies with our two illustrative ages: there is little effect on the fitted smooth at age 65 while at age 73 scaling results in a satisfactory smooth. There seems to be no clue in the values of  and λ in Table 1 for these different behaviours, but we can remark from (3.13) that a smoother curve results when the product of
 and λ is large.
Approach (c) is very simple. We let the quasi-likelihood approach look after everything. We note in particular that the problem with the units of currency disappears since if and  for some constant c then
 and
 and the over-dispersion parameter adjusts to take account of the change of currency. The estimated smooth mortalities at both ages seem satisfactory. Approach (d) is a hybrid which combines the scaling argument of approach (b) with the over-dispersion modelling of approach (c). Approaches (c) and (d) give very similar results; see, for example, the values of tr(H) in Table 2.
We remark that the over-dispersion only approach in (c) is capable on its own of adjusting for both the dispersion caused by amounts data per se and the ‘intrinsic’ dispersion caused by heterogeneity and duplicate policies. Renshaw & Hatzopoulos (Reference Renshaw and Hatzopoulos1996) use this partition of dispersion to calculate dispersion in their model for amounts data. Model (b) uses scaling to adjust for the overdispersion caused by amounts data, but this is insufficient on its own and further over-dispersion modelling, as in model (d), is required. Approach (d) also suffers from the (possible) defect that it depends on a knowledge of the exposed-to-risk by lives; while this would generally be available, approach (c) does not use this information.
5.4. Joint modelling and forecasting of mortality by lives and by amounts
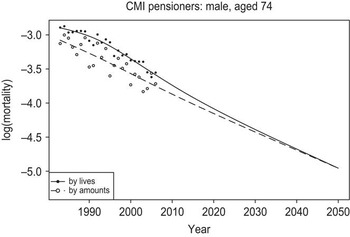
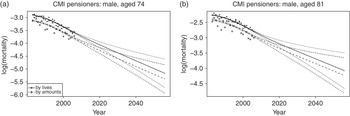
The CMI pensioner data consists of data on both lives and amounts. It seems natural to require that forecasts of mortality based on the lives data should be consistent with forecasts based on the amounts data. Yet, independent forecasts of mortality by lives and by amounts will inevitably lead to inconsistencies, as illustrated in Figure 6. It is well known that mortality by amounts is lighter than that by lives so we propose a joint model of mortality by lives and amounts that has consistency built into the model. Our joint model is an additive model with two components: the first component is a smooth 2-dimensional surface and the second component is a smooth age dependent curve which is constant in time. Thus, the mortality surface by lives sits on top of the mortality surface by amounts in such a way that the cross-sections in time by age are parallel. This model was discussed in Currie et al. (Reference Currie, Durban and Eilers2004) but the treatment there used the Poisson assumption to model the lives data and the ‘method of scaling’ to model the amounts data (described in (b) in the previous subsection). Here we use the full quasi-Poisson assumptions as follows

where the upper indexes  and
 refer to the lives data and the amounts data respectively; for instance, for the amounts data at age x in calendar year t,
 is the exposure and
 is the dispersion parameter. Formulation (5.30) is quite general but here we will set
 and
 , and then smooth these parameters across age as described in sections 3 and 4. The joint aspect of the model is then constructed through the linear predictor as follows:

where nt is the number of years; that is, there is an underlying smooth surface, (Bt⊗Bx)θ (viewed as the reference surface and corresponding to the mortality surface by amounts). This surface drives an important part of the common dynamism in the mortality by lives and by amounts; and then, the relative variation between these two types of mortality is captured by the gap,  , which is smooth in age and constant in time. Thus, our modelling of the gap with
 is designed to achieve flexibility in the age direction and parallelism in the time direction. One may argue that this is a strong assumption but it is a convenient and simple approach if we wish to avoid any crossing effects in the two extrapolated surfaces. Moreover, for the CMI data sets considered here, it produces satisfactory results (as we report below) because the underlying dynamism of mortality by lives and amounts supports such a model. Smoothness is obtained by applying the penalty in (5.27) on θ and a penalty similar to (5.28) on δ.
Profile view illustrating the crossing effect in the independent extrapolations of mortality by lives and by amounts for CMI pensioners.

We now define the joint vectors of the forces of mortality, μ = vec(μ[a], μ[l]), and the coefficients, α = vec(θ, δ); the linear predictor in (5.31) can then be expressed compactly as
This compact formulation allows the joint model specified through (5.30) and (5.31) to be fitted with both schemes presented earlier. An illustration of the result (for selected profile views) fitted with the bias corrected scheme is displayed in Figure 7. An attractive point in this joint modelling approach is that the order of the two types of mortality in the joint predictor (5.31) does not matter, ie, flipping the two types of mortality will lead to the same fit. Indeed, the fitting here is not sequential; the coefficients θ and δ in (5.31) are estimated simultaneously.
Profile views of the joint modelling of mortality by lives and by amounts for CMI pensioners.

6. Concluding remarks
We have described a general class of models for count data which allows the joint modelling of mean and dispersion effects through the extended quasi-likelihood. Renshaw (Reference Renshaw1992) was the first to apply this method to actuarial data and we have extended his work to models for 2-dimensional data in age and time with general smooth functions for both the mean and dispersion surfaces. Smoothing is accomplished with the penalized B-spline method of Eilers & Marx (Reference Eilers and Marx1996) which fits naturally into the generalized linear model framework. This enables more complex models such as the joint model for lives and amounts to be formulated. This last model is computationally very demanding since five smoothing parameters (two for the reference surface, one for the gap, and one for each of the age-dependent dispersion parameters for lives and amounts respectively) must be chosen in the context of a large regression model. The efficient array algorithms described in Currie et al. (Reference Currie, Durban and Eilers2006) enable these calculations to be performed; these algorithms impact on the computations but not on model formulation.
Forfar et al. (Reference Forfar, McCutcheon and Wilkie1988, Sect. 17.2) used variance ratios to adjust for the presence of duplicate policies in a portfolio. Renshaw (Reference Renshaw1992) realised that there is sufficient information in the claims data alone to adjust for the presence of duplicates. This was a considerable advance since special investigations needed to be conducted to determine such variance ratios. We have discussed models for the smoothing and forecasting of mortality tables (by lives, by amounts, and by lives and amounts jointly). These models make proper adjustment for the presence of duplicates in particular and heterogeneity in general. An attractive feature of our models is that the treatments of mortality data by lives and by amounts are formally the same; this emphasizes that amounts data is fundamentally the problem of duplicates, a point originally made by Forfar et al. (Reference Forfar, McCutcheon and Wilkie1988, Sect. 16.4).
We close by mentioning a number of extensions to model (5.32). One possibility is a model to produce consistent forecasts for more than two populations; one application of actuarial interest is where claims are classified by age, year and duration of policy. A second possibility of interest in demography is to generalize model (5.32) to enable comparisons of mortality between different countries and/or different genders. In such cases, it may be of interest to allow the gap to vary not only by age (as in our lives/amounts example) but also by year; some examples of these models are given in Biatat & Currie (Reference Biatat and Currie2010).
Acknowledgements
We are most grateful to Prof Angus Macdonald and Stephen Richards for useful discussions, and to the referees for their constructive comments. The work of Viani Djeundje was supported by a Dorothy Hodgkin Studentship and by a grant from the CMI; the work of Iain Currie was supported by a grant from the Actuarial Profession. We are also grateful to the CMI for permission to use their data.