


Built environment and residential distance
In the standard account of American urban history, the modern differentiated metropolis had its origins in the antebellum city.Footnote 1 Accordingly, the mixed-use walking city of the late eighteenth to early nineteenth century was characterized by spatial proximity between the social classes. In the antebellum decades, however, urban processes began to move toward greater socio-spatial distances, propelling the formation of the first elite residential enclaves and working-class tenement districts. By the early twentieth century, the Chicago School sociologists described the full-fledged modern metropolis as being defined by functionally and socially separated geographies. Their classic description, hastily theorized perhaps but accurate in many ways, reflected the culmination of developments for more than half a century.Footnote 2
Certainly, this is an oversimplified account, not the least because it overlooks the socio-spatial distances of the early nineteenth-century city. As scholars have widely noted, spatial proximity did not imply social proximity.Footnote 3 Early Republican cities displayed evident patterns of residential separation. To be sure, the walking city imposed significant constraints. Most important, insofar as home and work were integrated under the same roof, elite residents such as merchants found it convenient to maintain their centrally located homes. Moreover, insofar as a commute was limited to walking, the vast majority of citizens had to live within a manageable distance from work. Yet in a dense and confined urban environment of merchant houses, artisan shops and stores, residential separation assumed many forms, like living in a central versus a peripheral location, on a front versus a back street, or at a regular floor versus basement level.
Vertical segregation in particular became a critical form of socio-spatial inequality in Early Republican New York, with cellar dwellings becoming the archetype of substandard housing. Crowded, lightless and prone to flooding in a low-lying coastal city, they typically housed the city's poorest, many of them black, both freed and slaves.Footnote 4 Although merchants, artisans, labourers and slaves may have shared the same street, block, lot or even building, their circumstances could not be more different. It was onto this dense, hodgepodge landscape of socio-spatial mixing that from around the century's second quarter a new logic of residential separation inscribed itself, generating neighbourhoods of distinct social classes. Even as this new horizontal dynamism tended toward pulling the built and social fabric apart, the mid-century city's transitional landscape preserved earlier forms of socio-spatial differentiation. When public health and housing experts identified the tenements and their clustered districts as nineteenth-century New York City's greatest social evil, the horror stories they most often singled out were tenements located on back-lots and cellar dwellings located in tenements. In short, mid-nineteenth-century New York, and other older American cities, displayed a both historically layered and transitional geography of socio-spatial distancing. Yet even as earlier patterns prevailed, the dominant dynamic shifted toward horizontal separation, powering the transformation to a highly differentiated urban geography.
The narrative of this important transition is familiar from the existing scholarship, including the underlying changes: the separation of home and work across artisan trades and white-collar occupations, the formation of central business districts emptied of residents, the emergence of working-class immigrant quarters in decaying central wards, the creation of elite enclaves farther away from the centre, and the growth of new tenement districts nearby industrial areas or marginal locations. By the mid-nineteenth century, anyone visiting New York would have recognized such a horizontally differentiated geography. The notorious Five Points slum or the Lower East Side tenement district became as much part of Manhattan's cognitive social geography as did the opulent uptown enclaves. Between these extremes though, much of the city was defined by mixing, with different social areas blending into each other, and pockets of poverty and wealth dotting the landscape. In sum, mid-nineteenth-century New York was not yet a city of vast socio-spatial separation like the modern metropolis, but it had already acquired many of the formative patterns and processes.
More difficult than to describe these outcomes is to explain how and why such a transition occurred in the first place. What developments propelled people to separate out progressively more into neighbourhoods of different physical and social characteristics? Antebellum New York City experienced extraordinary growth, with its population soaring from 120,000 in 1820 to 800,000 by the Civil War thanks to immigration from Europe and across the United States. Its economy, originally centred on commerce, robustly expanded and diversified into various industrial activities. Accommodating such intense demographic and economic changes put the built environment under enormous pressure, with urbanization consuming vast tracts of newly available land, changing and competing demands on land use transforming entire blocks, streets and districts, housing becoming a scarce and highly differentiated resource, and residents splintering into areas of widely different environmental and health characteristics.
In probing the question, how a new dynamic of horizontal separation emerged, this article explores the connections between built environment and residential geography, a relationship often assumed but seldom carefully studied. Although the literature on antebellum New York's social geography is enormous, with generations of authors – from contemporary public health experts to historians – detailing Manhattan's mosaic of neighbourhoods and their vastly different living conditions, only a few scholars have directly studied how changes in built environment and social geography mutually constituted the city's dramatic mid-century spatial transformation.Footnote 5
Three books in particular stand out, providing a model for this article. Stansell's landmark City of Women presents a most nuanced analysis of how in antebellum tenement New York, working-class women, through their labour, social relations and daily spatial practices, shaped and gave meaning to the physical, social, moral and cultural geographies of an emerging metropolis. Blackmar's Manhattan for Rent brilliantly reconstructs the economic and social formation of Manhattan real estate markets in the early nineteenth century, demonstrating how a new political economy of real estate produced a highly differentiated urban landscape, defined by vastly disparate qualities of residential environments and increasing socio-spatial distances. More recently, Scobey's Empire City masterfully canvases how during the mid-century real estate boom, New York's vast capital markets reassembled the city's entire built fabric along with its social geography, generating continuous spatial change and differentiation. Focusing on different themes, all three authors deeply and effectively engage with spatial research and thinking. Predating Geographical Information Systems (GIS) mapping, however, their spatial analysis is narratively approached and not based in spatial datasets.
Building on their approach that treats the built and social environment as both dynamically changing and constitutive of mid-century New York's transformative urbanization, this article deploys data-driven spatial methods to study how the interaction between the two fuelled a new logic of horizontal socio-spatial separation. Methodologically, the article belongs to the emerging field of urban historical GIS, which recently has re-energized the historical geography of nineteenth-century American cities, including New York. As GIS-based research, and perhaps even more importantly, new large spatial datasets become available, urban historians have an unprecedented opportunity to advance their field by asking new questions and revisiting older discussions, like the one on the origins of modern socio-spatial separation.Footnote 6 This article contributes to this critically important discussion. It asks in what ways did changes in the physical and social geography of the city map onto each other? How did they interact to produce an increasingly differentiated and separated landscape? And what were the social consequences?
For example, as industries expanded, to what extent were inhabitants of different areas inconvenienced? The same question may be asked about a series of other conditions, from the presence of nuisances to high-risk disease conditions. As the physical environment became more differentiated, so did residents respond by moving away from undesirable, and moving closer to more desirable conditions – their choices being limited by income. At the aggregate level, these decisions and constraints added up to recognizable residential patterns. Of course, the causation could also work the other way around, because inhabitants with more resources had greater ability to control their residential settings. The objective in this article is to explore how the interactions between these two dimensions of physical and social geography constituted a new dynamic of socio-spatial distancing.
Datasets
In probing this question with GIS mapping, two sets of spatial data are brought together: one to map the physical environment of the city, the other to map the residential patterns of different classes of residents. The starting point in both cases is the New York Public Library Map Division's recently digitized version of the landmark 1852–54 Perris Fire Insurance Atlas.Footnote 7 This publicly available dataset, created through a carefully designed crowdsourcing effort, contains over 60,000 digitized building footprints, along with the corresponding attribute data embedded in the 98 plates of the atlas. Most valuable of the attributes, it contains land-use designations – based on the conventional taxonomy of residential, commercial, industrial uses, and their mixing – for every building south of 42nd Street, the city's then densely built territory (see Figure 1A for orientation map).
(A) Orientation map. Intensity of (B) Commercial use & ground-floor retail, (C) Industrial use, (D) Residential use.

The dataset provides a both comprehensive and detailed picture of the land-use environment of mid-nineteenth-century Manhattan, though not without limitations for mixed-use buildings. Unlike later maps, the Perris Atlas did not yet record the number of floors in buildings. Its land-use designations therefore prioritize a horizontal view, leaving vertically organized mixed-use activities less systematically recorded. Whereas retail shops on the ground floor of residential buildings were uniformly mapped, industrial uses on their upper floors, typically sweatshops in tenements, generally escaped Perris's street-level perspective, presenting a constraint to study the vertical interactions of industrial and residential geographies. Besides land use, the Perris data also contains exact street addresses for most of the buildings. Accordingly, it can be turned into a building-level historical address locator, which makes it possible to geocode and thus map with great accuracy both residential addresses and the various features of the built environment studied.Footnote 8
The land-use designations of the data allow exploring pertinent questions, such as residents’ relative distance and proximity to industrial or commercial activities. To broaden the scope of the analysis, other environmental conditions were also introduced into the dataset, specifically the location of nuisance-type commercial uses (food trades), undesirable housing conditions such as high-density living and tenement crowding, high-risk disease environments and access to park space. A variety of records – city directories, maps, public health reports – and estimation methods were used to expand the coverage. Where possible, these conditions were then directly geocoded on the Perris building footprints for exact spatial matching.
The factors considered reflect contemporary preferences about desirable versus undesirable environmental conditions.Footnote 9 For example, living close to a small park became a priority of elite New Yorkers precisely in the antebellum period, so much so that park construction served as a strategy for developers to anchor affluent residential enclaves, in turn, augmenting horizontal separation.Footnote 10 Similarly, as others have suggested, the antebellum city's social geography was in many ways a geography of public health.Footnote 11 The fear of disease pushed those who could afford it to move away from what were considered high-risk disease conditions, such as tenement housing with crowded quarters and poor sanitation. Relative distance and proximity to consolidating tenement districts created another dynamic of horizontal separation.
The second dataset used in this article explores the residential patterns of different social strata of New Yorkers. Lacking income data, the approach was to map household heads from a select number of occupations. The mapping process involved first, pulling residential addresses from the digitized 1854 city directory, and second, geocoding those textual addresses with the address locator created from the Perris building footprints.Footnote 12 Admittedly, occupation as a proxy for income has its problems, not to mention the directory's own biases and incomplete coverage of certain groups.Footnote 13 It is well known that women were conspicuously absent from the directories, while commercial occupations were over-represented relative to labouring ones. Nevertheless, in lack of a better alternative, a variety of occupations – ranging from labourers, to grocers, clerks and bankers – have been obtained, producing about 7,500 individual residential addresses. The data offers a broad coverage of the social geography of mid-century Manhattan, which can be compared to the former dataset on the city's physical geography. Notably, this second dataset also prioritizes a horizontal perspective. Directories did not record on which floor New Yorkers lived, and hence the spatial analysis cannot account for vertical differentiations in residential buildings.
Both datasets come from the mid-nineteenth century, the earliest possible moment for such a cartographic analysis. In fact, the Perris Atlas was the first fire insurance map of any American city, providing the necessary detail. The mid-century is also an ideal period to study the city's rapidly changing social geography. By the mid-1850s, New York had undergone two periods of feverish growth, interrupted by the recession of 1837–43. New York was in the midst of its transition from walking city to metropolis, displaying spatial patterns associated with both models. For example, land-use patterns remained generally mixed, even as functional separation, including the consolidation of a downtown central business district, became evident. Similarly, the city's social geography, though still characterized by spatial proximity between the social classes, was changing toward increasing horizontal separation. In other words, when mapping a new dynamic of horizontal separation, one should bear in mind that earlier forms of socio-spatial distancing, such as crowding tenants in cellars or rear-lot buildings, persisted or even intensified, just as the mixing of residential and industrial uses gained new momentum with Manhattan's proliferating sweatshops.
Moreover, mid-nineteenth-century New York had a largely unregulated built environment, with comparatively weak land-use controls.Footnote 14 There were no systematic regulations in place to protect residents from the negative environmental effects of accelerating growth. If one wished to avoid living close to nuisances like slaughterhouses or rear-lot tenements, the best solution was to move to another area free of such conditions. To be sure, this statement should not be considered an absolute. Fire and building codes could impose occasional construction standards, while nuisance laws could restrict on a case-by-case basis the use of private land to protect adjacent owners from negative consequences. More consequential were restrictive covenants, essentially private zoning efforts. Deed restrictions could impose a variety of use controls and building standards to prohibit the development of undesirable conditions in the first place. They could also affect developments across multiple blocks, defining the character of entire residential districts. Whereas elite neighbourhoods were often protected by such private covenants, poor tenement districts were built without any such regulatory concerns, a circumstance that further contributed to an increasingly differentiated built environment.
The rest of the article is organized into two empirical sections. The first one displays the two datasets to establish basic patterns. The second moves beyond such a descriptive approach, presenting a near–far analysis to discuss how the interactions between a progressively more differentiated environment and residential choice created a new dynamic of socio-spatial separation. It offers a geographically more precise account of the process and its outcomes than previously possible. Further, it shows that increasing residential distance was largely the function of elite New Yorkers’ desire to separate out their homes from undesirable conditions.
Display of datasets
For a starting point, it is useful to represent visually the two datasets brought together for the spatial analysis. Figures 1B–1D show the intensity of the three basic land-use types of commerce, industry and residence, by aggregating the Perris building footprints to the level of blocks, the smallest meaningful geographic unit for citywide comparison. Admittedly, block location is less appropriate for commercial establishments, because for a retail shop, the street that it faces generally matters more than the block on which it sits. The commercial map (Figure 1B) therefore also includes residential structures with ground-floor retail, the most common mixed-use arrangement, by aggregating the building footprints to the level of street segments.Footnote 15
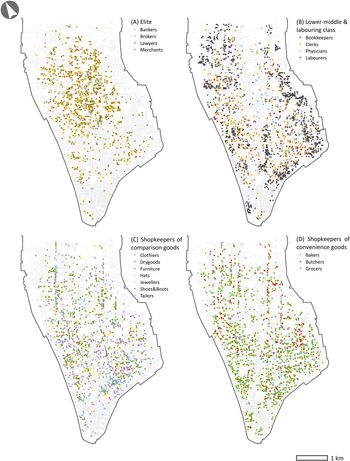
Figures 2A–2D present the second dataset, comprising the residential addresses of different occupations of New Yorkers. The data is grouped into five categories, each containing between 700 and 1,800 individual addresses, including elite occupations (bankers, brokers, lawyers, merchants in Figure 2A), lower-middle-class occupations (bookkeepers, clerks, physicians in Figure 2B), labourers (also in Figure 2B), shopkeepers of comparison goods (clothiers, drygoods, furniture, hats, jewellers, shoes/boots, tailors in Figure 2C) and shopkeepers of provisions (bakers, butchers, grocers in Figure 2D).Footnote 16 The attention given to shopkeepers is warranted, because in a commercial city like New York, they represented some of the largest occupations. They also followed slightly different residential patterns relative to lower-middle-class groups, as well as between the two categories of shopkeepers.
Residences by occupation: (A) Elite, (B) Lower-middle & labouring class, (C) Shopkeepers of comparison goods, (D) Shopkeepers of convenience goods.

Looking at Figure 1B–1D, one observes the layout of a generally mixed-use urban environment. Functional mixing remained the prevailing pattern, despite that by the mid-nineteenth century New York had acquired a handful of specialized functional zones. In particular, the city boasted a consolidated central business district downtown, roughly south of City Hall.Footnote 17 In America's leading seaport, port facilities and related commercial activities also stretched farther north along the waterfronts. Additionally, in the centre of the island, two major thoroughfares, specifically Broadway and the Bowery, focused on commercial activities. Industrial uses also created single-use districts; above all, they became highly clustered near the rivers in the upper half of the island.Footnote 18 Indeed, heading north along the shore, port facilities gradually gave way to manufacturing, reflecting the city's shifting economic engines of growth. An equally prevalent pattern was the dispersal of industrial uses. Even though their intensity varied significantly, industrial uses, especially workshops with smaller footprints, were to be found almost everywhere. Invisible from the map's two-dimensional view, their presence also intensified in the form of tenement sweatshops on all floors, especially in Lower Manhattan.
There is certainly more nuance and specificity to the commercial and industrial geographies of mid-nineteenth-century New York than these rough outlines, a subject explored in detail elsewhere.Footnote 19 Yet for this article, the main concern is to situate residential patterns in relation to the built environment. As the maps show, in specialized districts where commerce or industry dominated, residential buildings were generally absent. Indeed, by this period, the central business district almost completely emptied of residential populations, except for a narrow stretch of blocks west of Broadway along the Hudson River. Similarly, dwellings were largely absent along the waterfront, whether port facilities or industries concentrated there. Beyond these two patterns, however, the maps reveal the near ubiquitous presence of residential structures, with relatively little variation in their use-intensity. This finding is not all that surprising considering that three-fourth of all buildings were dwellings, whereas only one fourth included some commercial, and one sixth some industrial uses, though the latter figure fails to account for sweatshops in tenements.
When comparing the geographies of residential and industrial uses, the prevailing pattern appears to be their general mixing. It seems that no matter where one lived, the proximity of industry was a factor to be reckoned with. Even though many of these industrial uses were unwanted activities at best, nuisances at worst, it is difficult to discern which neighbourhoods might have offered more protected environments. A similar statement can be made about the mixing of residence and commerce, with Figure 1B additionally revealing a generally sprawling geography of ground-floor retail. Still, because the dataset covers more systematically this form of vertical mixing, some patterns emerge. Above all, the concentration of retail activity on major thoroughfares besides Broadway and the Bowery are evident: specifically, Chatham, Division, Grand and Houston Streets on the lower eastern side; Canal, Hudson and Bleecker Streets on the lower western side; and most of the numbered avenues on the upper half of the city.Footnote 20 Further, the intriguing absence of residential buildings with ground-floor retail between Third and Sixth Avenues in upper Manhattan seeks explanation.
Shifting the focus to Figure 2A–2D, one is left on uncertain ground for a different reason. When comparing the map, several patterns emerge, but what to make of them? Most evident is the concentration of elite New Yorkers in the upper central parts of Manhattan. This is in almost perfect contrast to the residential geography of labouring New Yorkers, primarily centred in the lower eastern districts and near the rivers. Lower-middle-class residents display a geography somewhere in between, while shopkeepers present a fourth pattern, not quite like the lower-middle-class group, but certainly different from either elites or labourers. There is also a slightly distinct pattern between the two groups of shopkeepers, with those selling comparison goods being pulled closer to the main thoroughfares, while those retailing provisions living in the heart of residential zones. Evidently, besides the reverse patterns for elites and labourers, residential geographies overlapped across lower-middle class and shopkeeper occupations. It appears that the mixing of social groups within neighbourhoods remained a reality for most of Manhattan. This also suggests the persistence of local hierarchies of socio-spatial distancing, such as living on a main street versus an interior block, on a front- versus a back-lot, or on a lower versus upper floor, with cellars and rear-lot dwellings as the least desirable options.
For those familiar with antebellum New York, some of the residential patterns displayed by the maps are immediately recognizable. It is well known that the wealthiest communities were located uptown, precisely where the map finds the clustering of elite New Yorkers, while labourers exhibit the familiar geographies of centre-city tenement zones, such as the Five Points or the Lower East Side, and the waterfront working-class districts. Certainly, it is easier to locate extremes of wealth and poverty than the wide range of socio-economic conditions in between, where most New Yorkers belonged. Moreover, when comparing these residential patterns to the earlier land-use maps, it is difficult to identify substantial differences in the corresponding built environments. Insofar as industrial uses constituted an undesirable condition, so much so that restrictive covenants often excluded them from elite developments, there had to be meaningful differences in how much they compromised the living conditions of different qualities of neighbourhoods. The same should be true for a variety of other factors, from the disturbing effects of nuisance-type activities to the lack of air and sunlight, or the threat of diseases. Comparing the two sets of maps highlights the need for a more nuanced approach to explore socially meaningful distances in the dense and mixed-use environment of mid-nineteenth-century New York City.
Near–far analysis
The methodology employed is a near–far analysis, specifically developed to detect the subtle socio-spatial variations of a generally mixed-use urban setting.Footnote 21 The underlying idea is to measure relative distances to desirable versus undesirable conditions across different social strata of residents. The analysis is performed in two steps: first, at the level of built environment to map the geography of uneven physical conditions, and second, at the relational level between those conditions and the residential patterns of selected occupations.
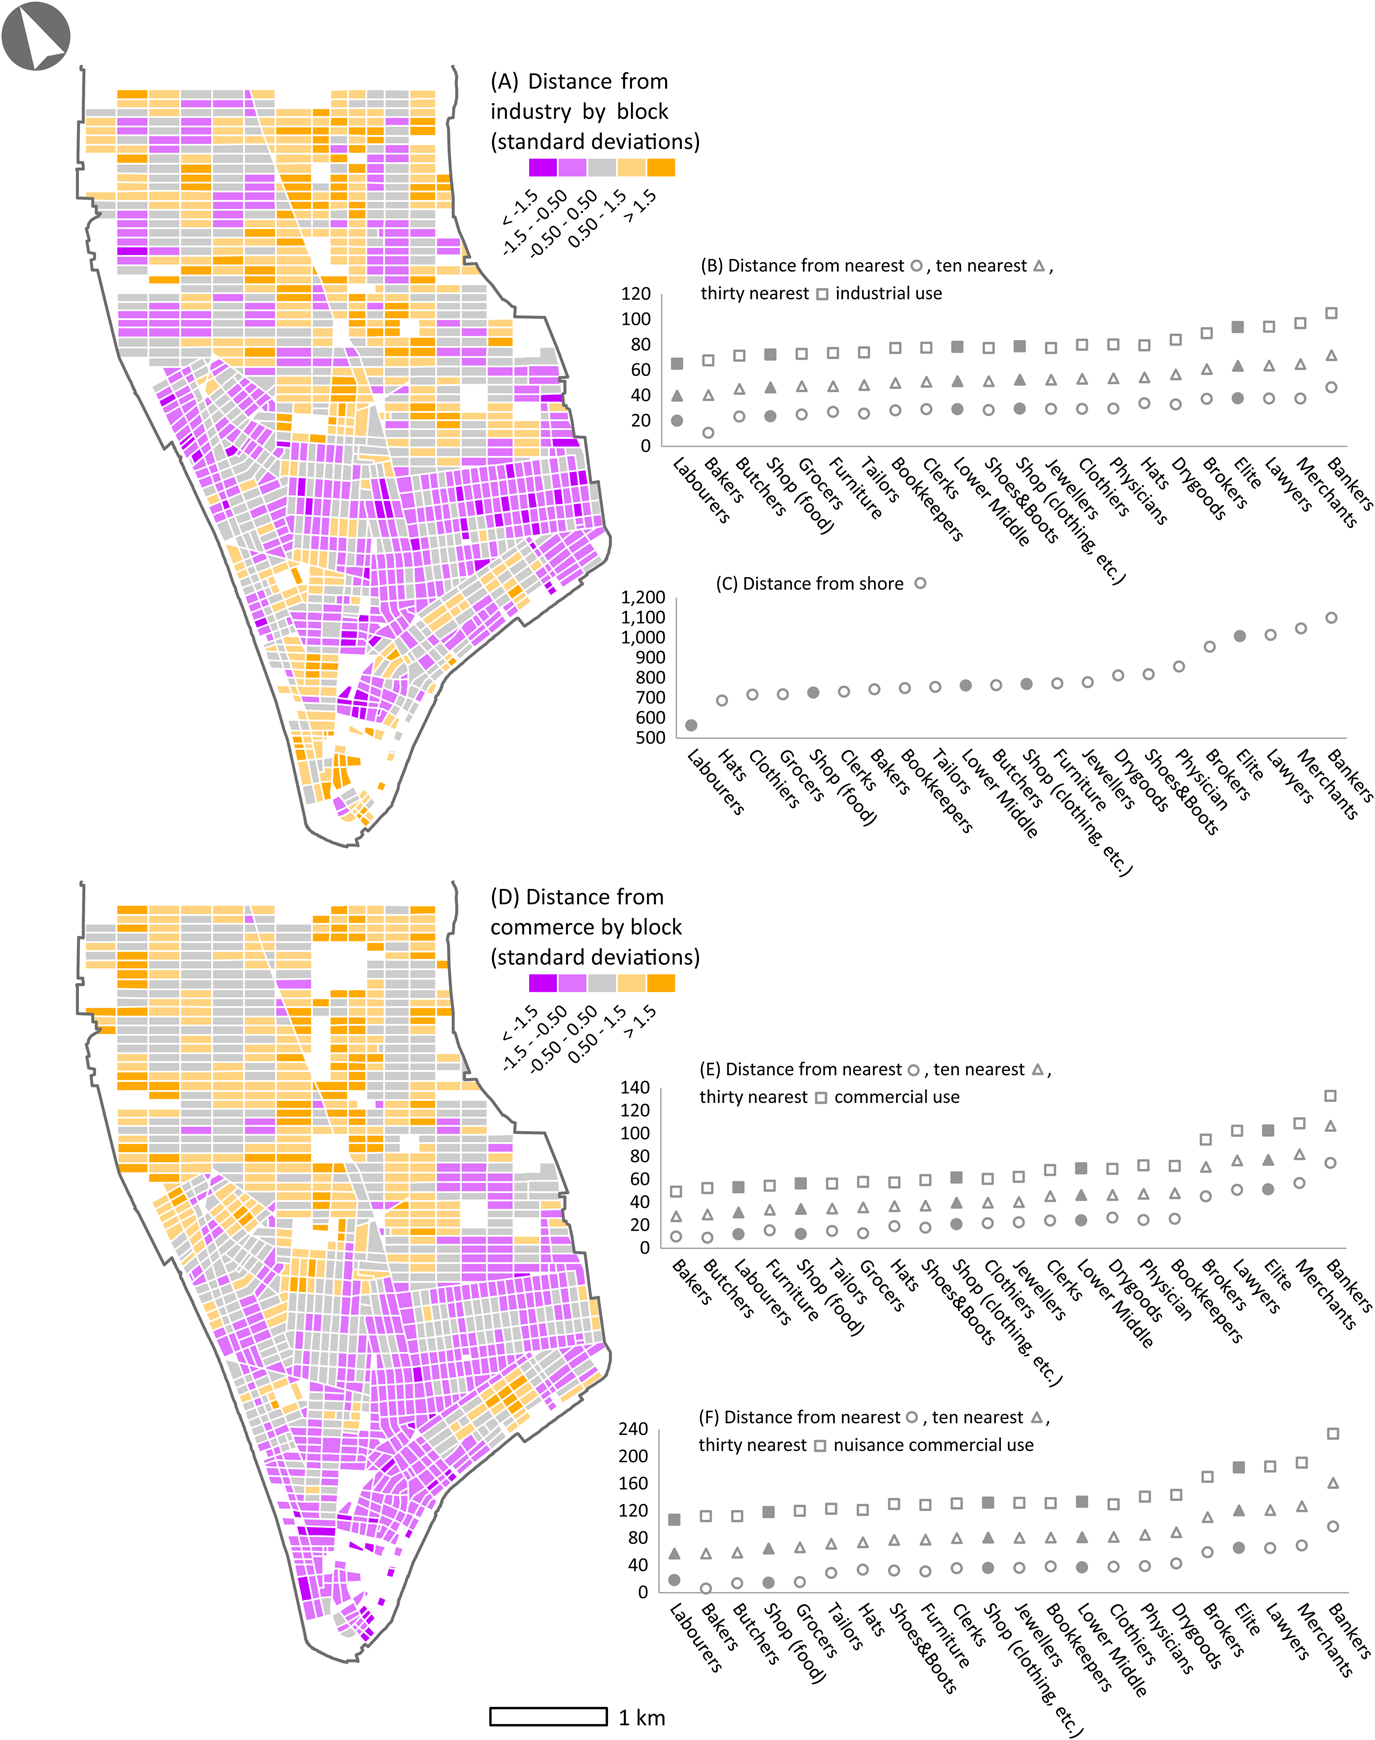
Take the case of industry. The map included in Figure 3A represents at the block-level how relatively near or far residential buildings were located from industrial ones.Footnote 22 The relevant measure was obtained by taking the average distance per block from each residential building to its 30 nearest industrial buildings, and expressing those differences in terms of standard deviations. The approach focuses on horizontal distances, given the data's limitation on the vertical mixing of residence and industry. Still, it identifies meaningful patterns left hidden by the standard approach to mapping land-use intensity. In reading the map, dwellings situated on grey blocks were at an average distance away from industries, whereas those on purple blocks were significantly nearer, while those on brown blocks were significantly farther. In simple terms, those neighbourhoods where the brown blocks dominate offered more desirable residential environments, or at least, they provided greater protection from industries. The next question is where different social classes of residents lived vis-à-vis this industrial geography. To this point, Figure 3B charts average distances between the home addresses of the selected occupations of New Yorkers and the nearest, 10 nearest and 30 nearest industrial buildings.
(A) Separation of residence & industry. Distance from (B) Industry, (C) Shore. (D) Separation of residence & commerce. Distance from (E) Commerce, (F) Nuisance commerce.

Looking at the map, what had earlier appeared as a uniformly mixed-use built environment is now revealed as a more differentiated landscape. In two zones, one finds greater-than-average distances between residential and industrial uses: one is a large and contiguous area in the upper central parts of Manhattan, while the other is located in the few surviving residential blocks downtown near the Hudson River. In these two zones, dwellings were significantly more separated from industries than on the average block. While in the second case, the prevalence of port-related commercial activities provides an explanation, in the uptown zone, the relative absence of industries likely reflected the character of residential developments. The reverse situation, whereby industrial uses were more closely intermixed with dwellings, is also noteworthy. Such areas were mainly located in the older central wards – in particular, north of City Hall between Broadway and the Bowery, corresponding to the notorious Five Points slum, and between Houston and Grand Streets east of the Bowery, especially the Lower East Side – as well as in the waterfront districts. If the map could account for the vertical intermixing of sweatshops, such a pattern of high proximity would likely appear even stronger for the lower central wards.
Recalling the residential patterns of Figure 2A–2D, the central uptown zone, least affected by industries, was where elite New Yorkers lived, just as the centre-city and waterfront areas, more infiltrated by industry, were home to labourers. Clearly, wealthy New Yorkers increasingly sought out residential enclaves more protected from industrial uses, in many cases, using restrictive covenants to exclude them. It is indeed impressive how their privately scaled initiatives created such a large contiguous zone of relative residential seclusion. Consequently, as the graph in Figure 3B shows, elites managed to live at a much greater distance from industry than did labourers. Most people were situated in between these two ends of the social spectrum, and the graph provides measures to account for smaller but meaningful differences. Shopkeepers of comparison goods and lower-middle-class white-collar residents lived at a distance from industry halfway in between elites and labourers, while food purveyors behaved more like labourers, living in areas generally engulfed by industries. For bakers, the nearest industrial uses were usually their own facilities, just as butchers often operated private slaughterhouses. Yet what kept food vendors more typically in such mixed-use areas was the need to live in close proximity to their customers, often in the heart of working-class immigrant neighbourhoods. Even though their economic situation might have allowed many to move to more desirable places, their daily working conditions tied them to low-quality residential areas.
Figure 3C offers additional detail on the question of industry by measuring relative distances to the shore by occupation. Whether port facilities or industrial uses dominated there, the waterfront was an undesirable residential environment. The harbour was dotted by docks, piers and warehouses, along with shops and services that catered to more transient populations, including boarding houses, liquor shops, saloons and brothels. As for the industrial waterfront, large-scale plants, among them noisome facilities such as slaughterhouses, foundries and gasworks clustered there to benefit from cheap land and better transportation. The waterfront also belonged to some of the most flood-prone districts, an environmental hazard on its own right, also affiliated with poor sanitary and health conditions. Overall, living in the centre of the island, farther away from the shore, provided more favourable residential settings. The analysis confirms this, showing elite New Yorkers by far the most distant from the shore, and labourers by far the closest. In between, lower-middle-class residents and shopkeepers of comparison goods lived relatively farther away, while food purveyors lived relatively closer. Notably, the difference between labourers and these intermediary groups was much greater than in the previous case of industrial uses, suggesting the especially disadvantageous environmental conditions of labouring populations. It also points to the emergence of waterfront industrial zones and their clustered working-class housing as a new dynamic of horizontal socio-spatial separation.
Returning to the former discussion on land use, how did near–far relations manifest vis-à-vis commercial uses? With ground-floor retail systematically recorded in the Perris Atlas, in this case the analysis is more sensitive to vertical mixing. Figure 3D reveals a similar pattern to industry, showing uptown residential zones more separated from commercial uses, and central eastern ones, especially the Five Points and sections of the Lower East Side, more engulfed by such activities.Footnote 23 As earlier suggested, downtown residential blocks were at greater distance from industry as they bordered port-related commercial activities, and just the reverse, the northern waterfront areas were more separated from commerce because industrial uses dominated there. In the end, only the elite uptown areas were consistently more separated from both industrial and commercial uses, and, conversely, only the lower eastern districts were consistently more affected by both types of activities. Inasmuch as there were residential-only zones in mid-nineteenth-century Manhattan, elite New Yorkers strived to live in such environments. By keeping industry away, they protected their homes from the adverse effects of nuisance activities, and by keeping commerce at bay, they preserved the tranquillity of their surroundings. Working-class centre-city districts represented the opposite situation, with the highest degree of mixing between residential, industrial and commercial land uses. The degree of functional mixing was evidently an important factor in determining the quality and character of neighbourhoods.
This point is also confirmed by the measures of relative distances by occupation on Figure 3E. Elite residents were a class more removed from commercial activities than the other groups, lower-middle-class occupations came a distant second, followed closely by shopkeepers of comparison goods, then food purveyors and finally labourers. Refining the analysis by focusing only on nuisance-type commercial activities, specifically the provision trades, which generated a fair amount of waste and by-products, does little to change the occupational metrics (see Figure 3F).Footnote 24 It reminds us though that excluding commercial uses not only helped preserve the tranquillity and exclusivity of uptown neighbourhoods by keeping businesses and strangers away, but also offered some degree of protection from alleged nuisances, above all from decaying organic matter, widely assumed to spread diseases via miasmatic emanations.
The issue of nuisance already probes the question of basic living standards. A more direct approach is to investigate housing conditions.Footnote 25 In lack of a housing survey, block-level population densities provide a robust and spatially precise measure of unequal housing situations. In a low-to-midrise urban environment, where residential buildings did not exceed five storeys in height, living on high-density blocks by necessity implied some degree of residential crowding. Dense and crowded living quarters were directly related to and partly responsible for increased health risks and high mortality. They were additionally associated with poor sanitation, in particular the lack of fresh water supply and sewage disposal. At one end, densely packed tenements – further differentiated between buildings on front- versus back-lots, units on upper versus lower floors and, worst of all, cellar dwellings – came to symbolize the environmental hazards of mid-nineteenth-century cities. At the other end, spacious townhouses, furnished with fresh water, sewer and gas pipes set the modern standard for upper-class living, while as expectations changed, elite New Yorkers kept chasing the latest quality standards, driving them farther uptown. It is generally to be expected that those who could afford it, sought out low-density areas, whereas those who could not, often found themselves living in high-density environments. Similarly, as tenements became a crucial housing stock for the poor, elite New Yorkers shunned living nearby them. As always, there were meaningful differences in between, just as there were several intervening factors that determined residents’ degrees of freedom to move. Figures 4A and 4D explore the housing question, first by looking at population density per block, and second, by focusing on the dimension at the bottom-end of the market, which is available from the data, specifically the concentration of rear-lot tenements deprived of air and sunlight.Footnote 26
(A) Population density. (B) Distance from, (C) Concentration in peak density zones. (D) Rear-lot tenement crowding. (E) Distance from, (F) Concentration in tenement crowding zones.

The two maps identify overlapping areas as being characterized by high-density living conditions on the one hand, and the prevalence of rear-lot tenements lacking air and sunlight on the other. These were the Five Points slum, extending all the way down to the East River, and the lower eastern wards, especially the Lower East Side. A small high-density area also included the last remaining residential sections of downtown adjacent to the port. One should note, though, that compared to high-density areas, blocks with a high concentration of tenements were less clustered, indicating the occasional existence of pockets of intense poverty in otherwise not poor areas. The lowest density zones, also least affected by rear-lot tenements, were as expected uptown in the centre of the island. Population densities were as much lower as one fifth of what they were in peak-density districts, an enormous difference, given the minimal variations in building heights. Recalling that the residential land-use map in Figure 1D showed small variations in use-intensity as measured by built-area, this huge discrepancy had to be the result of one key factor: residential crowding.
Turning to the occupational graphs confirms that elite New Yorkers lived at the greatest distance from both high-density and tenement zones (see Figures 4B and 4E). They were also much under-represented among those living in such neighbourhoods (see Figures 4C and 4F). Their ability to distance themselves from such conditions was an order of magnitude greater compared to all the other groups. As for the other categories, the story is less straightforward. To be sure, labourers were over-represented among high-density and tenement zone residents. It is also true that many of them lived farther north in waterfront industrial areas, which explains why on average they lived at a significant distance from these central districts. Interestingly, shopkeepers of both comparison goods and food were also over-represented, and in their case, no similar discrepancy in average distance existed. This underlines an important constraint, namely that retailers often had to live in central neighbourhoods to remain in close proximity to their stores. Even though many might have been able to afford better residential zones, their mobility was limited by their occupation. Food purveyors in particular, whose clients lived within a few blocks radius, were among the most over-represented in tenement areas. They may have mitigated this constraint by living in buildings and on floors deemed more desirable within their dense neighbourhoods. Lower-middle-class residents, for whom such geographic constraints were weaker, fared somewhat better in their horizontal mobility. What is most remarkable about their housing conditions, however, is just how different those were relative to elite New Yorkers.
Few conditions should have mattered as much as differential exposure to health risks.Footnote 27 The housing question already addresses this issue indirectly, but a better approach is to look at specific diseases. Fortunately, there is data available on the occurrence of cholera- and diarrhoea-related mortality at the block-level in 1866.Footnote 28 This is one decade after the Perris Atlas and city directory datasets, yet there is no reason to believe that the built environment or residential patterns changed in any substantial way in this period. Indeed, the city's development came to a halt after 1857, the beginning of a recession, until the end of the Civil War in 1865. It is safe to assume that spatial data on epidemic mortality in 1866 is indicative of the geography of health risks in 1854.
The map in Figure 5A displays the relative distance of dwellings to the 10 nearest cholera- or diarrhoea-related deaths by block. In simple terms, it shows which areas of the city presented greater or lesser epidemic risks to New Yorkers. The map leaves no room for doubt that the uptown central districts were by far the most safely removed from cholera- and diarrhoea-related mortality. The only other similarly safe zone was in downtown, but very few residents continued to live there. On the contrary, the city's lower eastern neighbourhoods, especially the Five Points slum and the waterfront areas, were the most directly exposed, with crowded cellar and back-lot dwellings likely to be the most affected. The corresponding graph makes strikingly clear how such spatial differences turned into class-based demographic inequalities (see Figure 5B). Uptown elites managed to establish by far the greatest distance from cholera- and diarrhoea-related mortality. Labourers, living in centre-city tenement districts and flood-prone waterfront industrial zones, were by far the most directly exposed. In between, lower-middle-class residents kept relatively greater distance, followed by shopkeepers of comparison goods and then food retailers. It is also true that the conditions of these last two groups were similar. It appears that the central location of stores kept many retailers in areas of relatively high health risks, though at least they were more likely to be able to afford the comparatively better housing options within these districts.
(A) Separation of residence & cholera mortality. (B) Distance from cholera mortality. (C) Separation of residence & park space. (D) Distance from park space.

At last, there is another not unrelated factor, directly speaking to how a new logic of horizontal socio-spatial differentiation emerged: access to park space. Public parks became an increasingly desired amenity in American cities by the second quarter of the century. Besides their obvious advantage to provide recreational spaces, they were also believed to improve public health. Under the miasmatic theory, access to fresh air was a vital health concern. Indeed, part of the reason why rear-lot tenements were regarded as the lowest-quality housing was that being situated on back-lots they were deprived of adequate access to fresh air and sunlight. On the contrary, parks not only afforded residents outdoor spaces to socialize and promenade, but they also ensured better ventilation for their surroundings.
By the mid-1850s, New York City was furnished with nine parks in total, most of them constructed in the antebellum era. They predated the world-famous Central Park, built from the late 1850s. These were relatively small-sized parks, mainly frequented by residents from the vicinity. Several of them, including the private Gramercy Park, and Washington, Union and Madison Squares, were explicitly designed as park spaces to anchor the development of elegant residential neighbourhoods.Footnote 29 Given this history, it is no surprise that access to park space was a highly unequal amenity. As the map in Figure 5C shows, the central uptown districts benefited the most from parks, while the most deprived were the lower eastern wards. Differential access is even clearer from the occupational graph (see Figure 5D). Elites lived by far the closest to parks, labourers lived the farthest away, while relative distances varied much less for the other groups.
Conclusions
This article has explored some of the underlying spatial relations that fuelled intensifying residential separation horizontally in the mid-nineteenth-century American city. It brought together two GIS datasets: one describing the built environment of New York and another depicting class-based residential patterns. The objective was to examine more precisely than previously possible how the two dimensions interacted to produce a new dynamic of socio-spatial distancing. The method used was the near–far analysis, designed specifically to discern subtle but socially meaningful distances in the mid-nineteenth-century city's unregulated and mixed-use context. The analysis has identified a variety of patterns, some predictable, others more unexpected, presenting a snapshot of a city in transition toward a more differentiated environment, where residents progressively separated themselves into neighbourhoods of distinct physical and social attributes. This process, in turn, had important consequences to the basic living and health standards of New Yorkers.
On all accounts, and not surprisingly, the analysis has found elite New Yorkers securing for themselves the most favourable environments. What was new about the process, however, was that it involved developing quasi-single-use residential zones, often bolstered by restrictive covenants, to shield inhabitants from a host of undesirable conditions that came to define much of the city. It took the conception and protection of residential use as a distinct urban function, separated out from all other activities, to set in motion a new dynamic of elite resettlement into uptown enclaves, creating some of the most exclusive communities. In the much unregulated and mixed-use context of mid-nineteenth-century New York, however, such expectations could be satisfied only to a degree, that is, relative to other areas. The contrast with the bottom end of the spectrum, including the city's decaying lower eastern tenement zones and developing waterfront industrial districts could not be starker. As expected, these were predominantly working-class immigrant neighbourhoods, suffering from the worst environmental conditions. However, much of Manhattan was characterized by in-between situations: mixed use, proximate to nuisances, encroached upon by crowded tenements and at risk from diseases – all of these, to different degrees. Even as horizontal differentiation became more dominant, older forms of socio-spatial distancing, whether vertically or in relation to street frontage, not only persisted, but in some cases intensified and gained new meaning in the mid-century city's transitional landscape.
Correspondingly, most of those in intermediate occupational groups dispersed across areas with a variety of conditions. There were some patterns to be sure, and what the near–far analysis could achieve was to delineate them more clearly than previously possible. For example, white-collar lower-middle-class residents fared somewhat better than the other groups, in part, thanks to their relatively greater freedom to move within their financial means. Shopkeepers, in contrast, especially those retailing convenience goods like foodstuff, were more constrained in their residential choices, and thus were often stuck in unfavourable living environments, possibly below their means. At least, they were more likely to have the income to mitigate those local conditions by seeking out better dwellings within the district, such as corner buildings or street-facing units on regular floors. The worst-quality housing, including dwellings facing backyards, located in rear-lot tenements, or at the basement level, were occupied by the area's poorest residents. Insofar as much of the city's social geography was a geography of public health, it would be important to learn more about these subtle, localized differences, and whether such degrees of freedom had measurable health impacts. We know more about the extremes of wealth and poverty than the many shades in between. The near–far analysis reminds us that even as spatial processes worked toward pulling the built and social fabric apart, the dominant landscape in the mid-nineteenth-century city was still characterized by subtle variations in conditions and the mixing of different social groups. Understanding these environments and dynamics, and tracing their development toward increasing socio-spatial separation, requires continued GIS analysis on datasets from a few decades later.
For last, as a methodological point, this article has sought to demonstrate the potential of GIS for urban history. Here, GIS mapping confirmed and expanded on earlier insights about the dynamics of residential separation between social groups, by measuring socially meaningful distances both across the city and at a high level of geographic precision previously not possible. It showed how such a systematic but fine-grained approach helps reorient the discussion from the extremes of poverty and wealth to a more nuanced one that integrates subtle but meaningful degrees of difference into our account of how the modern urban environment was produced. The possibilities of urban historical interventions are endless as new, large and high-precision GIS datasets become available. This is a most opportune time for New York City historical GIS, with a variety of newly digitized resources coming online, from fire insurance atlases, to geocoded census microdata, city directories and photo archives.Footnote 30 We are at the verge of gaining access to large-scale and highly detailed digital resources and innovative methods of spatial analysis with the potential to rewrite the historical geography of New York and other cities. More broadly, GIS mapping has the potential to re-energize the spatial turn in history, by strengthening its empirical foundations and introducing new methods of analysis. Urban historians should lead the way in seizing the opportunities.
Supplementary material
The supplementary material for this article can be found at https://doi.org/10.1017/S096392682000019X.