





Impact statement
The construction industry is a major contributor to global carbon emissions, due to the energy-intensive production of conventional mineral materials such as cement and ceramics. This research addresses this challenge by proposing a design-to-biofabrication framework for 3D Biocement Printing (3DBioP), a process that combines robotic extrusion with microbially induced calcium carbonate precipitation (MICP) to create porous mineral building components under ambient conditions. The proposed workflow leverages biological constraints as design drivers, embedding nutrient transport, diffusion accessibility and extrusion-based fabrication limits directly into the geometric logic of porous architectural elements. The successful fabrication of a 1 m2 demonstrator shows the translation of the concept from laboratory specimens to architecturally relevant components. This work establishes a replicable methodology for biofabrication of mineral construction components under ambient conditions, offering a low-embodied-energy pathway for architectural applications such as shading systems and partition walls.
Introduction
Biocement, produced through MICP, offers a pathway to form mineral materials – biocement – under ambient conditions, avoiding the energy-intensive kilns required by conventional construction materials such as cement and ceramic production (Scrivener et al. Reference Scrivener, John and Gartner2018). While the environmental performance of MICP requires further quantitative assessment, prior studies suggest potential reductions in embodied carbon relative to Portland cement-based materials, depending on process configuration and scale (Alotaibi et al. Reference Alotaibi, Arab, Abdallah, Nassif and Omar2022). Realizing this potential at the building scale, however, depends not only on the biology but also on the method in which biomineralization is delivered: because MICP relies on the diffusion of cementation agents through the material, the geometry of a component directly controls how uniformly and how deeply it can be biocemented. Geometry is therefore an active variable of the biofabrication process. Advances in computational design and robotic extrusion-based manufacturing have enabled the precise fabrication of mineral materials, allowing bespoke geometries with optimized performance and reduced material waste at the building-scale (Gibson et al. Reference Gibson, Rosen and Stucker2015). Coupling MICP with computational design and extrusion-based 3D printing thus opens the possibility of mineral building components whose form is calibrated to their own biological formation. Recent work has begun to translate this coupling into practice. The feasibility of 3D-printing structures with ureolytic MICP has been demonstrated across several bio-ink and substrate systems at small scale (Antorveza Paez et al. Reference Antorveza Paez, Ling, Mahamaliyev, Bauer and Dillenburger2024; Dutto et al. Reference Dutto, Bianda, Melo, Saraw, Tervoort and Studart2025; Nething et al. Reference Nething, Smirnova, Gröning, Haase, Stolz and Sobek2020; Schaffner et al. Reference Schaffner, Rühs, Coulter, Kilcher and Studart2017), and studies integrating cyanobacterial MICP into extrusion-based sand systems have highlighted the need to synchronize biological viability with fabrication constraints (Armaly et al. Reference Armaly, Iliassafov, Kirzner, Kashi, Barath, Turrin, Andriotis and Rafiee2023; Dranseike et al. Reference Dranseike, Cui, Ling, Donat, Bernhard, Bernero, Areeckal, Lazic, Qin, Oakey, Dillenburger, Studart and Tibbitt2025). At these scales, however, the geometric, fabrication and assembly requirements of MICP can be treated largely independently; at architectural scale they become coupled, since toolpath continuity, overhang behavior, pore connectivity and mineralization depth co-determine one another. Our previous work established the 3D Biocement Printing (3DBioP) process at the material and component levels, including bio-ink rheology, mineralization mechanisms and the fabrication of decimeter-scale elements (Antorveza Paez et al. Reference Antorveza Paez, Kindler, Terzis, Dutto, Pleij, Zorzetto, Studart and Dillenburger2026). The present study addresses the complementary challenge of translating these biological and fabrication constraints into a computational design methodology for architecturally relevant components.
In contrast to inert material systems, cell-compatible fabrication typically relies on hydrogel or gel-like pastes, whose low shear strength limits achievable geometric complexity, particularly with respect to overhangs and unsupported spans (Malda et al. Reference Malda, Visser, Melchels, Jüngst, Hennink, Dhert, Groll and Hutmacher2013). Moreover, since 3DBioP requires controlled curing depth and diffusion accessibility, common strategies used in other extrusion-based systems to improve the self-supporting capacity of large overhangs, such as rib supports (Huang et al. Reference Huang, Xu, Anton and Dillenburger2024) and infill structures (Liu et al. Reference Liu, Zhou, Wei and Lin2021), are not directly transferable to MICP. Existing approaches treat these coupled constraints as fabrication limitations, whereas a methodology that incorporates them as intrinsic design drivers remains underdeveloped. Accordingly, we investigate how the geometric requirements of MICP and the constraints of robotic extrusion can be co-parameterized within a single design framework that simultaneously evaluates buildability and biological performance. The workflow is demonstrated through the development of modular porous components assembled into an architectural shading system, positioning 3DBioP fabrication logic as a framework for geometry-driven biodesign strategies grounded in material efficiency.
Background
Engineered living materials (ELMs) through MICP
Engineered living materials (ELMs) are materials in which biological activity is intentionally integrated to produce, transform or assemble matter (Rodrigo-Navarro et al. Reference Rodrigo-Navarro, Sankaran, Dalby, del Campo and Salmeron-Sanchez2021). Within this context, MICP or biocementation, is a biological process in which microorganisms precipitate calcium carbonate as a metabolic byproduct, forming a stable, inert mineral material. Among the microorganisms used, Sporosarcina pasteurii is widely studied for its high ureolytic activity and reliable calcium carbonate precipitation efficiency (Wu et al. Reference Wu, Li and Li2021). S. pasteurii is a urease-producing bacterium which hydrolyzes urea to release carbonate ions that precipitate as calcium carbonate in the presence of calcium (Wu et al. Reference Wu, Li and Li2021). While MICP has been successfully applied in soil stabilization (DeJong et al., Reference DeJong, Mortensen, Martinez and Nelson2010), self-healing concrete (Jonkers et al. Reference Jonkers, Thijssen, Muyzer, Copuroglu and Schlangen2010) and the production of discrete masonry elements (“Biomason” 2021), translation into integrated architectural workflows remains limited. The mechanical performance of these biomineralized systems typically yields compressive strengths ranging from 2 to 12 MPa, depending on sand packing density, bacterial concentration and cementation cycles (Terzis et al. Reference Terzis, Laloui, Dornberger and Harran2020; Smirnova et al. Reference Smirnova, Nething, Stolz, Gröning, Funaro, Eppinger, Reichert, Frick and Blandini2023). Although this range remains below that of conventional structural concrete, it is suitable for non-load-bearing applications such as partition walls, façade elements and shading systems. Ureolytic 3DBioP biomineralization requires immersion in liquid cementation agents such as urea and calcium salts. Therefore, geometry must enable uniform diffusion of these agents. Excessive thickness or blocked flow paths result in incomplete biomineralization. Geometry thus becomes the mediator between structural stability and biological activation.
Porosity and geometrical constraints in 3DBioP
Porous structures are widely found in nature, with representative examples including bone and skeletal systems, cork, plant tissues, corals and cellular foams. These systems derive their performance from the spatial organization of matter and voids, in which individual pores can be understood as cells and the spaces they generate as interconnected voids, enabling a range of functional adaptations, such as lightness, transport and exchange (Musaddiq Reference Musaddiq and Musaddiq2025). Similar principles apply in architecture, where controlled porosity supports thermal regulation (Dutto et al. Reference Dutto, Zanini, Jeoffroy, Tervoort, Mhatre, Seibold, Bechthold and Studart2023), material efficiency (Bedarf et al. Reference Bedarf, Szabo, Scoccimarro and Dillenburger2023) and bio-receptive behavior in envelopes and partition systems (Cruz and Beckett Reference Cruz and Beckett2016). In the context of 3DBioP, pore network is not only structural but also functional: it influences the diffusion of cementation agents and the surface exposure of embedded bacteria. Geometric porosity, therefore, directly affects biomineralization efficiency.
Additive manufacturing (AM) enables the precise design and fabrication of geometrical porosity by directly encoding topology, hierarchy and material distribution through layer-by-layer deposition (Velasco-Hogan et al. Reference Velasco-Hogan, Xu and Meyers2018). It also offers the potential to increase the effective surface area of a given geometry due to the undulations formed between successive deposited filaments (Figure 1B-v). Moreover, incorporating overhang geometries will introduce lateral offsets between layers, thereby further increasing the exposed surface area. In this context, porous geometries with controlled overhang conditions are well suited for biomineralization processes, as they facilitate the diffusion of cementation agents throughout the printed structure. In this study, interconnectivity refers to the accessibility of internal voids from the external boundary through continuous diffusion pathways, rather than the requirement that all voids belong to a single connected domain. Connectivity alone is not sufficient: narrow constrictions or excessive tortuosity can still impede diffusion, which is why the triply periodic minimal surface (TPMS)-derived geometries used here maintain pore openings comparable to or larger than the bead width.
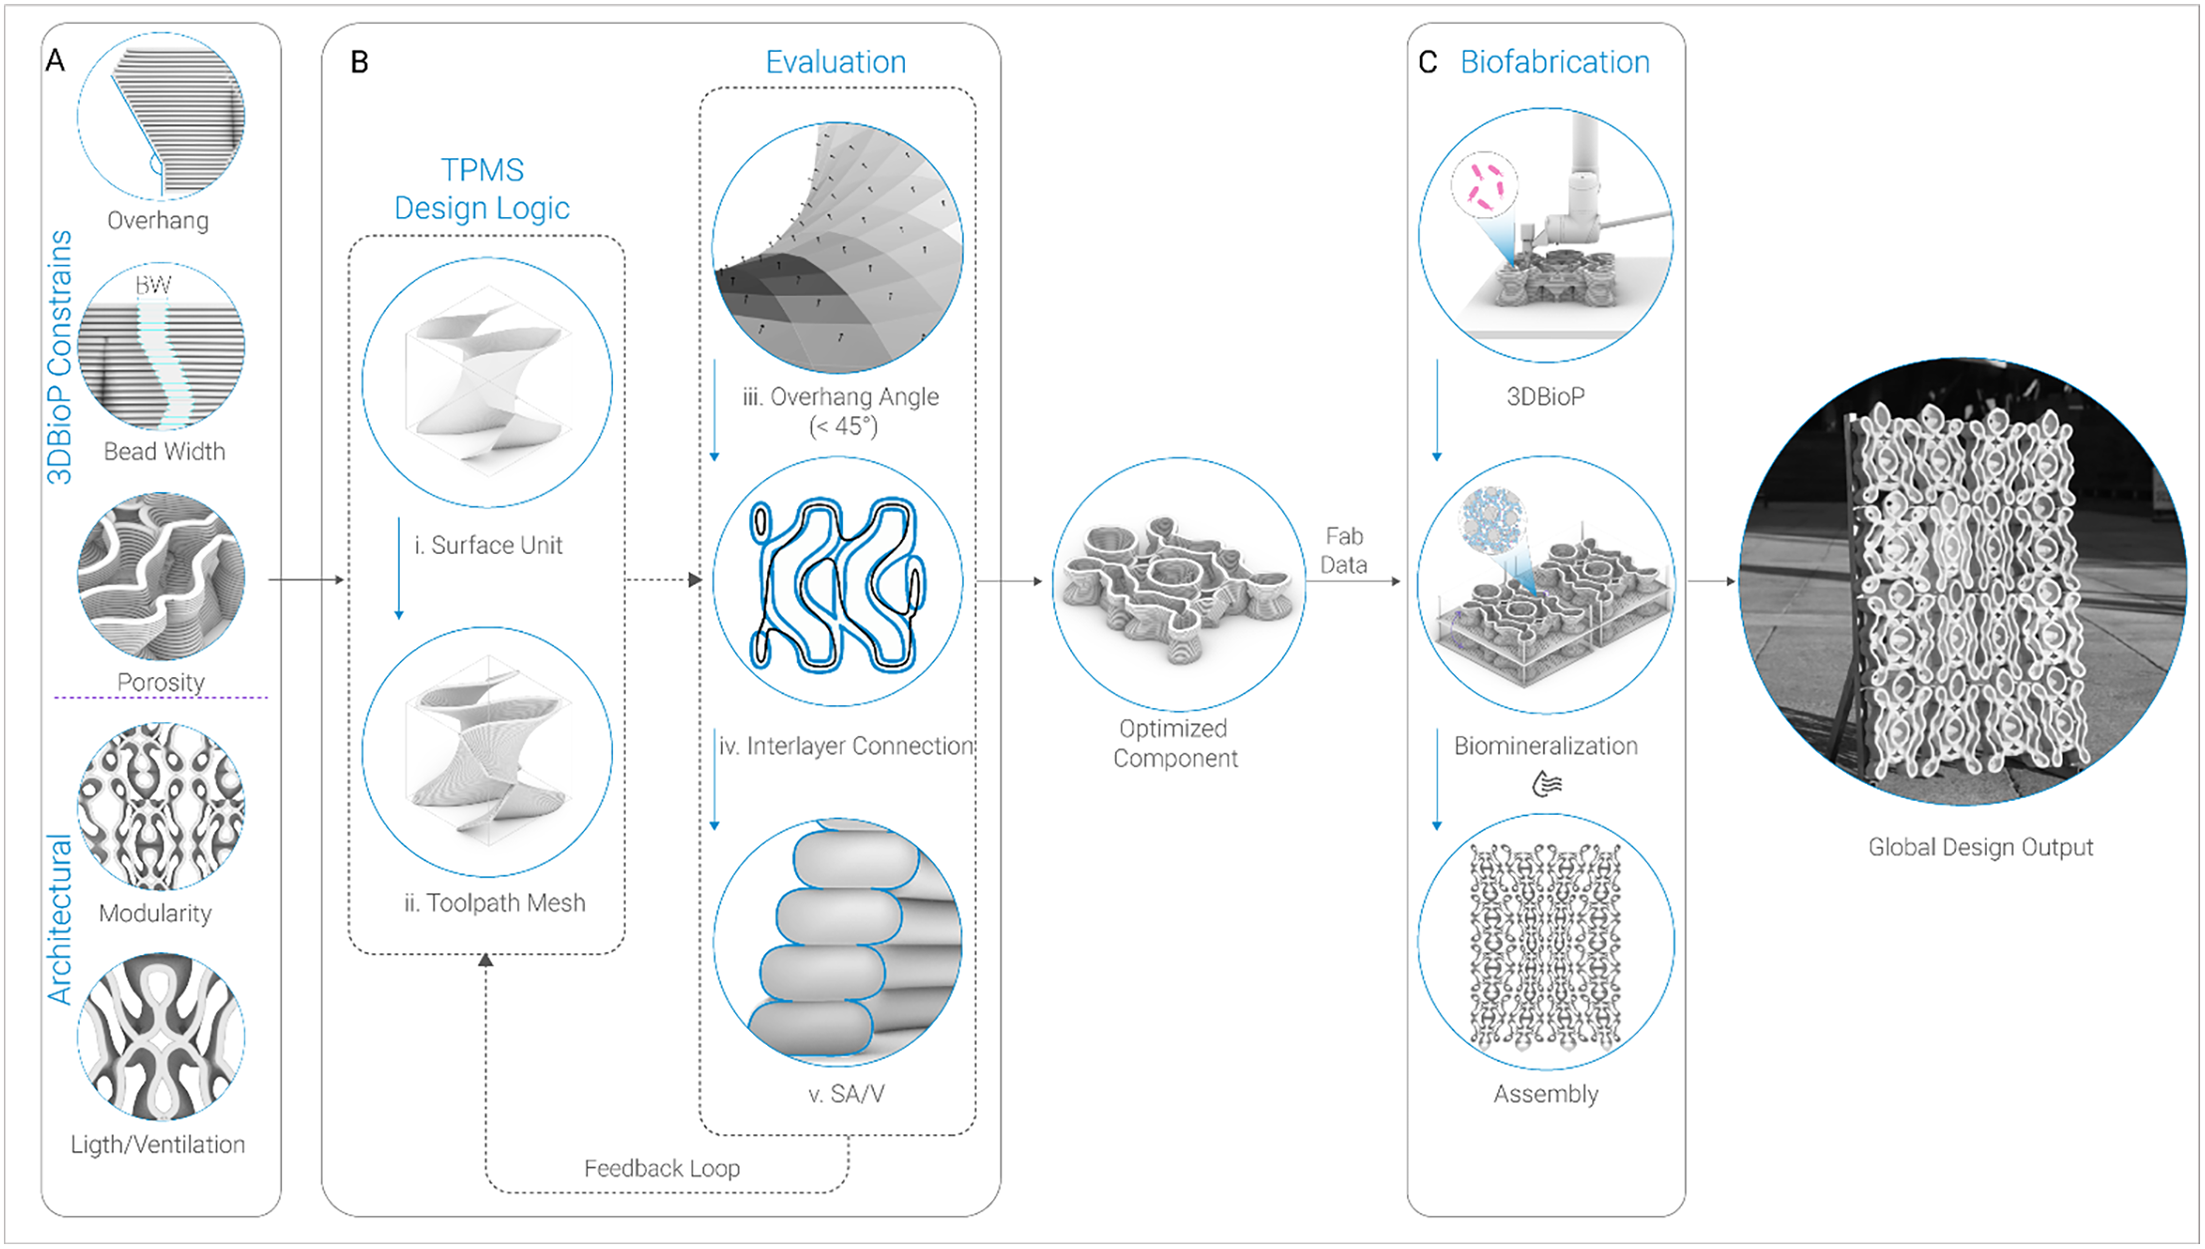
Integrated framework for porous 3DBioP components. (A) Design constraints, grouped as 3DBioP-related (overhang, bead width, porosity) and architectural (modularity, light/ventilation). (B) TPMS-based design logic: a base surface unit is translated into a toolpath mesh and refined through an evaluation loop (overhang angle, interlayer connection, SA/V). (C) Biofabrication stages: 3DBioP, biomineralization and assembly into the 1 m2 demonstrator.

TPMS as a design strategy for 3DBioP
To achieve porous geometry, this research adopts TPMS, which are mathematically defined implicit surfaces characterized by zero mean curvature, high periodicity and non-self-intersecting topologies (Feng et al. Reference Feng, Fu, Yao and He2022). These characteristics provide pore accessibility critical for ensuring the unobstructed transport of chemical agents during the immersion process. TPMS also includes substantial overhangs that can help to increase the interlayer surface area. Unlike stochastic or irregular porous structures, which often contain “dead-end” pores that inhibit fluid flow (Velasco-Hogan et al. Reference Velasco-Hogan, Xu and Meyers2018), TPMS offer a more predictable internal organization, making them suitable as a geometric starting point for evaluating the relationships among surface area, porosity and fabrication constraints. Moreover, from a design perspective, TPMS offers volumetric qualities such as light transmission, ventilation, acoustic and thermal behavior and depth-of-field esthetics that motivate a porous architectural element. TPMS also introduces overhang geometries that, in extrusion-based 3DBioP, further increase the surface available for mineralization. Although these overhangs can be excessive, they follow a periodic, mutually supporting pattern that can be adapted without compromising the overall porous topology.
Printing TPMS geometries with 3DBioP poses specific fabrication challenges because the material is a water-based hydrogel composite whose initial shape retention primarily relies on the hydrogel network’s rheological behavior before biomineralization (Schwab et al. Reference Schwab, Levato, D’Este, Piluso, Eglin and Malda2020). Unlike thermoplastics, which rapidly solidify through cooling, or cementitious systems, where hydration reactions accelerate early mechanical stabilization (Reiter et al. Reference Reiter, Wangler, Roussel and Flatt2018), the mechanical reinforcement of 3DBioP develops progressively through immersion-based MICP after printing. Consequently, the printed material exhibits significantly lower mechanical stability during fabrication than in its final mineralized state, reducing its self-supporting capacity and increasing susceptibility to collapse in unsupported regions. While scaling TPMS geometries along the Z-axis may reduce local overhang angles, it has limited influence on near-horizontal spans, particularly under extrusion-width constraints (5 mm in this study, corresponding to the approximate mineralization penetration depth). In addition, such scaling reduces the number of TPMS repetitions per unit volume, thereby decreasing overall porosity and surface accessibility. Consequently, a geometric adaptation strategy was required to preserve the porous, interconnected characteristics of TPMS geometries while more uniformly redistributing overhang conditions to maintain printability.
Research aim: TPMS as a geometric strategy for 3DBioP
TPMS provide the multi-directional porosity and predictable interconnectivity that MICP requires, but they are not directly printable with low-shear-strength bio-inks: their near-horizontal overhangs and continuously curving spans exceed the self-supporting capacity of the hydrogel-sand matrix during deposition. While existing studies have successfully demonstrated the feasibility of MICP using various AM strategies, these efforts have primarily focused on material exploration at the laboratory scale, and established workflows that address the complex interdependencies between biological requirements, the fabrication constraints of low-shear-strength hydrogels and the requirements of large-scale architectural assemblies remain lacking. This research develops a design-to-biofabrication framework that leverages biological process requirements to drive geometric differentiation. The objective is to move beyond discrete material tests toward a multi-scale process that coordinates the microscopic needs of nutrient transport with the macroscopic requirements of robotic extrusion. By utilizing TPMS, the study investigates how geometry can be adapted to ensure structural self-support during 3D printing while maintaining the porosity required for post-printing biomineralization. The investigation focuses on transitioning MICP from isolated material tests to a design methodology for non-load-bearing architectural components.
Methods
The integrated workflow: from unit to assembly
The methodology consists of a three-phase process integrating computational geometry, geometric evaluation and robotic biofabrication to address the physical requirements of 3DBioP (Figure 1). Phase A defines the design constraints, grouping them into two categories: 3DBioP constraints (overhang capacity, bead width and pore network), which derive from the rheology of the bio-ink and the requirements of microbial mineralization; and architectural constraints (modularity and light/ventilation), which derive from the intended function of the component as a partition and shading system (Figure 1A). Phase B translates these parameters into TPMS-derived geometries evaluated through overhang angle, interlayer continuity and SA/V metrics (Figure 1B, right column). A feedback loop iteratively refines the geometry until all three criteria are satisfied, resulting in an optimized component. Phase C executes the validated design through a two-stage fabrication sequence consisting of robotic 3DBioP, followed by ureolytic MICP through immersion in cementation media, drying at ambient temperatures and subsequent assembly of the modules into the architectural demonstrator (Figure 1C).
Biological constraints and architectural intent
The architectural application defines the mechanical boundary conditions for the design process, in which the proposed system functions as a partition and shading element, primarily subjected to self-weight and minor handling loads. To meet these functional requirements, the target mechanical performance aligns with the reported compressive strengths of MICP-treated sand systems described above. Consequently, geometry is developed to ensure structural continuity without increasing overall mass, with a focus on efficient material distribution. A critical driver in this phase is the wall thickness constraint, carefully calibrated to ensure uniform biocementation and prevent the formation of partially consolidated or soft cores. Simultaneously, the internal pore network is engineered to maintain continuous multi-directional diffusion pathways, enabling the homogeneous diffusion of cementation agents throughout the entire volume. This requirement for multi-directional porous topology ensures that no section of the geometry is shielded from the nutrient-rich media during immersion. The design intent thus operates as a precise calibration between architectural functionality and biological activation, defining the geometric search space and establishing the biological and structural prerequisites prior to any fabrication testing.
Empirical observations and geometric limitations of TPMS with 3DBioP
Building upon these constraints, the design process adopts a bottom-up logic that treats the individual TPMS unit as the fundamental building block of the architectural system. To translate the theoretical advantages of TPMS into printable components, a computational workflow was developed using Axolotl (Bernhard and Dillenburger Reference Bernhard and Dillenburger2018), a volumetric modeling plug-in for Rhino Grasshopper. Unlike mesh-based modeling, this approach uses signed distance functions (SDFs), which represent geometry as a field of values rather than explicit surfaces (Hesselgren Reference Hesselgren2018). This strategy enables seamless blending of topologies and precise control over wall thickness. In this study, four TPMS units (Diamond, Gyroid_Double, Gyroid_Double_Periodic, Schwarz_P_Periodic) were selected, primarily guided by design considerations, while deliberately establishing geometric contrast across the units, enabling a systematic comparison between long, continuous print paths (e.g., the two Gyroid variants) and shorter ones (e.g., Schwarz P), as well as between periodic and non-periodic configurations. Initial printability tests were conducted on modules measuring 80 mm × 80 mm × 80 mm to establish the material’s geometric boundaries. These units were sliced directly within the volumetric environment to generate robotic toolpaths.
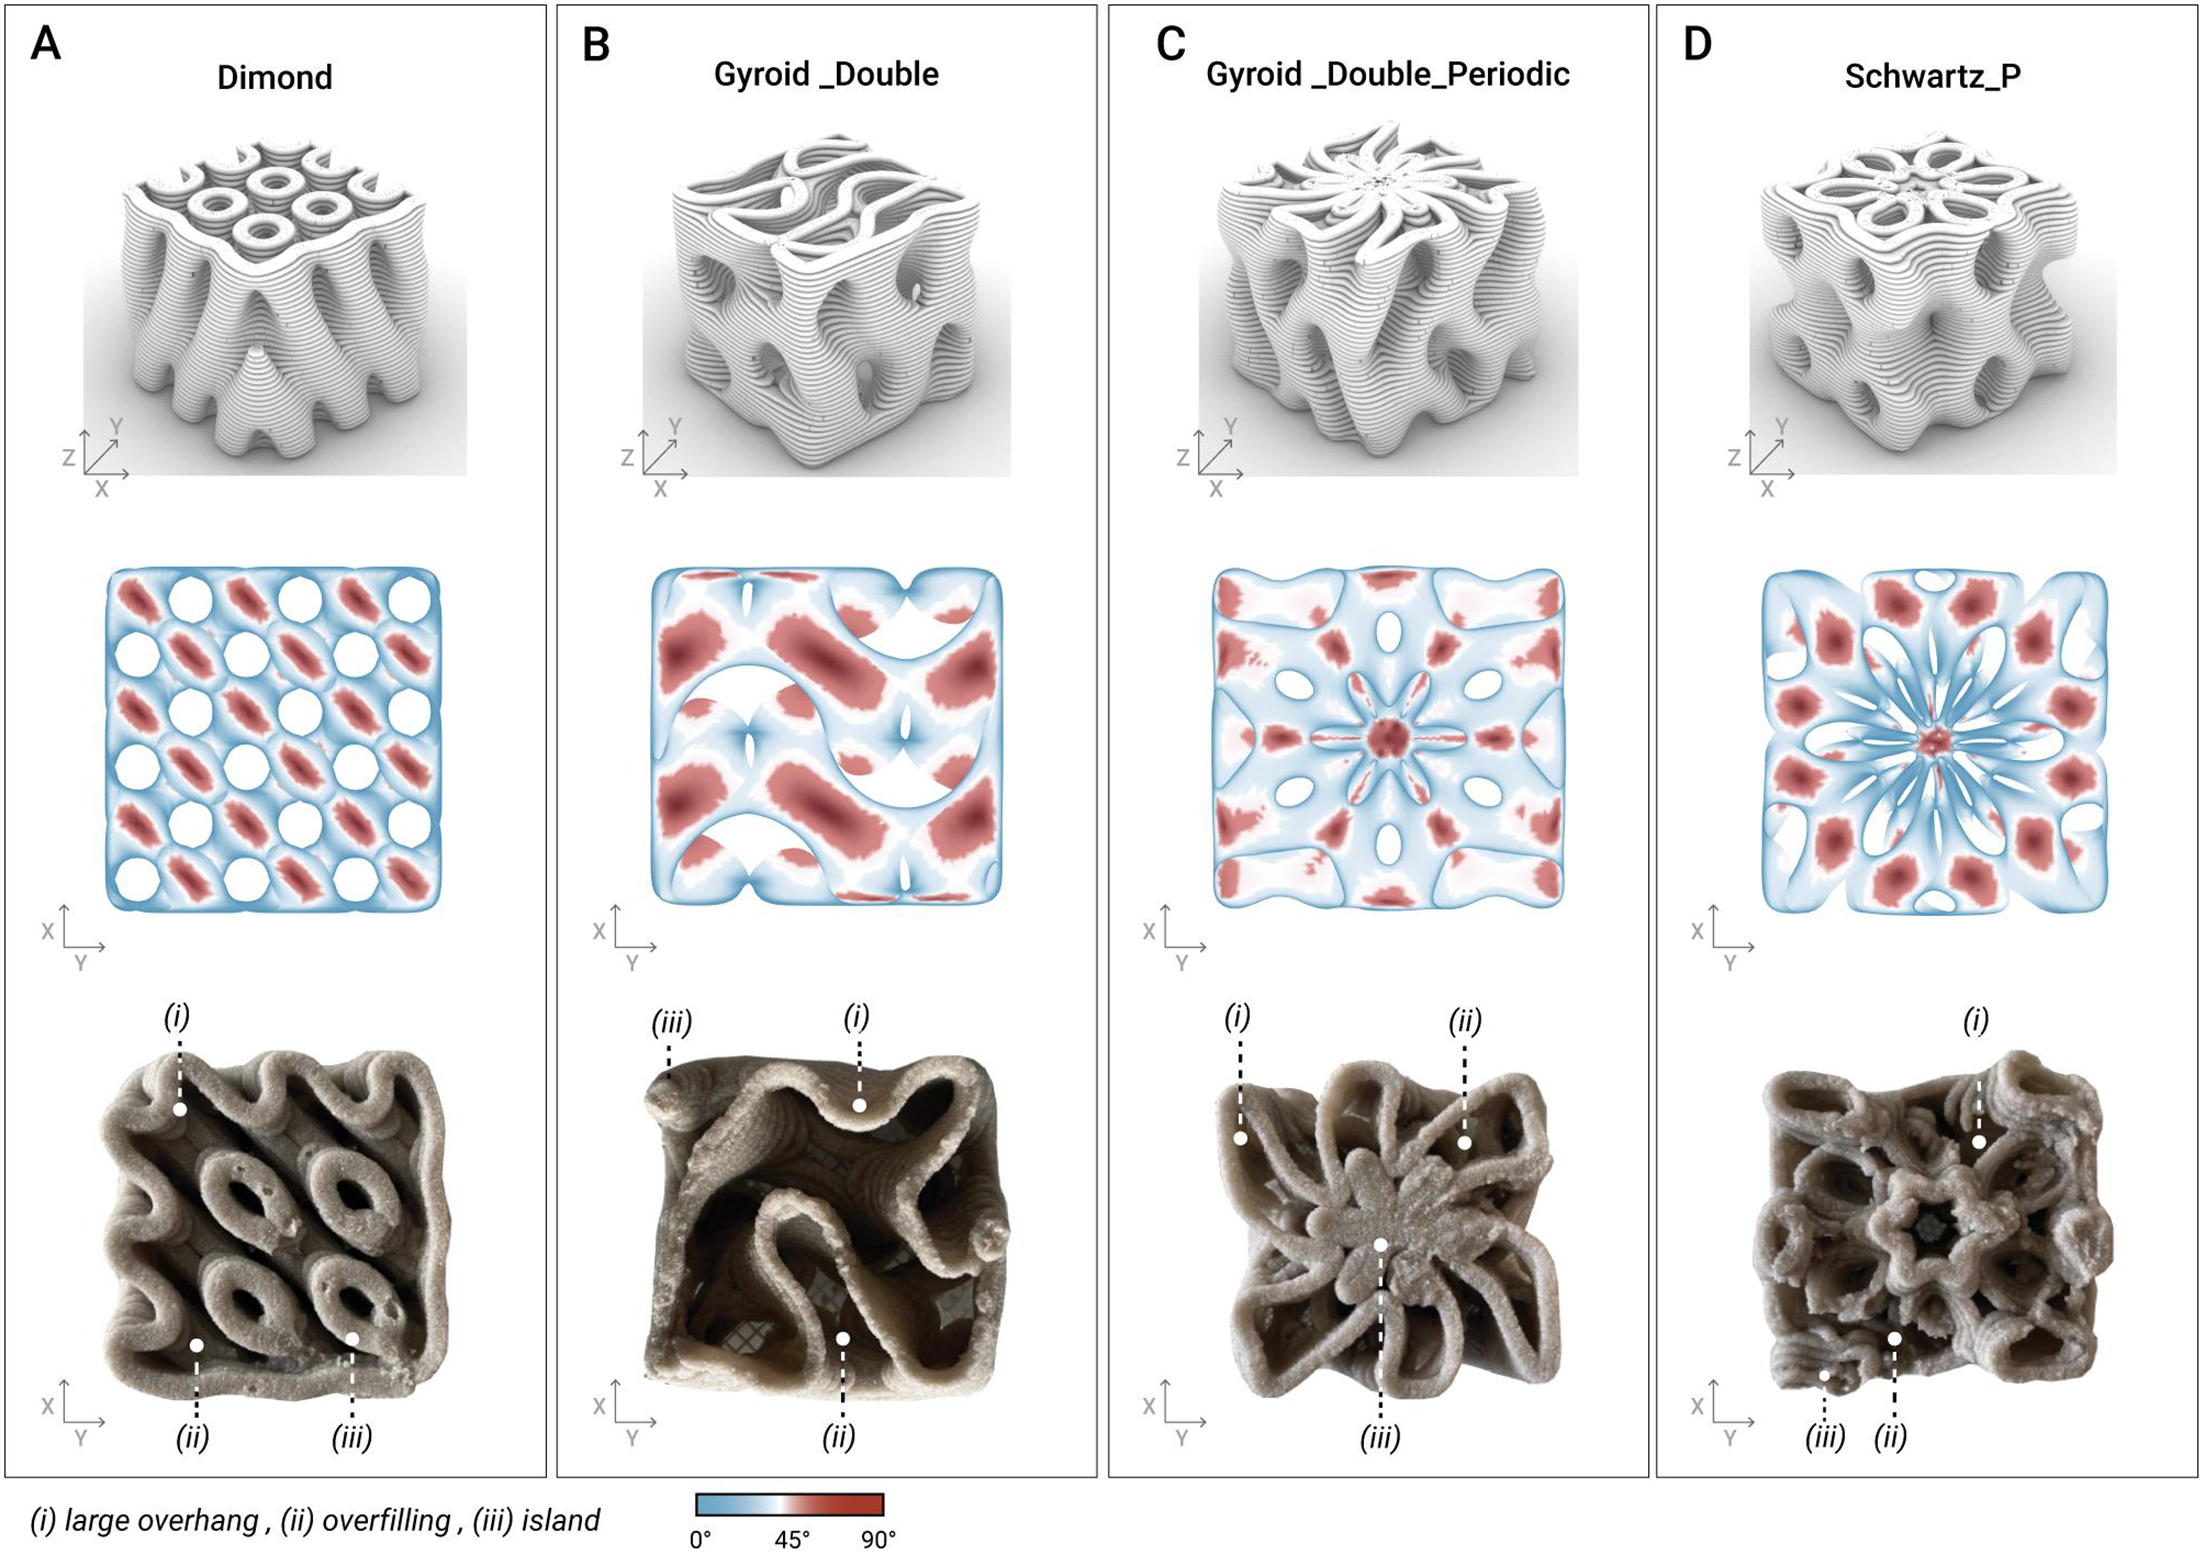
The initial tests provided valuable insights into the discrepancies between the digital models and the actual printed outputs (Figure 2). Each unit exhibited distinct printability challenges: The Diamond model (Figure 2A) exhibited successful print quality, but its geometric density was too high, resulting in increased stability at the cost of excess material use. The Gyroid_Double model (Figure 2B) remained stable during the initial tests; however, its periodic rotational arrangement led to excessive material accumulation at the center of the unit, preventing the solution from penetrating the structure. The Gyroid_Double_Periodic model (Figure 2C) exhibited continuous and long print paths, which contributed to overall print stability. However, it also features continuously overhanging surfaces that leave filaments unsupported during printing, resulting in significant misalignment between the digital and physical models. The Schwarz_P_Periodic model (Figure 2D) exhibited the most significant collapse, driven by discontinuous toolpath segments that necessitated frequent extruder start–stop operations. These tests established geometric design constraints, including a maximum overhang angle (45°) and a minimum continuous print-path length of 100 mm. Additionally, wobbling occurred during the printing of longer, free-standing walls, due to the material’s gel-like consistency. Key parameters, including nozzle size, printing velocity and extrusion speed, were carefully controlled to optimize print quality (see Table 1). These constraints reflect the printability envelope of the calibrated bio-ink, whose yield stress and shear-thinning behavior determine the maximum self-supporting overhang and the minimum stable path length under continuous extrusion.
Initial comparative evaluation of TPMS geometries for 3DBioP. (A) Diamond, (B) Gyroid_Double, (C) Gyroid_Double_Periodic, (D) Schwarz_P. Top row: digital representation of the volumetric units. Middle row: top view of overhang angle analysis visualization. Bottom row: top view of corresponding 3D-printed prototypes highlighting printing characteristics.

Fabrication parameters

Table 1. Long description
A table with three rows and five columns compares fabrication parameters for different samples. The columns are labeled Sample, Robot vel [mm/s], Layer height [mm], RPM [mm^3/s], and Nozzle size [mm]. The row labels are TPMS initial, Custom unit, and Optimized unit. Row 1: TPMS initial, Robot vel 20, Layer height 2, RPM 232, Nozzle size 4. Row 2: Custom unit, Robot vel 20, Layer height 2, RPM 232, Nozzle size 4. Row 3: Optimized unit, Robot vel 30, Layer height 2, RPM 232, Nozzle size 6.
Evaluation criteria
To relate the digital model to both 3D printing behavior and biomineralization potential, three criteria are proposed in this study. Overhang angle and interlayer connection evaluate mechanical printability, while SA/V is optimized to enhance biomineralization efficiency. These parameters are interdependent: increasing SA/V typically results in steeper overhangs and reduced interlayer contact, compromising fresh-state stability. Conversely, geometries optimized purely for printability tend to be denser, limiting nutrient diffusion and reducing mineralization efficiency. The evaluation matrix was used to identify geometries capable of maintaining extrusion stability while maximizing exposed mineralization surface.
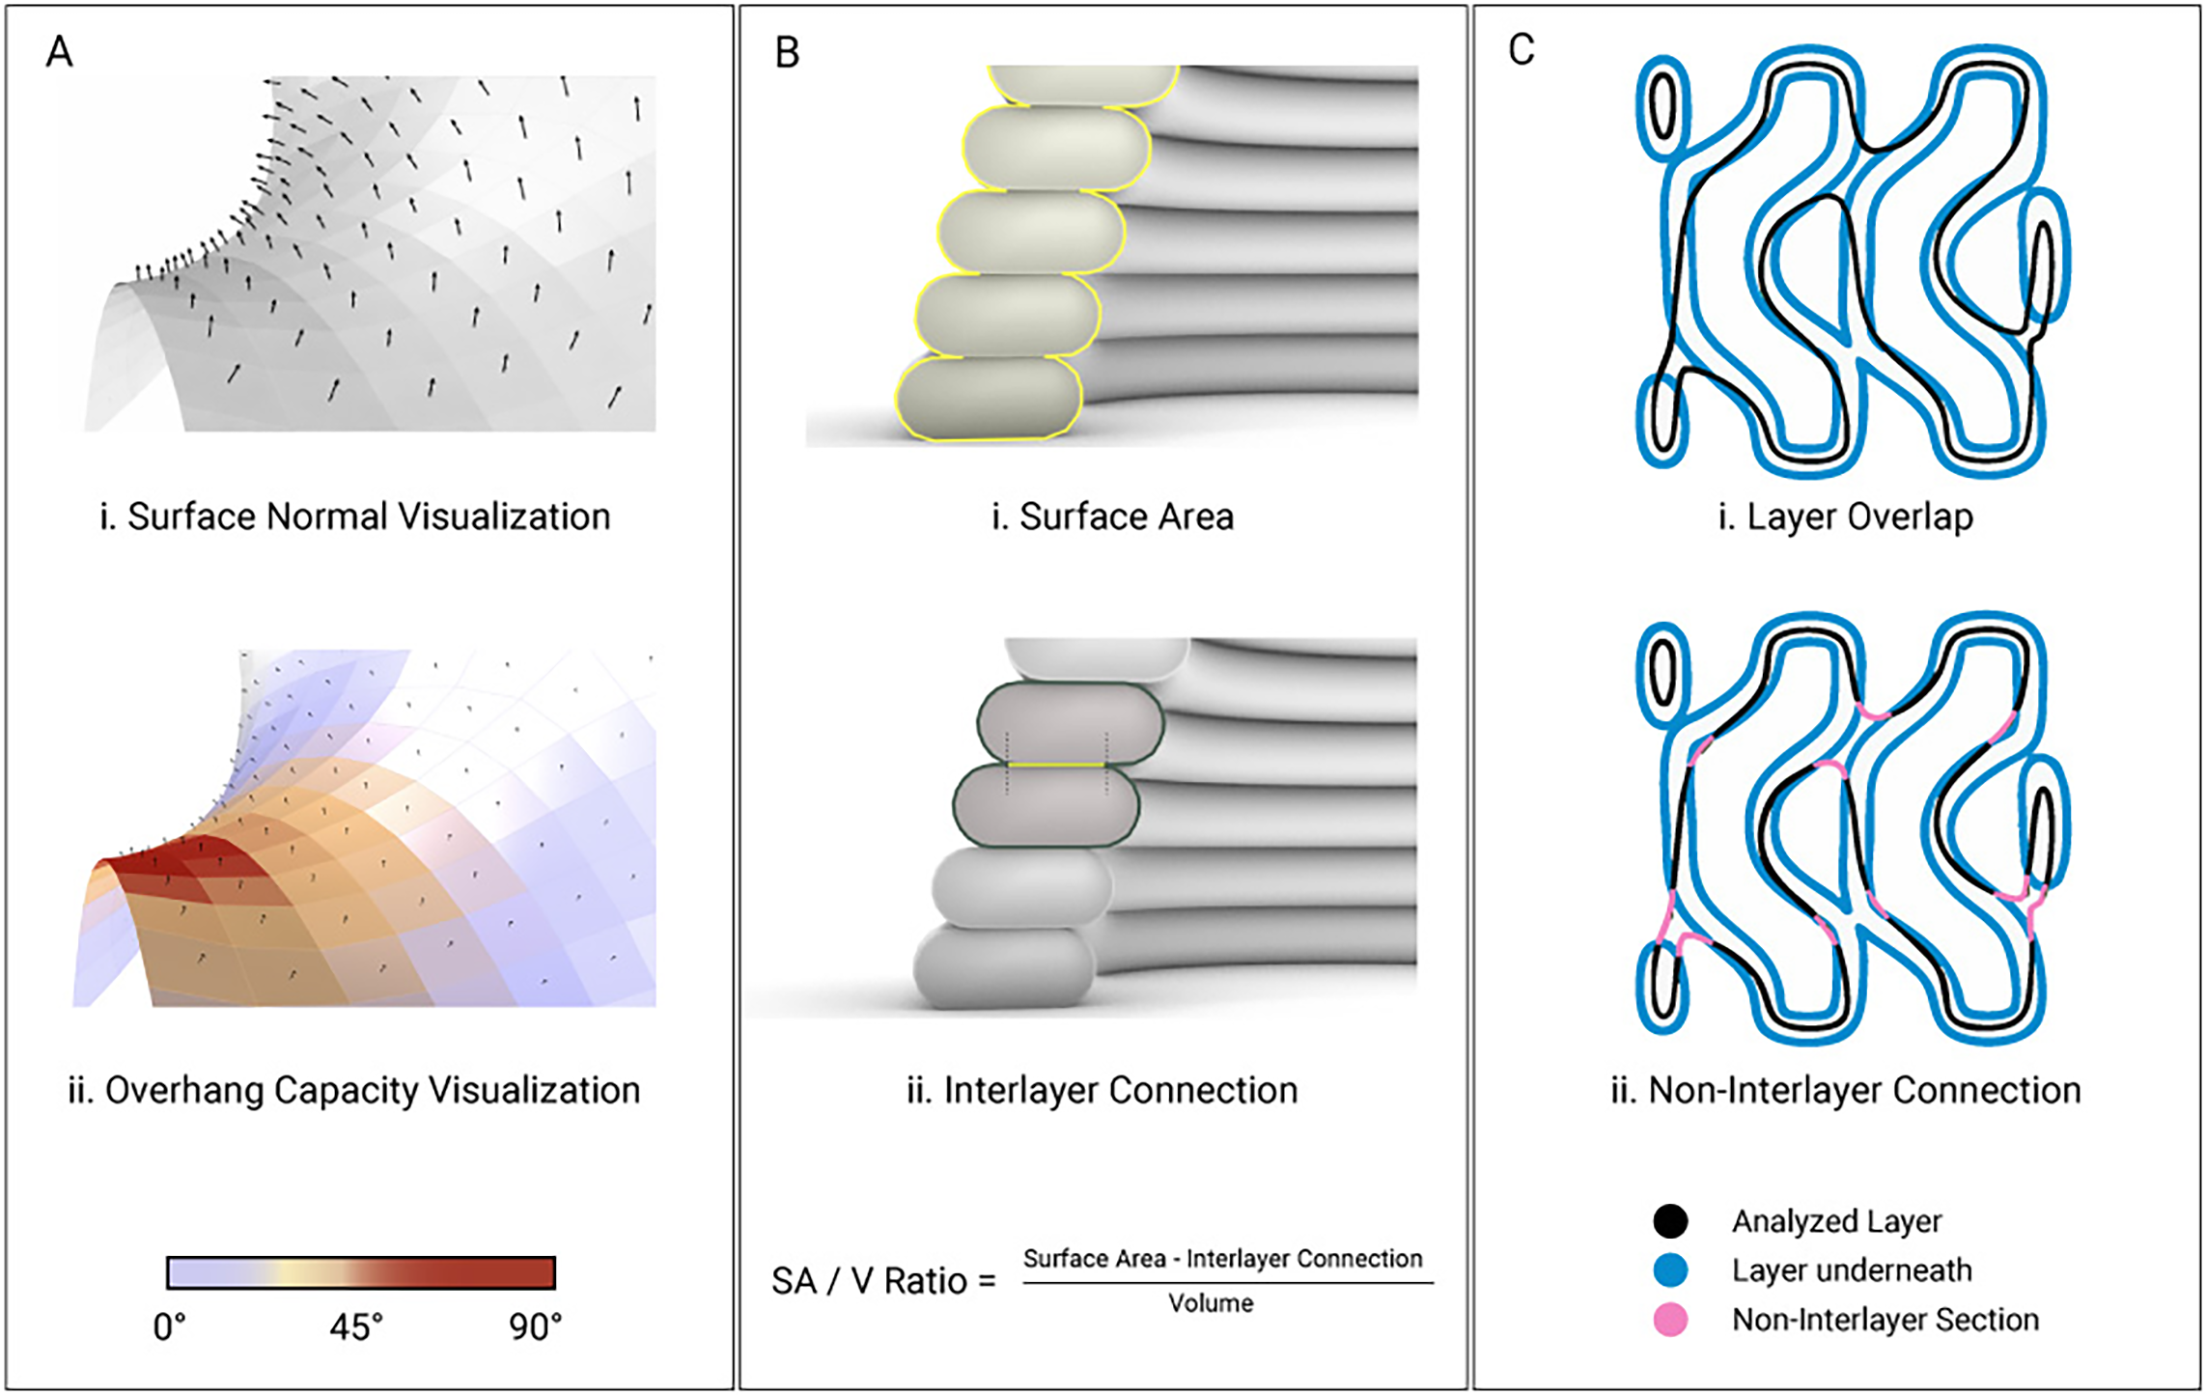
Overhang angles were computed using a custom Rhino and Grasshopper script that analyzes surface normals of a QuadRemeshed geometry. Surfaces exceeding the empirically defined self-supporting threshold were identified to locate critical regions (Figure 3A). In the context of 3DBioP, functional efficiency is defined as the capacity of a geometry to maximize the surface area accessible to biomineralization relative to the volume of deposited material. Biocementation occurs within an approximate penetration depth of 5 mm from the exposed material surface, where the cementation medium diffuses into the printed matrix and reacts with embedded bacteria. The extrusion bead width was therefore selected to remain within this penetration depth so that all deposited material remains potentially mineralizable.
Computational evaluation criteria for geometric optimization of 3DBioP geometries: (A) Overhang capacity visualization derived from surface normals. Warmer colors indicate critical overhang zones, while cooler tones represent self-supporting regions. (B) Surface area-to-volume ratio calculation based on the surface area and interlayer connections. (C) Layer overlap visualization showing the analyzed layer relative to the underlying layer to identify the non-interlayer section.

Geometric efficiency was quantified using the surface area-to-volume (SA/V) ratio, where V corresponds to the volume of extruded material. The metric was evaluated comparatively across geometries with identical extrusion parameters and comparable unit-cell dimensions (∼80 × 80 × 80 mm). The SA/V ratio was calculated from a reconstructed mesh of the simulated toolpath using Mola GH (Figure 3B). Because adjacent deposited filaments generate internal contact regions that are inaccessible to the cementation medium, the effective surface area was computed by subtracting interlayer contact regions from the total filament perimeter. Finally, interlayer connection was quantified by slicing the geometry into print layers and calculating, for each layer, the ratio of unsupported print-path length to total print-path length (Figure 3C). This metric provides an estimate of geometric stability and printability, while the maximum local non-filament overlap ratio identifies regions most susceptible to failure during fabrication.
Biofabrication
Materials
Quartz sand (particle size 0.1–0.6 mm, density 1,370 kg/m3; Carlo Bernasconi S.A.) served as the primary substrate. Calcium chloride (≥93.0%) and yeast extract (Millipore) were sourced from Sigma-Aldrich. All solutions were prepared using Milli-Q ultrapure water. S. pasteurii (DSMZ) was grown from frozen stocks at 30°C and 250 rpm in a medium containing 20 g/L yeast extract, 0.5 M urea and 0.13 M Tris buffer (pH 7.0). Growth was monitored via optical density at 600 nm (OD600); upon reaching OD600 = 1.0, cultures were scaled at a 1:100 inoculation ratio. Late-log phase cells were harvested by centrifugation (4,500 RCF, 15 min), washed with phosphate-buffered saline (PBS) and resuspended in the printing binder.
Bio-ink preparation
The bio-ink composition used in this study is based on the formulation systematically characterized in our prior work (Antorveza Paez et al. Reference Antorveza Paez, Kindler, Terzis, Dutto, Pleij, Zorzetto, Studart and Dillenburger2026), in which six bio-ink formulations were assessed rheologically to identify a printable composition (X08L39) suitable for extrusion-based 3DBioP. In that work, Laponite content was identified as the dominant control over yield stress and slumping resistance, while the alginate–xanthan binder system governs shear-thinning behavior and extrusion stability. The sand-to-binder ratio determines shape retention after deposition. The geometric constraints derived in Sections empirical observations and geometric limitations of TPMS with 3DBioP and Evaluation criteria, including the 45° maximum overhang, the 100 mm minimum continuous path and bead width, therefore reflect the printability envelope of this validated bio-ink rather than independent assumptions.
Robotic fabrication set-up
The 3DBioP system utilized a UR10e collaborative six-axis robotic arm (Universal Robots, Denmark) integrated with a modified StoneFlower ram extruder (StoneFlower 3D, Germany). The extrusion system featured a dual-motor configuration: a primary motor drove the motorized plunger for the ram extruder, while a secondary motor operated the print head auger. To ensure consistent material deposition, the motors were synchronized using the open-source Stoneflower Printer Kit, which allowed the subordinate auger motor to step in precise relation to the main plunger motor. The control system was modified to interface directly with the UR10e’s I/O, enabling automated control of the extrusion process. By embedding specific trigger signals within a JSON-based control file, the robot could automatically initiate and terminate extrusion at designated toolpath coordinates. Extrusion was performed through a 4 mm nozzle (for initial tests, a 3 mm nozzle was also used). All printing was conducted under ambient laboratory conditions (23–24°C). A constant travel speed of 20 mm/s was maintained, resulting in a nominal filament width of approximately 5 mm. The layer height was standardized at 2 mm across all experimental tests to ensure consistency. The plunger’s extrusion flow rate was calibrated to match the robot’s travel velocity, averaging a volumetric flow of ∼232 mm3/s with an extrusion speed of 17.6 mm3/s. This synchronization was critical for maintaining stable printing geometry.
Biomineralization and post-processing
Post-printing specimens were treated with a calcium-rich stabilizing spray to stabilize the print during the initial setting phase. Following a 15-minute stabilization period, the modules were submerged in a cementation medium consisting of 0.5 M CaCl2, 0.5 M urea and 0.13 M Tris buffer. Abiotic control specimens were prepared using the same hydrogel–sand formulation without bacterial inoculation and subjected to the same immersion, rotation and drying protocol as the biotic specimens, ensuring that any observed differences between the two groups could be attributed to microbial activity. To optimize the incubation environment, a custom multi-tier batch-processing system was developed to maximize spatial efficiency while ensuring consistent exposure to the nutrient solution for all samples. To ensure isotropic mineralization, the specimens were rotated daily within the media for 3 days. Upon completion of the mineralization phase, the specimens underwent a controlled dehydration process in an oven at 60°C for 48 hours. Mass was recorded at 24-hour intervals until weight stabilization was achieved. For the demonstrator, the specimens were dried at room temperature.
Results
The following results represent the translation of the computational workflow into physical biomineralized components. The system’s performance is evaluated based on analysis, printability and the effectiveness of the biomineralization process of the final mineralized units.
Comparative evaluation of geometric metrics
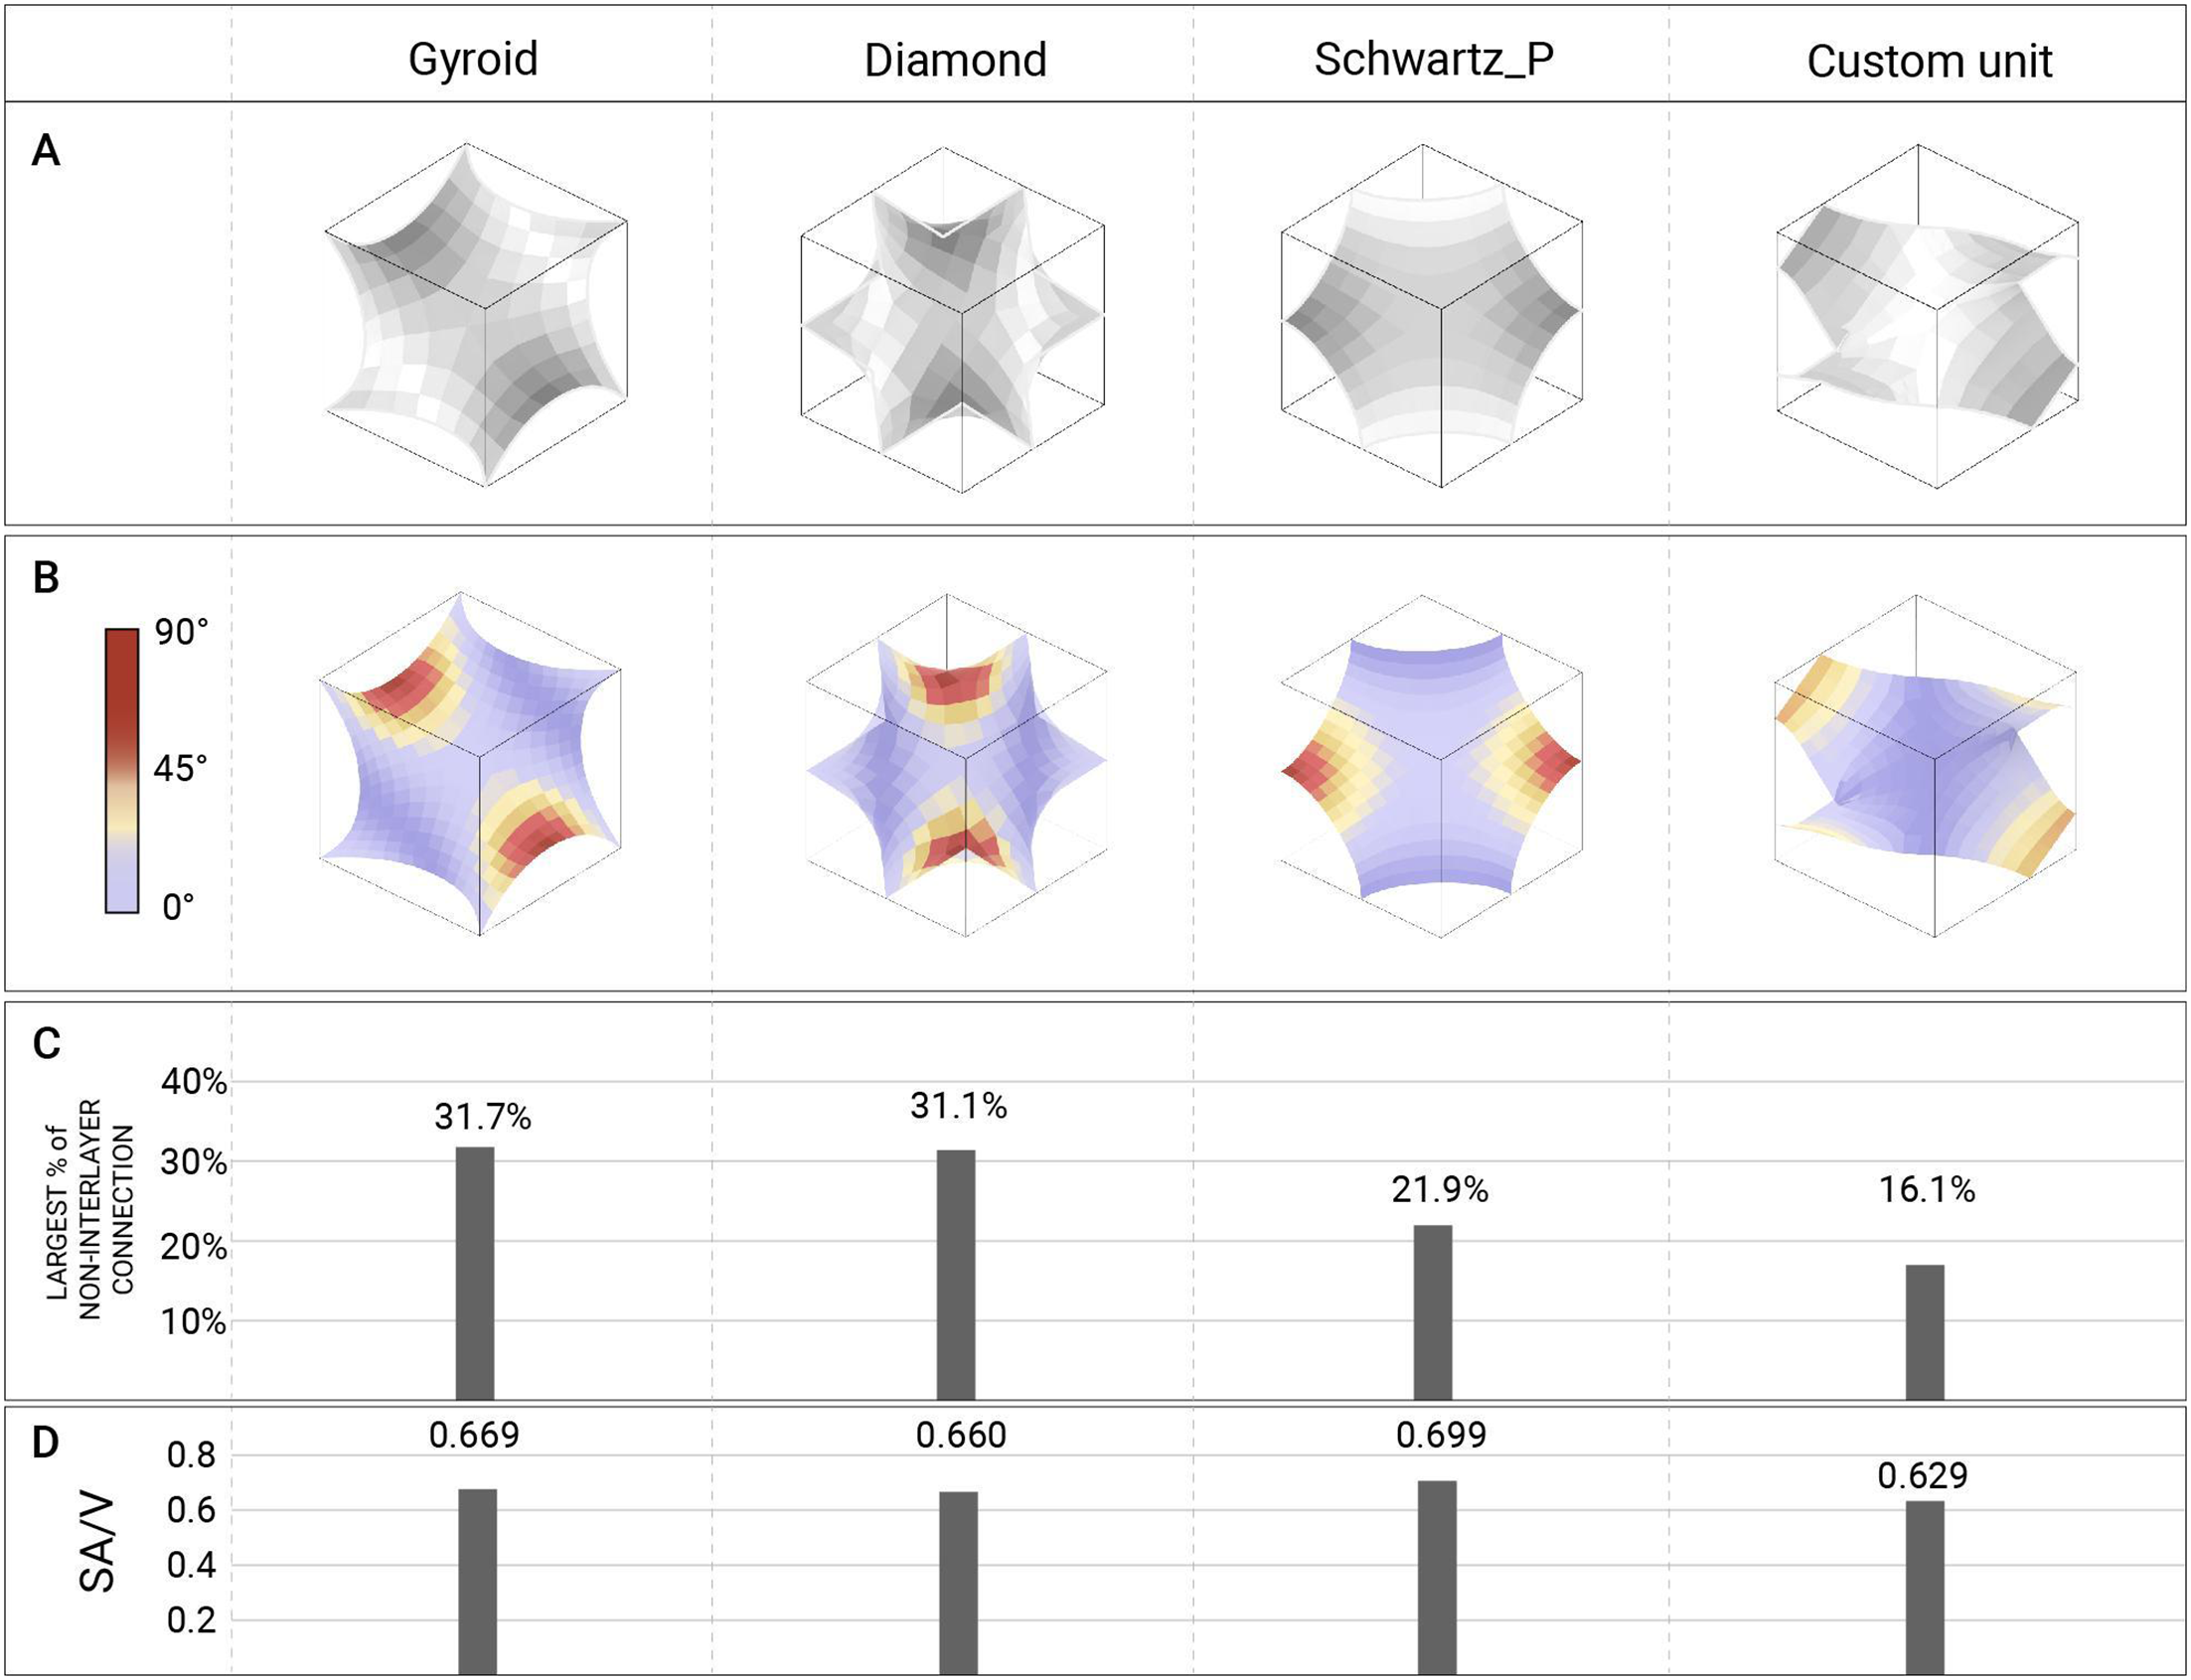
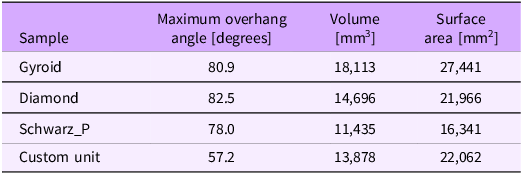
In 3DBioP, standard TPMS are not directly printable, so it is necessary to design new, printable geometries that retain porous characteristics. Therefore, we focused on optimizing the TPMS units to preserve the inherent porosity of minimal surfaces while avoiding excessive overhangs. In this section, we first analyze the printability and surface area-to-volume ratio (SA/V) of three typical TPMS, aiming to identify their printability issues and inform subsequent unit optimization. Figure 4A presents the base units used for the comparison. It is important to note that the patterns used in the initial tests were generated by varying these basic units to varying degrees, deliberately creating more complex geometries to reveal a wider range of printability problems and to derive design constraints. Here, however, we focus on the smallest, repeatable units from the TPMS, which facilitates analysis and ensures that the Custom Unit does not develop extreme overhangs (e.g., 70∼90°) like the standard TPMS (Table 2). The overhang distribution of each unit is visualized in Figure 4B, where critical regions (over 45°) are highlighted in red. The Custom Unit can be further refined to fully satisfy the design constraints identified in the initial tests.
Quantitative comparison of TPMS geometries and a custom unit. (A) Base Units representation: Diamond, Gyroid_Double_Periodic, Gyroid_Periodic, Schwarz_P. (B) Overhang angle analysis visualization. The custom unit represents better self-support than the other units. (C) Largest non-interlayer connection percentage per geometry, indicating the maximum unsupported layer fraction and thus the weakest print layer. (D) SA/V analysis.

Geometrical evaluation
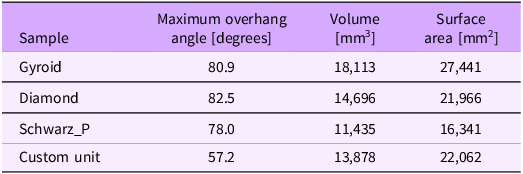
Table 2. Long description
A table comparing geometrical properties of different samples. The table has four rows and three columns. The columns are labeled ‘Sample’, ‘Maximum overhang angle [degrees]’, ‘Volume [mm^3]’, and ‘Surface area [mm^2]’. The rows are labeled with different sample names: Gyroid, Diamond, Schwarz_P, and Custom unit. Each row contains values for the maximum overhang angle, volume, and surface area of the respective sample. Row 1: Gyroid, 80.9, 18,113, 27,441. Row 2: Diamond, 82.5, 14,696, 21,966. Row 3: Schwarz_P, 78.0, 11,435, 16,341. Row 4: Custom unit, 57.2, 13,878, 22,062.
The evaluation of the initial TPMS units revealed a distinct trade-off between structural printability and functional efficiency (Figure 4C and 4D). In other words, as the amount of overhanging surface increases, the exposed interlayer surface area also increases, resulting in a higher SA/V ratio; however, the structure becomes less stable during printing (e.g., Gyroid and Diamond). On the contrary, when the overhang is reduced and non-interlayer connections decrease, buildability improves, but the SA/V ratio declines accordingly (e.g., Schwarz_P). A common issue among these standard TPMS is the presence of horizontally oriented overhanging surfaces. Theoretically, these surfaces correspond to 90° overhangs; after mesh discretization, the angles are slightly softened to 80–90°. Fundamentally, such overhanging surfaces cannot be resolved through scaling or repetition alone, as they are intrinsic to the mathematical surface definition. As a result, geometries derived from these standard TPMS exhibited significant printability issues in the initial tests.
Based on these observations, we prioritized resolving printability issues and increased the proportion of overhanging surfaces only after a printable unit was achieved, thereby balancing printability and efficiency. Therefore, at this stage, we proposed a Custom Unit primarily focused on printability. Instead of introducing overhanging surfaces, this unit employs boundary conditions approximated from 45° polylines, reducing both the overall overhanging area and the number of non-interlayer connections. Compared to the TPMS Diamond, which exhibited the most significant overhang problems, the proposed design reduces the maximum overhang angle by 30.6% (from 82.5° to 57.2°, Table 2 and Figure 4B) and the largest non-interlayer connection by 48.2%. Admittedly, the SA/V ratio is also slightly reduced by 4.7% relative to Diamond, but this remains a considerable improvement, particularly given the overhanging surfaces, which contribute to surface area, have been removed.
Additionally, the multi-directional pore network of TPMS was kept in this design. In subsequent experiments, the printability of this Custom Unit will be evaluated. If successful, it will be considered the benchmark for further optimization aimed at enhancing surface area while maintaining printability.
Biocementation of the custom module
Following geometric optimization, bio-fabrication tests were conducted to assess the biomineralization process of the custom module under both abiotic and biotic conditions. These tests validated the integrated design-to-fabrication workflow; the design geometry was generated through a series of mirror-copy and reflection operations applied to the Custom Unit, enabling the creation of intricate internal channels. These operations also ensured the toolpath remained uninterrupted, maintaining a steady extrusion rate and consistent material deposition despite the component’s geometric complexity.
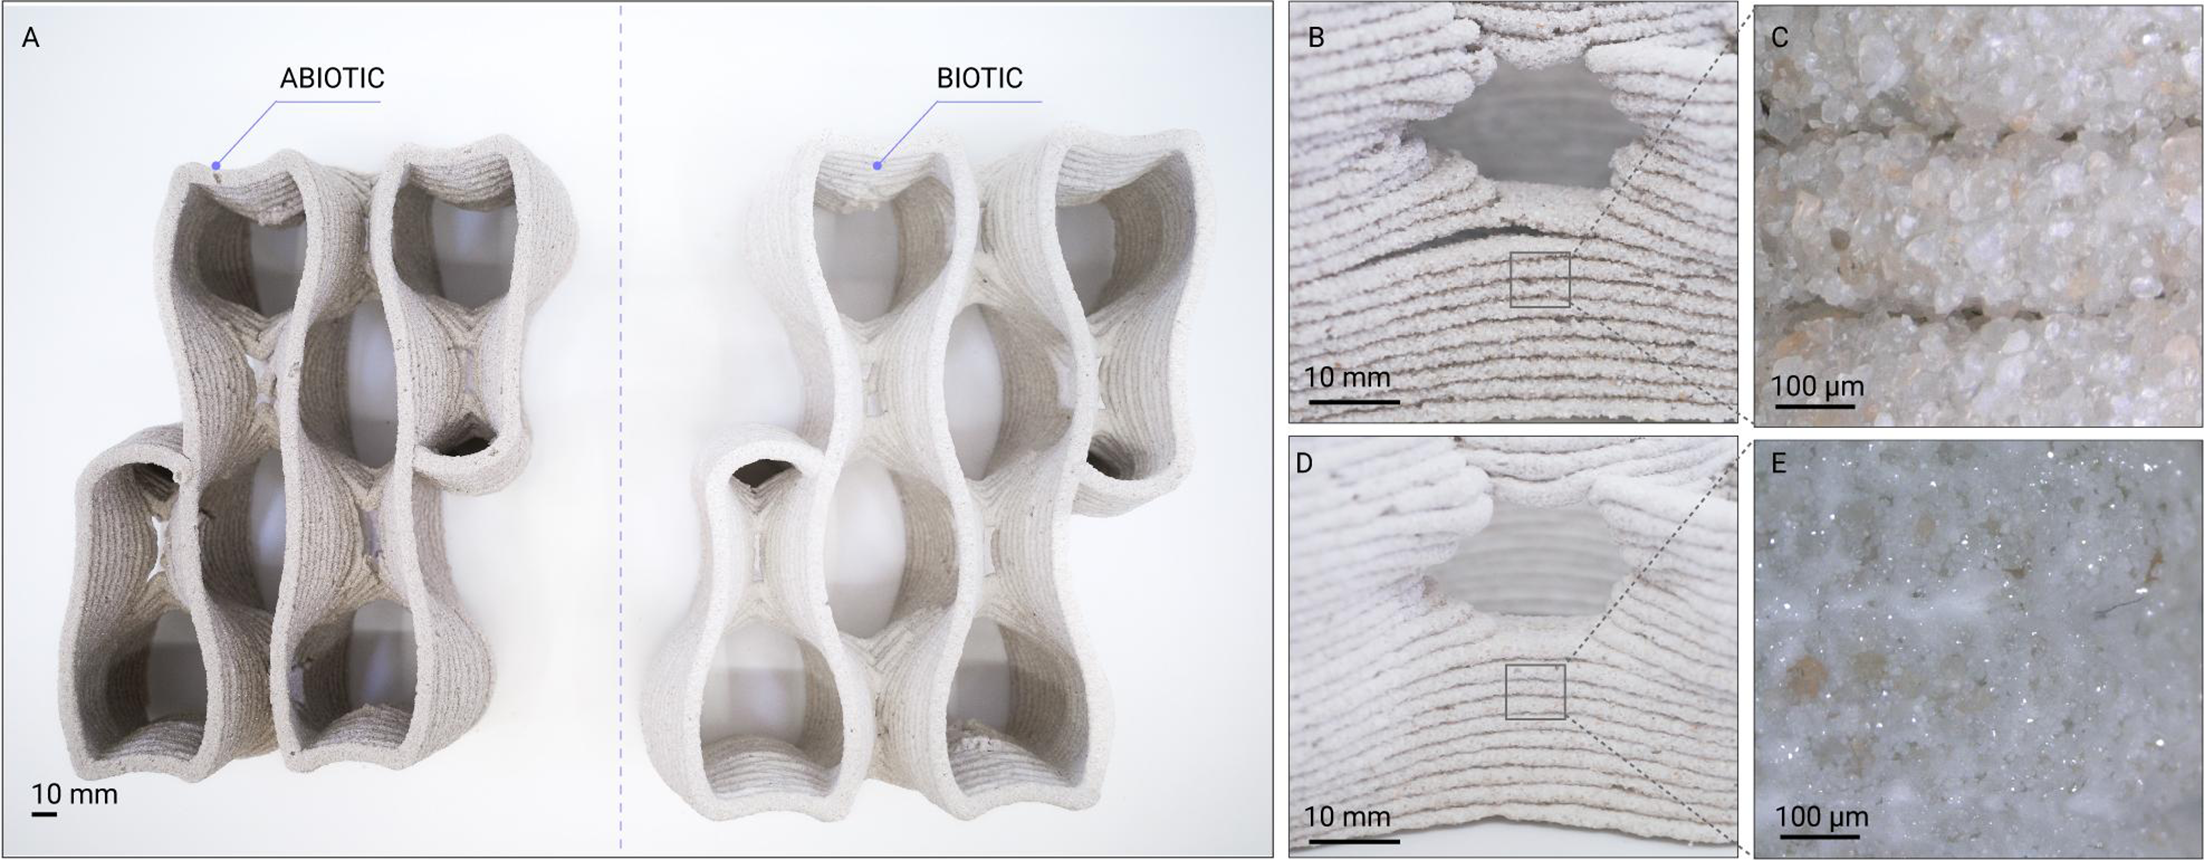
In the biotic samples, the interconnected pore network enabled homogeneous diffusion of cementation agents throughout the geometry, as evidenced by the uniform color change observed across the prototype. Macro-lens imaging further confirmed biomineralization within the structure (Figure 5E), revealing mineralized deposits between adjacent sand grains. Both abiotic and biotic samples underwent identical fabrication, cementation and drying conditions, differing only in the inclusion of bacterial activity. The effects of MICP were most evident during the drying phase. While the abiotic control samples exhibited significant layer separation upon dehydration (Figure 5B and 5C), a phenomenon typical of hydrogel-based binders due to their high water content and subsequent volumetric shrinkage (Martin and Youssef Reference Martin and Youssef2018), the biotic samples remained cohesive, maintaining their printed geometry (Figure 5D and 5E). These observations are consistent with previous studies suggesting that biomineralized crystals can improve cohesion between sand grains and across interlayer regions. Compared to the abiotic controls, the biotic samples exhibited reduced delamination and improved geometric preservation during drying, indicating enhanced stability of the printed structure. While no quantitative mechanical characterization was performed in this study, the observations suggest that MICP contributed to maintaining the integrity of the components during post-processing.
Comparative analysis of abiotic and biotic 3DBioP modules across macro- and micro-scales. (A) Fabricated porous modules after drying left, abiotic control (hydrogel–sand matrix without bacteria); right, biotic specimen. Scale bar: 10 mm. (B) Close-up of abiotic sample showing layered filament deposition and visible layer separation. Scale bar: 10 mm. (C) Micro-scale detail of the abiotic interlayer interface, highlighting loosely packed sand grains and limited mineral bridging. Scale bar: 100 µm. (D) Close-up of biotic sample after biomineralization, demonstrating improved interlayer cohesion and reduced visible delamination. Scale bar: 10 mm. (E) Micro-scale view of the biotic specimen showing calcium carbonate precipitation in white bridging adjacent sand particles and partially filling intergranular voids. Scale bar: 100 µm.

Architectural scaling and demonstrator
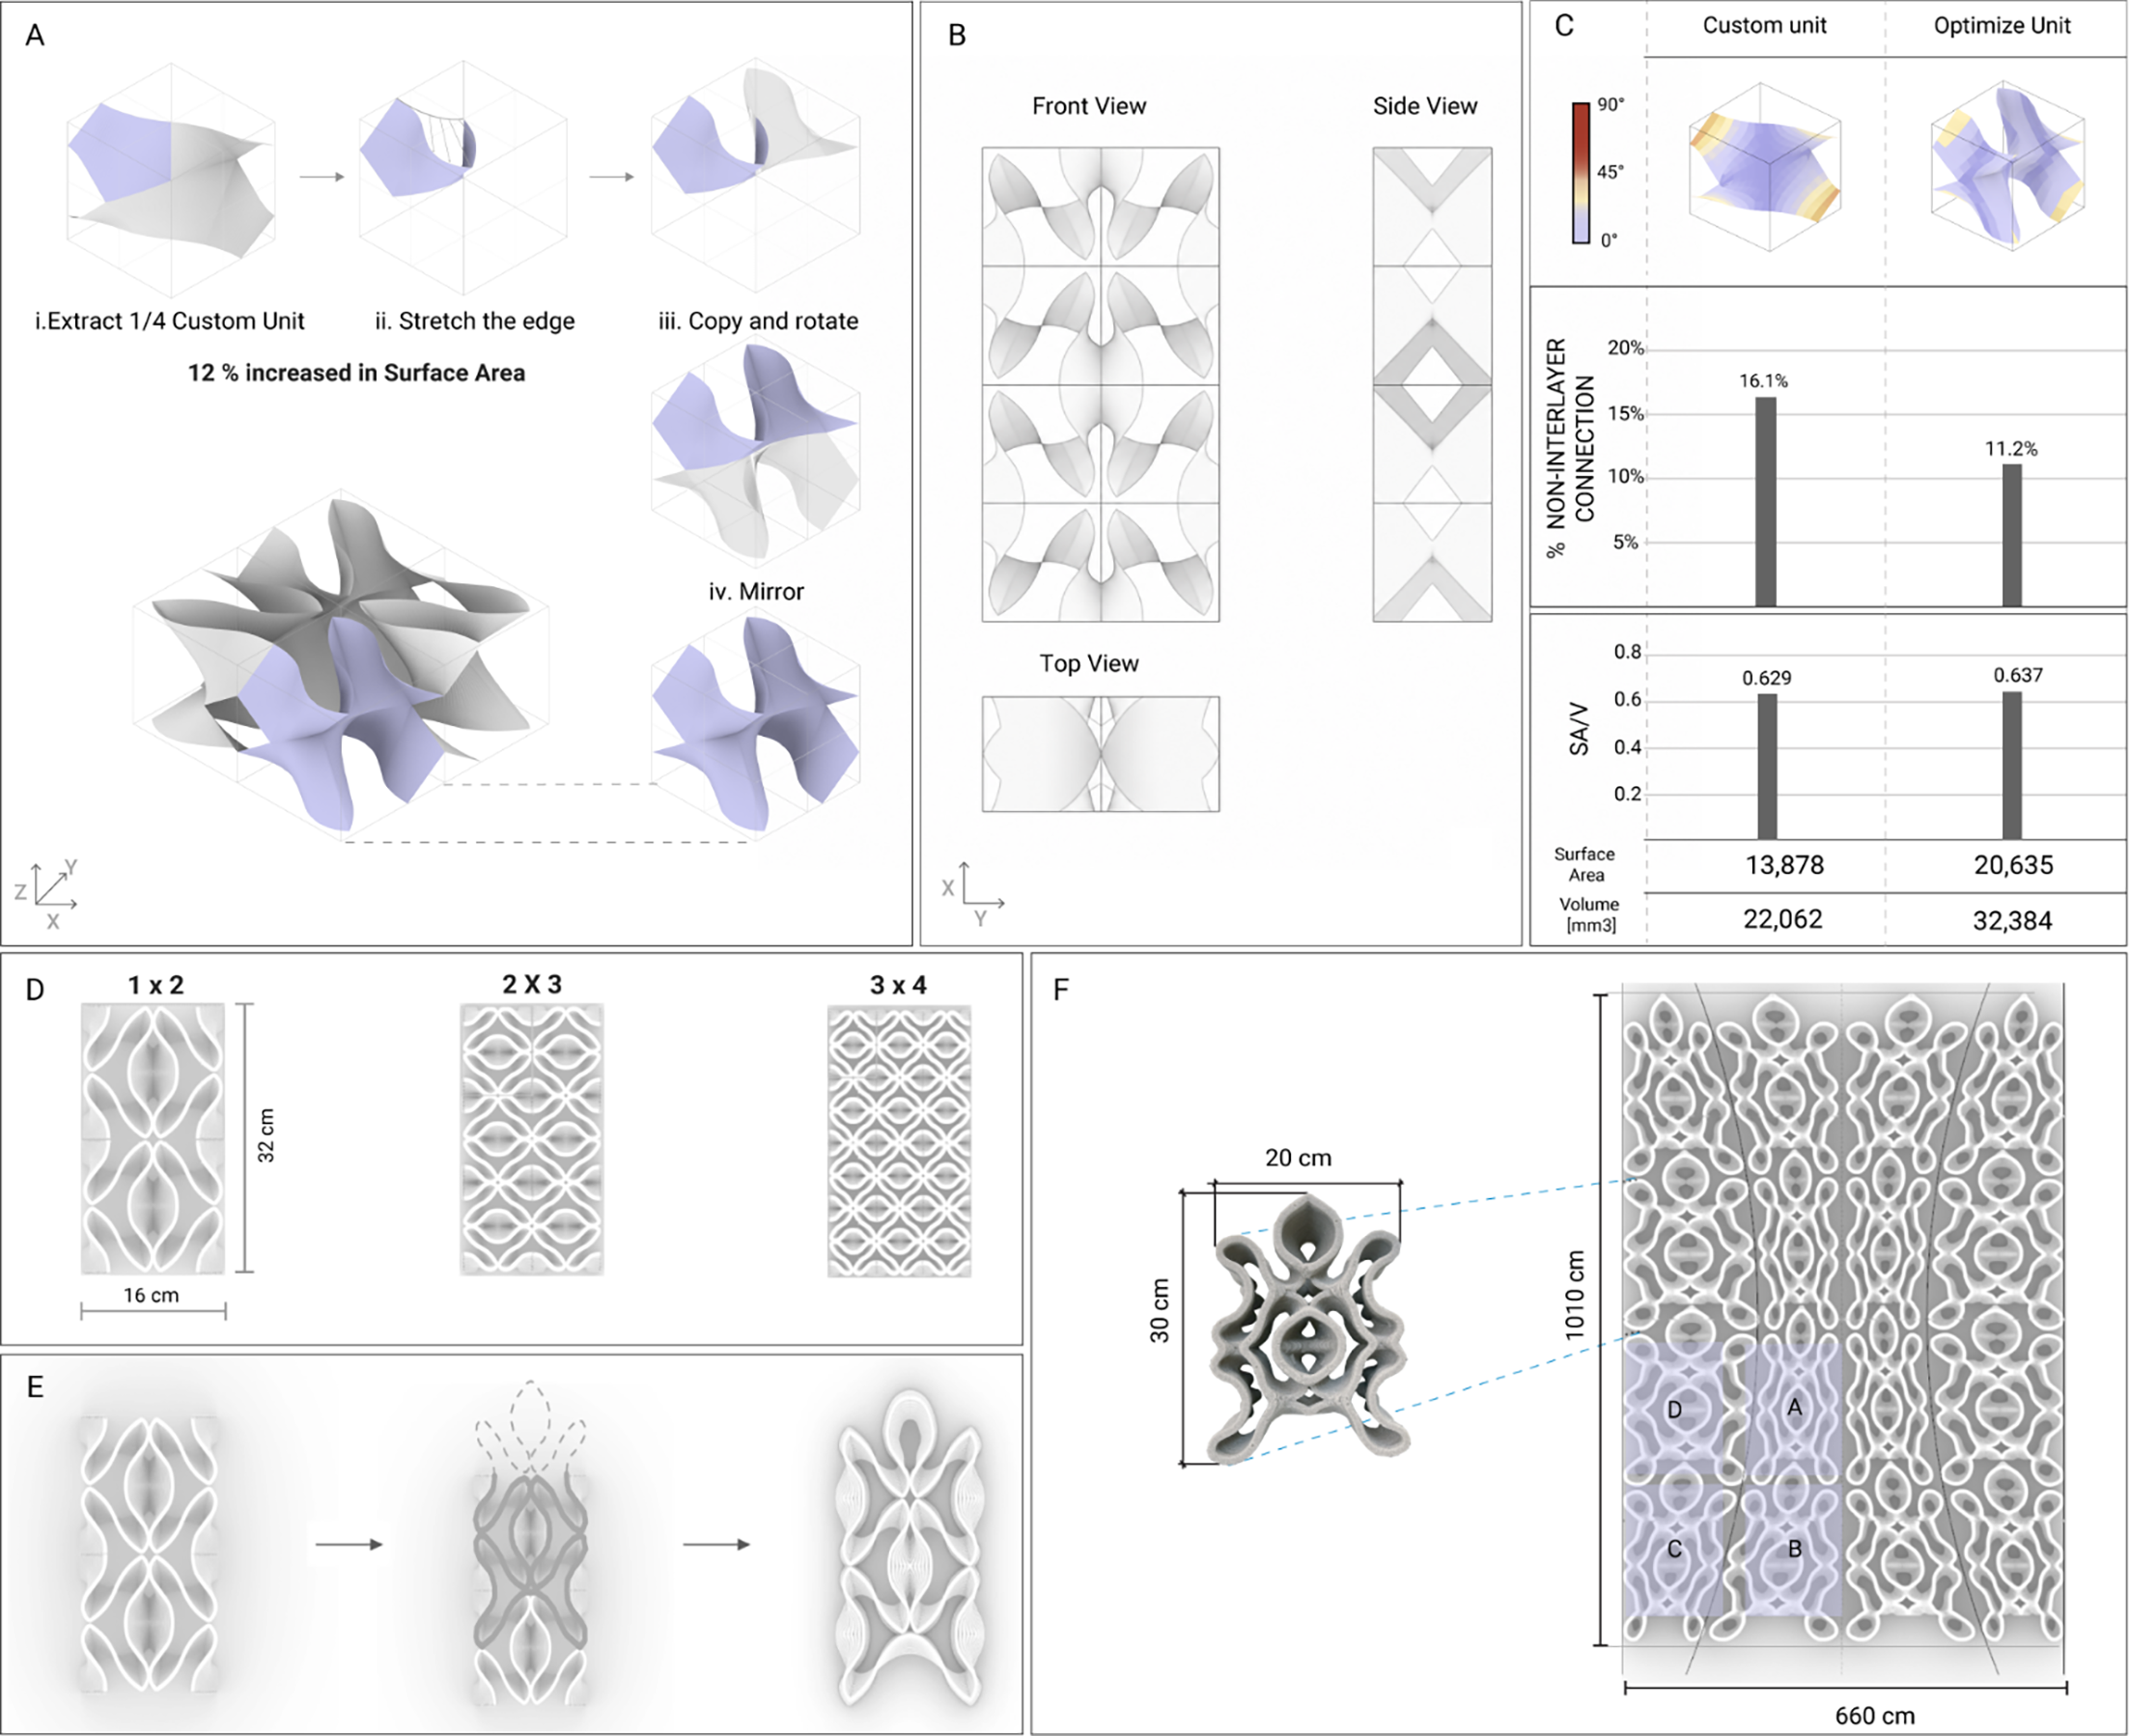
The architectural demonstrator consolidates the geometric optimization framework into a modular system. The final design phase focused on reconciling the three competing criteria: first, maximizing the SA/V ratio; second, maintaining interlayer connectivity to ensure printing stability; and third, controlling overhang angles within the self-supporting limits of the sand-hydrogel matrix. By strategically approaching the material’s maximum self-supporting overhang capacity, the base unit was subdivided into four segments and individually modified to increase “wrinkling” to amplify the surface area, thereby increasing surface articulation and exposed area (Figure 6A). The Custom Unit was subsequently translated into a modular architectural system through mirroring and replication (Figure 6A and 6B). This strategy ensured geometric continuity across module boundaries.
Geometric optimization and modular scaling. (A) Geometric development of the base unit, showing surface optimization and area increase, followed by aggregation into a multi-unit configuration. (B) Plan and sectional views of the aggregated module system. (C) Quantitative comparison between the Custom Unit and the Optimized Unit, including overhang-angle distribution, percentage of non-interlayer connection, surface area, volume and surface-area-to-volume (SA/V) ratio. (D) Modular scaling of the unit in different array configurations (1 × 2, 2 × 3, 3 × 4), illustrating increasing density. (E) Connectivity refinement strategy, highlighting the transition from the initial geometry to an optimized fabrication module with a continuous and closed edge. (F) Fabricated module prototype (approx. 30 cm height × 20 cm width) and its integration into the 1 m2 partition demonstrator.

This modular strategy ensured that overhang angles remained within the self-supporting thresholds of the sand-hydrogel matrix while maximizing the area available for microbial activity. Quantitative evaluation confirmed that the optimized geometry improved both fabrication stability and biological accessibility. While maintaining a comparable maximum overhang angle (56.0°) to the Custom Unit (57.2°), the Optimized Unit reduced the maximum percentage of non-interlayer connections from 16.1% to 11.2% and increased the SA/V ratio from 0.629 to 0.637 (Figure 6C). These improvements were achieved despite a substantial increase in absolute surface area (13,878 mm2 to 20,635 mm2) and volume (22,062 mm3 to 32,384 mm3).
To translate the optimized geometry into a fabricable architectural component, the open boundary conditions of the TPMS-derived geometry were closed to ensure continuous toolpath generation and stable extrusion behavior (Figure 6E). While the minimal-surface logic performs efficiently as a continuous spatial field, its perimeter remains topologically discontinuous for robotic fabrication. The connectivity refinement therefore established a closed-edge condition compatible with uninterrupted extrusion. The optimized unit was further developed into a modular system with varying density configurations, defined through adjustments in toolpath spacing (Figure 6D). This strategy enabled spatial differentiation while maintaining identical material composition and fabrication parameters across all modules.
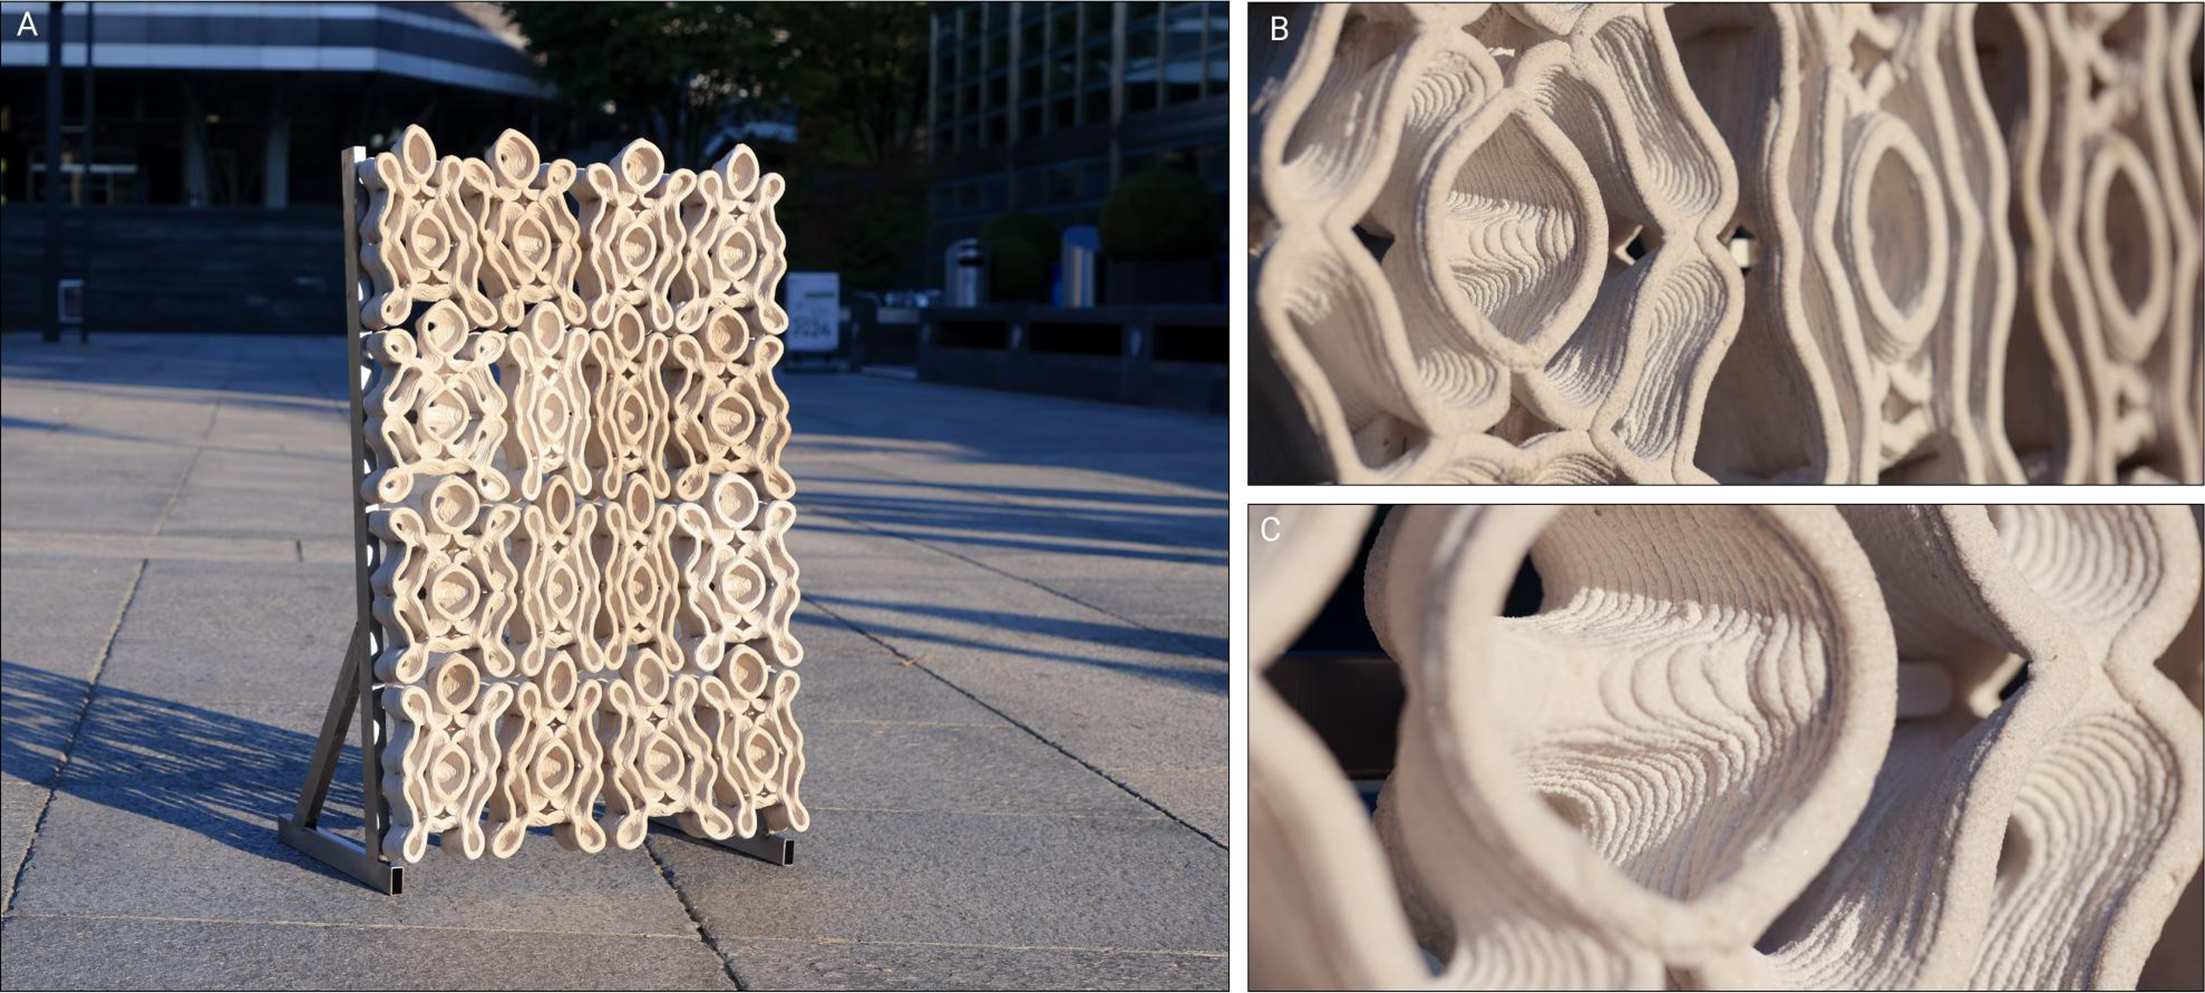
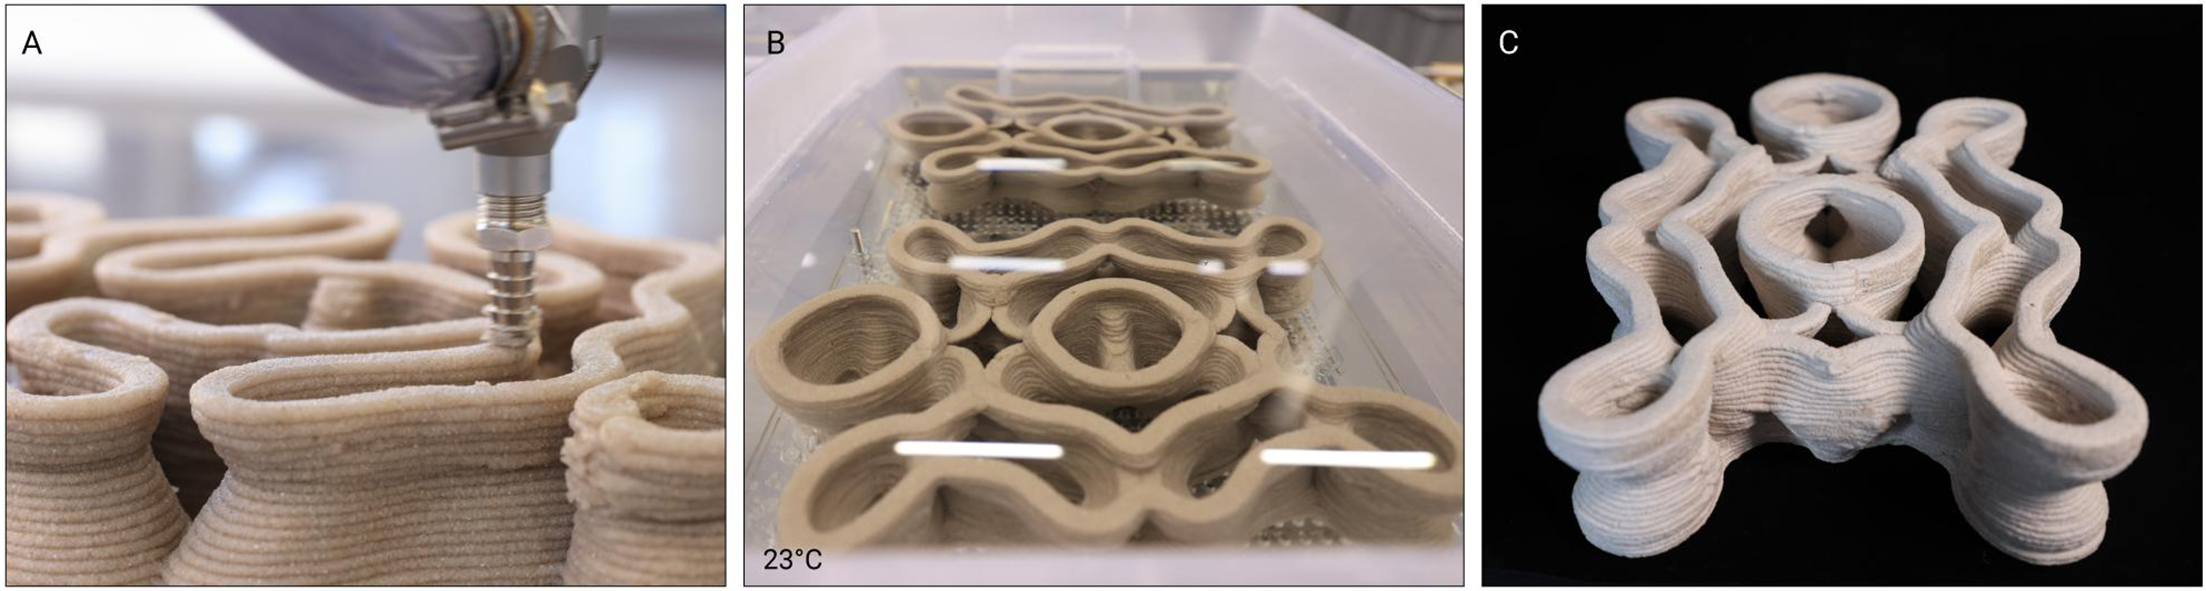
The transition from modular experiments to a 1 m2 architectural prototype (Figure 7A–C) provided a critical validation step for the proposed workflow. This stage demonstrates the scalability of 3DBioP and tracks the material’s physical transformation across the full fabrication sequence, from robotic deposition to biomineralization and drying. The robotic fabrication process for the full demonstrator required 7.6 hours and processed 14.5 kg of sand, 9.9 kg of bacteria-laden hydrogel binder and 32 liters of liquid bacterial culture. Fabrication metrics for the different module categories are summarized in Table 3. Despite variations in geometry and toolpath density, all modules were fabricated using identical extrusion parameters described in Table 1. The fabrication workflow consisted of three sequential stages: robotic extrusion, biomineralization through immersion and controlled drying (Figure 8). During robotic fabrication (Figure 8A), the bio-ink was deposited through continuous toolpaths to minimize extrusion interruptions and maintain stable filament deposition. Immediately after printing, the modules were stabilized using a calcium-rich spray to reduce early-stage deformation prior to immersion in the cementation medium (Figure 8B). Following biomineralization, the specimens were dried at ambient temperature to complete the mineral consolidation process (Figure 8C). After completion of the biomineralization and drying phases, the modules were mechanically fixed into a custom steel frame.
Demonstrator fabrication data

Table 3. Long description
A table comparing fabrication metrics for different module categories. The table has five columns and five rows, including a header row. The columns are labeled Module ID, Mean printing time [min], Mean total length [m], Mean volume [L], Mean mass [g], and Dimensions (W x L x H) [cm]. The rows provide data for Type A, Type B, Type C, and Type D modules. Row 1: Module ID, Type A; Mean printing time, 26.0; Mean total length, 46.19; Mean volume, 0.46; Mean mass, 1050.00; Dimensions, 12.5 x 28.8 x 6.5. Row 2: Module ID, Type B; Mean printing time, 28.5; Mean total length, 51.36; Mean volume, 0.52; Mean mass, 1228.7; Dimensions, 20.7 x 27 x 6.5. Row 3: Module ID, Type C; Mean printing time, 29; Mean total length, 52.26; Mean volume, 0.53; Mean mass, 1274.35; Dimensions, 20.7 x 27.5 x 6.5. Row 4: Module ID, Type D; Mean printing time, 31.0; Mean total length, 56.43; Mean volume, 0.57; Mean mass, 1430; Dimensions, 20.5 x 30.2 x 6.5.
Architectural demonstrator. (A) Full-scale demonstrators, (B and C) Printing details of the discrete components.

Biofabrication sequence. (A) 3DBioP. (B) Incubation in cementation solution. (C) Dry specimen at ambient temperature.

Discussion
The results demonstrate that geometric articulation can simultaneously influence extrusion stability and biomineralization accessibility. By integrating computational design, extrusion-based 3D printing and MICP, the workflow contributes to digital architectural biofabrication. A primary contribution of this work is the development of custom TPMS-based geometries that reconcile high morphological complexity with the rheological constraints of 3DBioP extrusion. Quantitative evaluation demonstrates that geometric efficiency was achieved while improving fabrication stability: the Optimized Unit reduced non-interlayer connection from 16.1% to 11.2% while increasing the SA/V ratio from 0.629 to 0.637, despite a substantial increase in absolute surface area and volume.
The geometric optimization strategy proposed in this study, including the design of overhangs and continuous deposition paths, is driven by two fundamental conflicts between MICP requirements and extrusion-based buildability. First, unlike conventional material extrusion systems, where overhangs are primarily minimized to maintain geometric stability, the present workflow treats overhang geometries as a functional design parameter because they increase the exposed surface area available for biomineralization. Second, although porous geometries inherently introduce fragmented print paths and frequent start–stop operations, porosity remains essential in this study due to its role in nutrient diffusion and mineral accessibility. These coupled conflicts between overhang and printability, and between porosity and deposition continuity, informed the customized design strategy developed in this work, which seeks to: (i) maximize overhanging regions within the limits of printability and (ii) maintain continuous deposition paths while preserving pore interconnectivity.
The 1 m2 partition wall serves as the proof-of-concept demonstrator, demonstrating reproducible fabrication across sixteen modules with differentiated density categories while maintaining extrusion stability and homogeneous mineralization behavior. It is important to note that the primary contribution of this study lies in establishing and validating the integrated workflow at the building-scale. Mechanical performance, long-term durability and environmental impact metrics were not quantitatively evaluated in this study and remain subjects for future investigation. The workflow demonstrated geometric flexibility through its modular logic and bottom-up approach. By defining and optimizing fundamental “base units,” we developed a framework that enables these units to be parametrically modified and aggregated to meet specific design requirements. Furthermore, the versatility of this workflow could extend beyond the sand-hydrogel matrix used here. The workflow could apply to various paste-extrusion materials, such as ceramics or alternative biomaterials with similar rheological properties.
The proposed workflow was established through an iterative process in which geometric design and 3D-printing experiments continuously inform each other. The process begins with mathematical geometric models that meet the fabrication requirements for biocement and are continuously refined in response to printability constraints, biological processes and architectural design considerations. Therefore, the results of this study are derived from experimental observations and represent a design-driven outcome rather than a fully computationally optimized or mechanically benchmarked material system. Future work may focus on introducing minimal modifications to standard TPMS to preserve their mathematical features while ensuring printability. Alternatively, multi-objective optimization strategies could be explored that incorporate structural performance, functional requirements (such as ventilation and shading) and constructability.
However, several challenges emerge when considering further scale-up. At the material level, the compressive capacity and diffusion-dependent biomineralization depth currently constrain wall thickness; this may be addressed in future iterations through hybrid structural systems, material formulation optimization or the incorporation of reinforcing fibers to improve stiffness. Immersion-based incubation also remains a bottleneck for component size; alternative strategies such as spray-based cementation, perfusion systems or internally activated calcium sources could enable larger assemblies and reduce logistical constraints. Finally, while the porous shading system addresses climate mitigation via potential natural ventilation and evaporative cooling, systematic mechanical testing and environmental exposure studies remain necessary to validate the long-term durability of these biomineralized components. Such quantitative characterization falls beyond the scope of the present workflow-focused investigation and constitutes a critical next phase toward structurally functional architectural applications. Ultimately, establishing geometric–biological compatibility at the architectural scale provides the foundation for subsequent performance-driven optimization and broader structural integration of ELMs in architecture. By enabling mineral formation under ambient conditions via biologically mediated processes, this approach contributes to emerging strategies to reduce the energy intensity of mineral-based construction materials.
Conclusion
This research establishes a design-to-biofabrication framework in which geometry functions as an active interface between microbial mineralization and robotic extrusion. By embedding biological constraints directly into computational design logic, porosity, surface-area-to-volume ratio, interlayer connection and fabrication limits are treated as coupled parameters. By transforming standard TPMS geometries into fabrication units, minimal surface principles are systematically applied to satisfy rheological, interlayer and diffusion constraints while preserving geometric complexity. The 1 m2 partition wall demonstrates the potential of 3DBioP for bio-fabricated mineral systems for architectural applications. The study shows that geometric complexity can be increased while simultaneously improving fabrication stability, validating the co-optimization of biological and manufacturing criteria. While currently limited to non-load-bearing applications, the methodology provides a framework for future scale-up studies for structural evaluation, alternative cementation strategies and larger-format fabrication. Because mineral formation occurs through microbial metabolism under ambient conditions rather than high-temperature processing, the framework aligns with emerging strategies to reduce the energy intensity and embodied carbon of mineral construction materials; however, comprehensive environmental assessment remains necessary. This work advances a reproducible pathway for architecturally scaled engineered living mineral systems.
Data availability statement
The authors confirm that the data supporting the findings of this study are available within the article and its supplementary materials.
Author contributions
K.A.P.: Conceptualization, Methodology, Investigation, Data Analysis, Visualization, Writing – original draft and Writing – review & editing. S.H.: Methodology, Data Analysis, Writing – original draft and Writing – review & editing. K.H.Y.: Investigation, Data Analysis, Visualization. Writing – original draft. K.S.: Investigation, Visualization. B.D.: Supervision and Funding Acquisition.
Financial support
This work was supported by ALIVE initiative (Advanced Engineering with Living Materials), SFA-AM program (Strategic Focus Area – Advanced Manufacturing), National Key Research and Development Program of China (grant number 2023YFC3806901) and China Scholarship Council (grant number 202306210283).
Competing interests
None.
Ethical standards
Ethical Standards: This research did not involve human or animal subjects and therefore did not require ethical approval.



 Open access

