Introduction
Myxosporeans (Cnidaria: Myxozoa) are obligate endoparasites of many aquatic vertebrates and annelids (Okamura et al. Reference Okamura, Gruhl and Bartholomew2015). Infectious parasite sporoplasms are transmitted between hosts via multi-cellular spore stages: actinospores released from an annelid worm infect the alternate vertebrate host (typically a fish), where they proliferate and develop into myxospores, which then infect annelids to complete the life cycle. In a typical natural environment, hosts can encounter spores from multiple myxozoan species (e.g. Eszterbauer, Reference Eszterbauer2004; Heiniger and Adlard, Reference Heiniger and Adlard2014) or multiple strains or genotypes of the same species (e.g. Atkinson and Bartholomew, Reference Atkinson and Bartholomew2010a). Thus typical tissue samples yield DNA that represents an aggregate population of myxozoan parasites, rather than the genetic signature of an individual parasite. This can lead to incorrect assignment of DNA sequences to an observed phenotype, particularly if cryptic infections are present (e.g. Sphaerospora and Myxidium; Bartošová et al. Reference Bartošová, Fiala, Jirku, Cinková, Caffara, Fioravanti, Atkinson, Bartholomew and Holzer2013), or could lead to incorrect genetic typing (present study).
Ceratonova shasta (Atkinson et al. Reference Atkinson, Foott and Bartholomew2014) infects multiple salmonid fishes of the genus Oncorhynchus in the Pacific Northwest of North America (Hendrickson et al. Reference Hendrickson, Carleton and Manzer1989; Bartholomew, Reference Bartholomew1998). Previously, we described four primary parasite genetic types (genotypes), based on sequence repeats in the Internal Transcribed Spacer region 1 (ITS-1) in the multi-copy nuclear ribosomal DNA array. We observed that C. shasta genotypes typically sporulate only in specific hosts: genotype O in steelhead and redband trout (anadromous and endemic freshwater Oncorhynchus mykiss Walbaum, 1792, respectively), genotype I in Chinook salmon (Oncorhynchus tschawytscha Walbaum, 1792), and genotype II most commonly in coho salmon (Oncorhynchus kisutch Walbaum, 1792) and non-endemic rainbow trout (Atkinson and Bartholomew, Reference Atkinson and Bartholomew2010b; Hurst and Bartholomew, Reference Hurst and Bartholomew2012; Hurst et al. Reference Hurst, Wong, Hallett, Ray and Bartholomew2014). Unlike genotypes O and I, genotypes II and III have been observed in multiple salmonid species and often as mixed infections (Atkinson and Bartholomew, Reference Atkinson and Bartholomew2010b; Stinson and Bartholomew, Reference Stinson and Bartholomew2012). The presence of genotype II in coho salmon in the Klamath River (California/Oregon) is significant as this fish species is federally listed as endangered, and thus the health of coho populations receive special management consideration (BiOp, 2013). We are currently investigating structural and genomic features of genotype II to understand both the infection process and to develop specific molecular assays to distinguish genotypes that may specifically disease coho salmon. In 2015, infected fish used for seeding our laboratory annelid host cultures showed a persistent mixture of C. shasta genotypes II and III. As this material was being used for genomic and transcriptomic studies where the genotype had to be well characterized, we sought to better understand the aggregate parasite population within the fish host.
Actinospores and myxospores of C. shasta are multi-cellular, with eight and six cells, respectively, and each diploid cell has hundreds of copies of the ribosomal DNA (Hallett and Bartholomew, Reference Hallett and Bartholomew2006; Atkinson, unpublished results). The ribosomal DNA is particularly useful in myxozoans because the small-subunit is used to discriminate among species, whereas the more variable ITS-1 distinguishes among parasite populations (Okamura et al. Reference Okamura, Gruhl and Bartholomew2015). Heretofore, our working hypothesis has been that all ITS-1 copies within a spore are homologous, and thus individual C. shasta spores are only a single genotype. We interpreted the mixed genotype results from fish tissue to represent infections from multiple actinospores of different genotypes, which develop into an aggregate population of different genotype myxospores within the fish host; no genetic crossing occurs between parasite stages in the vertebrate host (Feist et al. Reference Feist, Morris, Alama-Bermejo, Holzer, Okamura, Gruhl and Bartholomew2015). We sought to test this hypothesis by studying sequence variation within individual spores through Sanger sequencing of DNA from individual myxospores, from a rainbow trout with a mixed genotype II/III infection, to confirm that each myxospore comprised a single genotype (either II or III). Simultaneously, we tested the alternate hypothesis that genotype II and III represent intra-parasite genetic differences in ITS copies and thus individual spores may have a range of proportions of these variants, and therefore genotyping the parasite using the ITS locus is not meaningful in the case of genotypes II and III.
Materials and methods
Source and purification of C. shasta myxospores
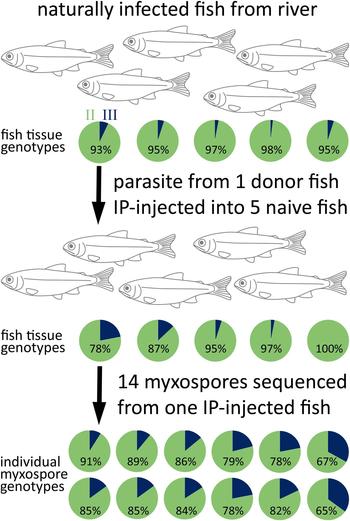
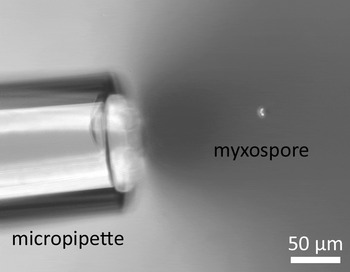
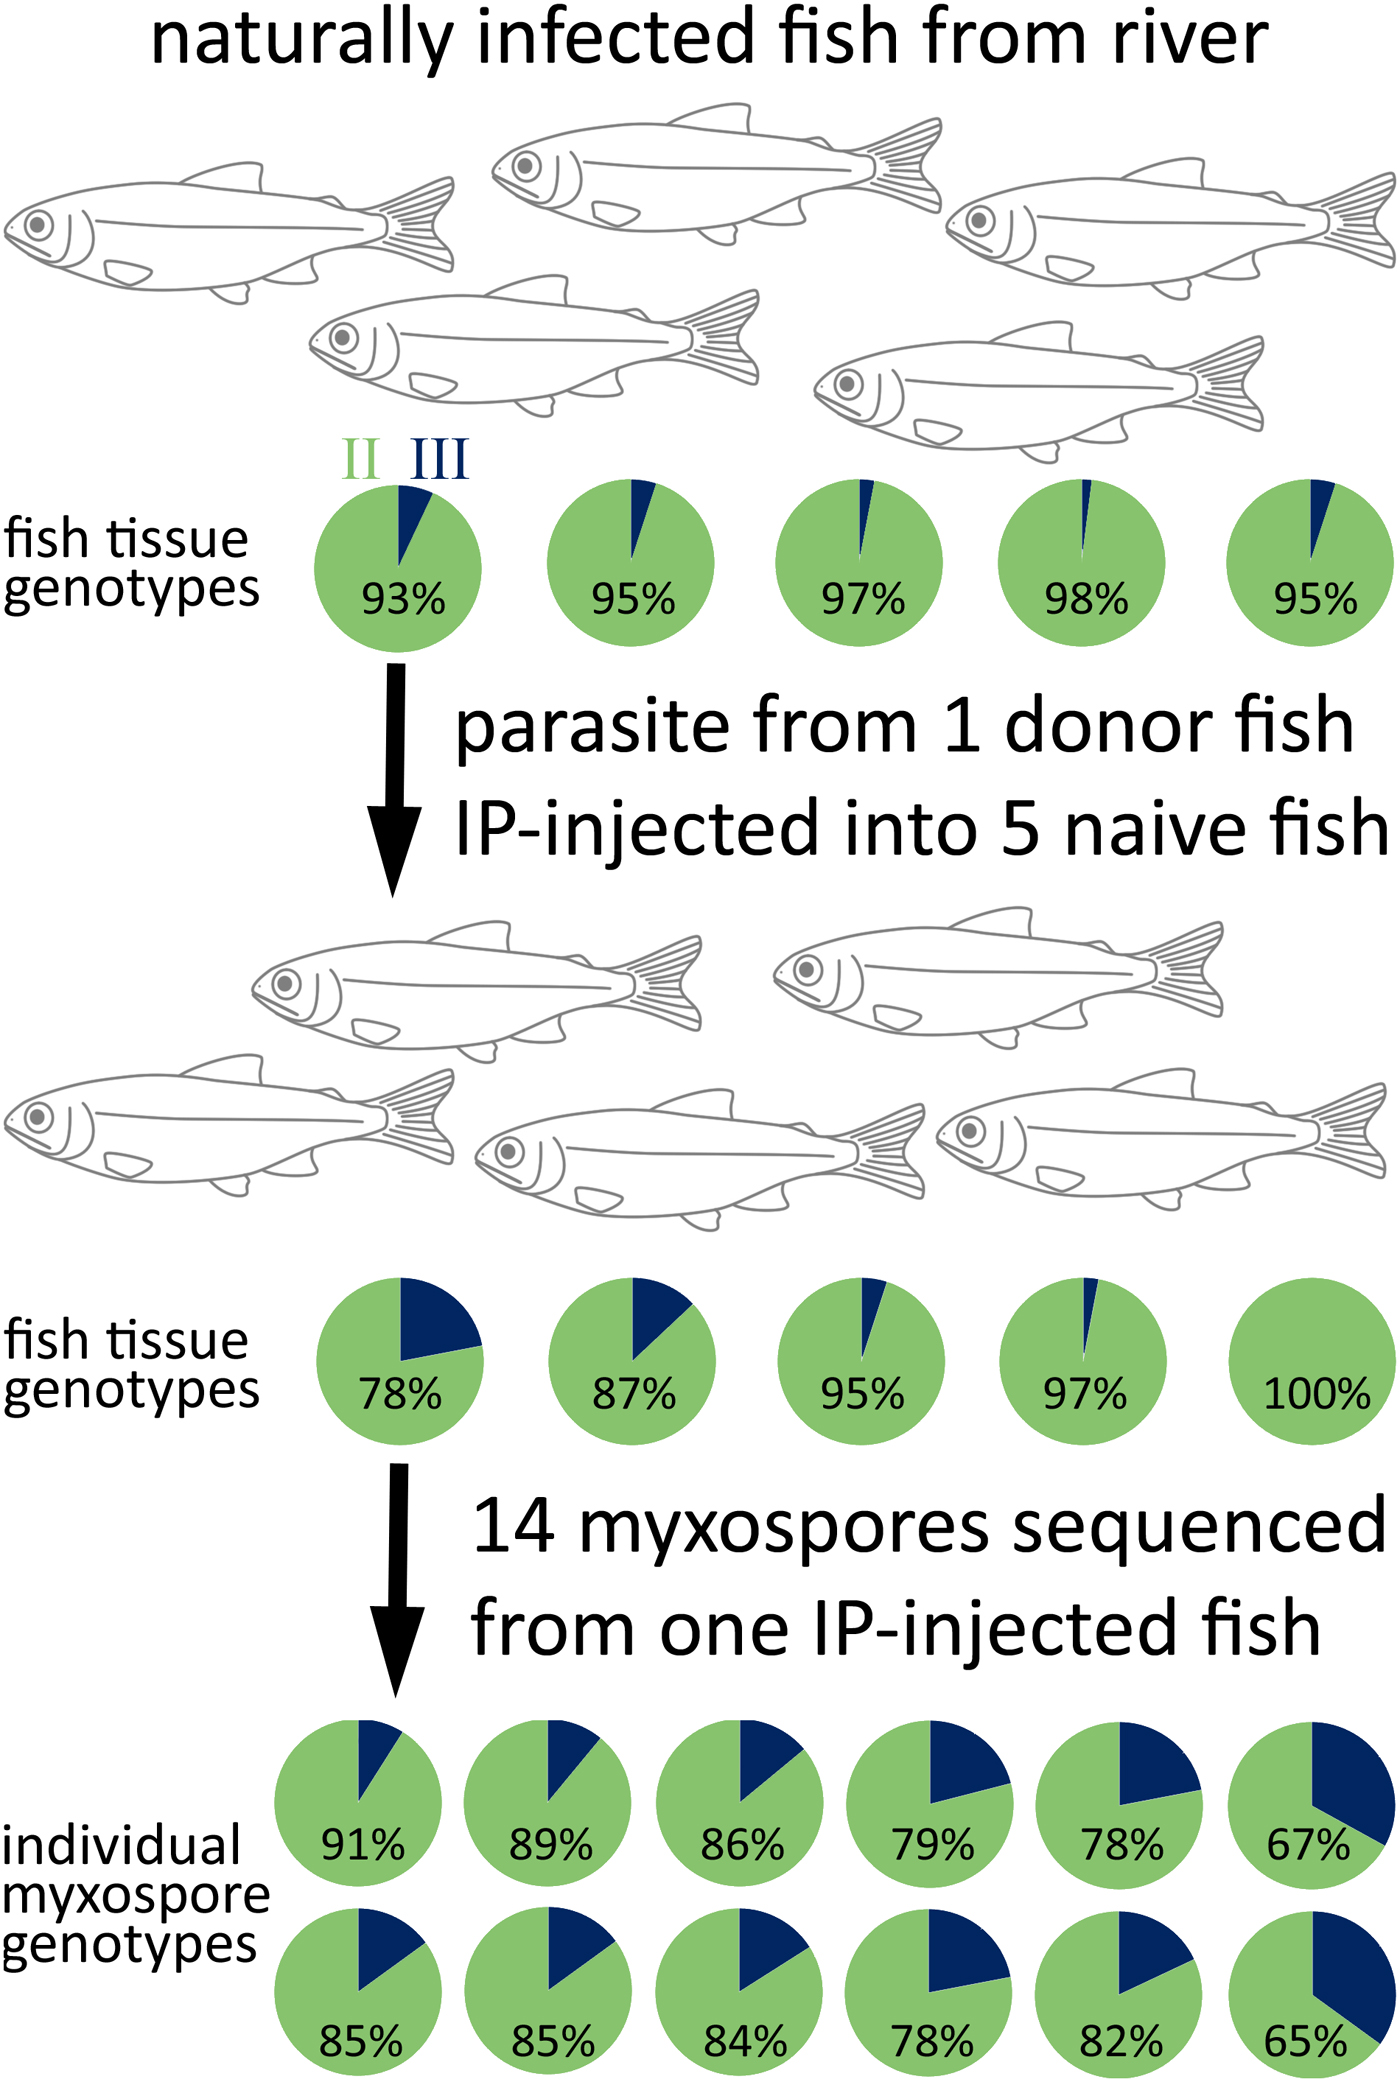
A schematic workflow of the methods is shown in Fig. 1. We used a C. shasta-susceptible strain of rainbow trout (Roaring River stock O. mykiss, Oregon Department of Fish and Wildlife) in all procedures. Forty juveniles were held in cages in the Klamath River, California, as part of long-term fish health monitoring in that system. Following a 72 h exposure in September 2015, fish were relocated to recirculating tanks at Oregon State University's John L. Fryer Aquatic Animal Health Laboratory (in compliance with IACUC approved ACUP #4666; we involved the minimum number of animals to produce statistically reproducible results, and these animals were part of a larger approved study to monitor the parasite in the river). Fish were held at 18 °C until they developed overt disease signs (swollen vent, bloating, poor swimming, inappetence), typically after 20–30 days. We euthanized five diseased fish by overdose with MS222, then prepared wet-mounts of intestinal scrape or ascites (fluid associated with infection in the body cavity). We confirmed the presence of C. shasta myxospores using a compound microscope, then collected ~200 mg of tissue for DNA amplification and sequencing. From one infected fish, 100 µL of ascites was diluted 1:10 in phosphate buffered saline (PBS), and 100 µL of this injected intraperitoneally (IP) into each of 5 naïve rainbow trout. These were held at 14 °C in a flow-through tank until the onset of clinical disease signs (20–30 days) then euthanized, necropsied and the posterior half of the intestine removed, subsampled for DNA, and the remainder held on ice. We harvested myxospores from one fish: ~10 mm of intestine opened lengthwise and the inner surface scraped with a cover glass, which was rinsed into a 2-mL centrifuge tube with a small volume of PBS. Examination with a microscope confirmed the presence of high numbers of C. shasta myxospores, developmental stages, host blood and epithelial cells. The scrapings were diluted with distilled water to ~2 mL, washed through a 70 µm cell sieve, then centrifuged at 1000×g for 1 min to pellet spores, the supernatant discarded, and the pellet rinsed once with distilled water. We re-suspended spores in 1 mL distilled water and layered them over 1 mL 25% Percoll (GE Healthcare). The tube was centrifuged again to pellet relatively pure myxospores, which sank beneath the Percoll layer. Residual host cells and disrupted tissues remained in either the aqueous layer or in the Percoll and were removed. The spore pellet was re-suspended in distilled water and centrifuged to remove Percoll; this step was repeated twice. Microscopic examination revealed that the resultant pellet was almost entirely C. shasta myxospores, which are refractile, bean-shaped, ~10 µm long, and easy to distinguish even at low (×100) magnification under phase contrast (Fig. 2).
Flow chart showing the method for Ceratonova shasta passage from naturally infected fish, via intra-peritoneal injection to naive fish. Pie charts show the genotype mixtures determined by Sanger sequencing of fish tissues and individual myxospores. Genotype II = light shade, genotype III = dark.
Phase contrast micrograph showing the tip of glass micropipette and a single Ceratonova shasta myxospore.

Isolation of individual myxospores
We diluted the purified myxospores in distilled water, placed ~500 µL on a glass slide, and spread the liquid to form a broad, shallow dome. The sample was examined uncovered, using a 10× objective under phase contrast illumination with a working distance of ~10 mm, which was sufficient to prevent contact with the liquid and allow sufficient access to pipette spores. If necessary, the myxospores were diluted further until the density of spores was less than one per field.
We fabricated a micropipette by heating and drawing the thin end of a standard glass Pasteur pipette into a fine capillary, which was then broken off ~50 mm from the thick part of the pipette shaft. The micropipette functioned by capillary action alone – when the tip was placed in water, the tube filled rapidly. To aspirate individual myxospores, we pre-loaded the pipette almost fully with distilled water to reduce the capillary effect. The microscope was adjusted so that only a single myxospore was visible to one side of the field (Fig. 2). The tip of the pre-loaded micropipette was moved into the field of view above the droplet, then dipped into the liquid. The residual capillary action was sufficient to draw the myxospore into the tube within a few seconds, but not so strong as to pull spores or other debris from out-of-field. Approximately half the aspirated liquid was expelled by mouth into the base of a 0.2 mL tube. The residual liquid in the pipette was expelled onto absorbent paper, the pipette loaded again with distilled water, which was expelled to rinse it, before preloading the pipette with water for the next myxospore. We pipetted myxospores (N = 40) individually into 5 × 8-tube strips, which were left uncapped and placed in a tissue-covered rack at 4 °C overnight to evaporate excess liquid.
Single spore and fish tissue digestion
We trialed three methods for extracting DNA from individual spores in tubes. Method 1: no pre-treatment, polymerase chain reaction (PCR) master mix was added directly to 8 tubes that contained myxospores, and the PCR program run as normal. Method 2: 5 µL Qiagen buffer AE was added to rehydrate 8 tubes of spores, which were then incubated at 85 °C for 15 min in a thermocycler (Eppendorf) before PCR master mix was added and cycled normally. Method 3: spores (3 strips of 8 tubes) were digested in-tube using a method modified from Zhai et al. (Reference Zhai, Zhou and Gui2012): A digestion master mix comprising 0.05 µg mL−1 proteinase K (Qiagen), ~1.2X Titanium Taq buffer (Takara Clontech) and water to a total volume of 16.3 µL was added to each tube, and incubated in a thermocycler at 56 °C for 30 min, then 95 °C for 10 min, before PCR master mix was added and the reaction cycled (see below).
Fish intestine samples were digested using a modified ‘boiled-crude’ method of Palenzuela et al. (Reference Palenzuela, Tronbridge and Bartholomew1999): incubation at 56 °C for 1–2 h with 180 µL buffer ATL (Qiagen) and 20 µL proteinase K to digest tissue, followed by heat denaturation at 95 °C for 15 min, then dilution 1:100 prior to amplification in PCR, under the same chemistry and cycling conditions listed below. Negative extraction controls were prepared for both fish and single spores using the same ATL, distilled water and proteinase K.
PCR and sequencing
Final PCR master mix concentrations were as follows; depending on the method used, the volume of water was adjusted to account for liquid used in the initial spore incubation/digestion so that the final PCR volume was 20 µL, including 0.1U Titanium Taq and 1X buffer (Takara Clontech), 0.25 µ m Bovine serum albumin, 0.5X Rediload loading dye (Invitrogen) and 0.4 µ m each of novel primers (see Discussion): Cs1479F (GCATCACCTGCTCTGAGAAGAGTGG) and Cs2067R (GGTCTTCATCGATGTTTTTGCCGAGG). PCR was performed on a PTC-200 (MJ Research) thermocycler with the following conditions: denaturation at 95 °C for 1 min, 5 cycles of 30 s @ 95 °C, 90 s @ 68 °C (combined anneal/extension step), then 30 cycles of 30 s @ 94 °C, 60 s @ 68 °C, before a terminal extension of 7 min at 68 °C. Bands were visualized by electrophoresis on a 2% TAE gel stained with SYBR Safe (Thermo Fisher Scientific). PCR amplicons from 14 of the individual spores that amplified strongly from Method 3 were purified using a DNeasy Blood and Tissue kit (Qiagen) and sequenced directly using forward primer Cs1479F at OSU's Center for Genome Research and Biocomputing. The parasite was sequenced also from 10 fish samples (5 fish infected in the river, and 5 fish that had been IP injected). Sequence chromatograms were inspected in BioEdit (Hall, Reference Hall1999), and parasite genotype determined based on the number of ATC repeats at position ~460, with genotype proportion estimated from the relative contribution of each coincident peak to the total peak heights at polymorphic loci (Atkinson and Bartholomew, Reference Atkinson and Bartholomew2010a).
Results
Single spore extraction and PCR
Single myxospores contained sufficient DNA for PCR but success depended on the extraction method (Fig. 3). Method 1 (direct addition of PCR master mix to dried spores) resulted in only weak amplification from 1 of 8 tubes. Method 2 (rehydration and incubation) showed inconsistent amplification across 7 of 8 tubes. Method 3 (digestion before PCR) gave the best results with strong amplification in 22/24 tubes. Fish tissues amplified well, whereas PCR and extraction controls showed no amplification (not shown).
Composite image of gel electrophoresis results from amplification of individual Ceratonova shasta myxospores (one per lane) amplified after different pre-treatments, from left: molecular size marker; Direct addition of PCR mastermix without pre-treatment; Spores re-hydrated prior to PCR; Spores digested with proteinase K prior to PCR. Blank lanes indicate no PCR amplification due to either no spore in original reaction or non-optimal digestion. PCR, polymerase chain reaction.

Genotype results
Parasite in fish gut tissue and ascites gave genotype ratios shown in Fig. 1: The ‘donor’ wild-infected rainbow trout was 93% genotype II, 7% type III. Infections that developed in fish that had been IP injected from the donor fish genotyped as 78–100% II, 0–22% III. The single fish from which the individual myxospores were purified genotyped as 78% II, 22% III. All 14 individual myxospores genotyped as a mixture of II and III, with 65–91% II.
Discussion
Ceratonova shasta ITS-1 genotypes correlate with specific salmonid fish species and are detectable in environmental water samples. As we use both fish and water samples as parasite monitoring tools (Hallett et al., Reference Hallett, Ray, Hurst, Holt, Buckles, Atkinson and Bartholomew2012), it is critically important that assignment of samples to particular genotypes is consistent and based on reliable molecular characters. In our studies of C. shasta infection dynamics in the Klamath River (California/Oregon), particularly in host populations of endangered coho salmon and in allopatric rainbow trout used as sentinel fish, genotype II has always been dominant, with genotype III detected only rarely (unpublished data). We have observed higher levels of type III compared with II in river basins further north (Stinson and Bartholomew, Reference Stinson and Bartholomew2012), where both susceptible sentinel and wild-caught fish in the Deschutes River had pure or dominant genotype III infections. Recently, we observed more common mixed II/III infections in sentinel rainbow trout both in the lower Klamath River, and in the Willamette River, proximal to OSU's Aquatic Animal Health Laboratory; we have not observed mixes of genotypes O and I, although these genotypes typically occur in different fish species than II and III. The detection of higher levels of genotype III in Klamath River sentinel fish required clarification as both the rainbow trout and endangered coho salmon become diseased from the same genotypes, with rainbow trout often used as a disease proxy for coho. We do not yet know if the spatial and temporal differences in II/III ratios are representative of evolutionary processes in the parasite populations, possibly driven by shifts in fish host abundance due to both annual variation in wild fish cohort size, and human-mediated stocking and relocation. The biological significance, i.e. increased disease risk to endangered coho salmon from this C. shasta genotype II/III mix compared with the historically pure genotype II, is unknown.
As C. shasta has hundreds of ribosomal DNA copies in the nuclear genome of each cell, and multiple cells in each spore stage (Hallett and Bartholomew, Reference Hallett and Bartholomew2006; Atkinson, unpublished results), there are underlying populations of molecules in which variation can exist. For metazoans in general, sequence variation among ribosomal DNA copies within an individual organism is thought to be minimal due to concerted evolution of the ribosomal DNA (Hillis and Davis, Reference Hillis and Davis1988). Changes in the sequence are thought to sweep rapidly through a population and lead to the dominance of particular sequence type, however, the degree of concerted evolution will vary at different loci (particularly non-coding), and if the organism undergoes recombination. Various levels of intra-genomic heterogeneity in ribosomal DNA sequence has been observed in many organisms (Rooney, Reference Rooney2004; Keller et al. Reference Keller, Chintauan-Marquier, Veltsos and Nichols2006; Bart et al. Reference Bart, van der Heijden, Greve, Speijer, Landman and van Gool2008; Gong et al. Reference Gong, Dong, Xihan and Massana2013). Low level intra-genomic ITS-1 variation has been shown for four myxozoans, Kudoa thyrsites, Myxobolus cerebralis, Tetracapsuloides bryosalmonae and C. shasta (Henderson and Okamura, Reference Henderson and Okamura2004; Whipps et al. Reference Whipps, El-Matbouli, Hedrick, Blazer and Kent2004; Whipps and Kent, Reference Whipps and Kent2006; Atkinson and Bartholomew, Reference Atkinson and Bartholomew2010a, Reference Atkinson and Bartholomewb). For example, in M. cerebralis, clones from individual actinospores showed 1.7% intra-spore variation (Whipps et al. Reference Whipps, El-Matbouli, Hedrick, Blazer and Kent2004). In C. shasta genotypes II/III, we identified 0.6% variation within individual myxospores (as a single ATC insertion/deletion in the ~500 bp ITS-1 region). As individual myxospores and actinospores are comprised of multiple cells, it is unknown whether the intra-spore genetic variation is between or within parasite cells (Whipps et al. Reference Whipps, El-Matbouli, Hedrick, Blazer and Kent2004); though intra-spore variation is probably less likely in myxospores, as parasites undergo only clonal reproduction in the vertebrate host (Morris, Reference Morris2012; Feist et al. Reference Feist, Morris, Alama-Bermejo, Holzer, Okamura, Gruhl and Bartholomew2015).
For C. shasta, population genetics and evolution is complicated throughout its range in the Pacific Northwest by human-mediated factors, which impact the parasite both directly through flow modification (affecting temperature and survival of waterborne spore stages; Bjork and Bartholomew, Reference Bjork and Bartholomew2009) and indirectly through impacts to both its invertebrate host polychaete worm (Bartholomew et al. Reference Bartholomew, Whipple, Stevens and Fryer1997; Alexander et al. Reference Alexander, Hallett, Stocking, Xue and Bartholomew2014) and salmonid fish hosts. Dam emplacement, stocking and transport of fish between river basins, all affect specific host availability, which likely drives evolutionary changes in the parasite populations. C. shasta has persistent, consistent and sympatric ITS-1 variants demonstrated across its geographical and host range (Atkinson and Bartholomew, Reference Atkinson and Bartholomew2010b; Stinson and Bartholomew, Reference Stinson and Bartholomew2012). These genetic variants probably persist due to limited opportunities for parasites of different genotypes to cross: sexual reproduction in C. shasta is restricted to the polychaete worm host (Meaders and Hendrickson, Reference Meaders and Hendrickson2009). We assume the incidence of infection by multiple individual parasites is minimal given the observed low prevalence of C. shasta infection in wild polychaete populations (up to ~8% but typically 1-2%; Stocking and Bartholomew, Reference Stocking and Bartholomew2007; Alexander et al. Reference Alexander, Hallett, Stocking, Xue and Bartholomew2014), and therefore that the opportunity for sexual crossing of different genotype parasites is low.
Thus, we assumed that individual spores could only be one genotype, and that mixed genotype data was an artifact of the aggregation effect of multiple, individual parasites of different genotypes infecting a host fish (as has been postulated for K. thyrsites; Whipps and Kent, Reference Whipps and Kent2006), or being present simultaneously in an environmental sample (e.g. all four genotypes may be present in a 1L water sample). The reduction in the availability of ‘pure’ genotype II material in both field and laboratory hosts used for ongoing genome studies and infection experiments impelled us to challenge these assumptions, specifically to better characterize the co-incidence of genotypes II and III.
Accordingly, we optimized spore isolation and amplification methods that enabled resolution of genotypes from individual parasites from host fish with known mixed genotype signal. We successfully isolated individual C. shasta myxospores (~10 µm) using a glass micropipette; a method used previously to isolate spores for qPCR standardization (Hallett and Bartholomew, Reference Hallett and Bartholomew2006), and individual actinospores from other myxozoan species (Zhai et al. Reference Zhai, Zhou and Gui2012). We found that dilution of spores to fewer than one-per-field was necessary to reduce the likelihood of aspirating more than one spore, and that pre-loading the pipette with water reduced capillary action and enabled more precise aspiration of individual spores. We attempted to amplify DNA by adding PCR mastermix directly to a dried, undigested spore in the reaction tube, which has worked previously for actinospores of C. shasta and M. cerebralis (Whipps et al. Reference Whipps, El-Matbouli, Hedrick, Blazer and Kent2004; Hallett and Bartholomew, Reference Hallett and Bartholomew2006). For us, this approach gave poor amplification, which could be due to myxospores being more resistant to disruption than C. shasta actinospores, and having far fewer cells (6 compared with >70; hence fewer rDNA copies) than M. cerebralis actinospores (El-Matbouli and Hoffmann, Reference El-Matbouli and Hoffmann1998). When we incorporated an in-tube digestion step, we saw dramatically improved amplification, compared with both the direct addition of PCR master mix and re-hydration and incubating, prior to PCR (Fig. 3).
We designed novel C. shasta ITS-1 DNA primers that could function at the higher temperature of a combined anneal/extension step used with Titanium Taq, a high-fidelity DNA polymerase shown previously to perform well at amplifying low template concentration (Clontech.com). These primers were based on our previous assay (Atkinson and Bartholomew, Reference Atkinson and Bartholomew2010a) and generated a near-identical length amplicon that spanned the genotyping region. PCR amplification of DNA from single spores was strong, specific, and yielded ample DNA for direct Sanger sequencing of PCR products. As in previous work, we estimated genotype proportions based on peak height ratios in the sequence chromatograms, as we consider this both a more efficient estimate of genotype mixes than cloning and a method that averages-out individual copy variants. We have a resolution of ~5% for genotype proportions estimated from chromatograms, which would require sequencing of at least 20 clones to yield similar data: an approach that would be more expensive in terms of both labour and sequencing, and resolve potentially meaningless variations in single ITS copies. In the present study, 2 (out of 24) reaction tubes did not show amplification and we assumed that these missed having a myxospore pipetted into them; one drawback of the single-spore pipetting technique is that it was not possible to visually confirm a spore had been pipetted into a tube, prior to PCR. Genotype results were surprising but conclusive: all single spores contained a mixture of genotypes II and III. Heretofore, we had considered ITS-1 genotypes II and III as unique parasite variants, but our results here do not support this hypothesis. Instead, individual C. shasta spores had mixed genotype sequences and therefore appear to have genetic differences among their ITS-1 copies. Hence, in the absence of additional characters (genetic, host, and to a lesser extent geographic locality) to justify maintaining them as separate classifications, we should regard genotype III as a sub-genotype of II, and not a separate genotype as originally ascribed (Atkinson and Bartholomew, Reference Atkinson and Bartholomew2010b). Given the existence of multiple, genetically variable ITS copies, future work could focus on developing alternative genetic markers for genotyping, possibly using Next Generation Sequencing data, and ideally using loci correlated with parasite virulence.
The single spore isolation and digestion method that we demonstrated should be applicable to spore-level genetic analyses of other myxozoan species, as most myxospores are similar in size to C. shasta. Different densities of Percoll would need to be trialed to optimize purification of different species, and more resistant spores (particularly hard-shelled ‘freshwater’ lineage species like Myxobolus and Henneguya; Liu et al. Reference Liu, Whipps, Nie and Gu2014) may need additional incubation time for complete digestion. For species where specific primers do not exist, a range of general myxozoan primers is available (e.g. Hallett and Diamant, Reference Hallett and Diamant2001; Fiala, Reference Fiala2006; Whipps and Kent, Reference Whipps and Kent2006), which in principle should amplify individual spores of novel species. The other primary benefit of single-spore sequencing is to allow more confident identification of myxozoans in wild fish, which frequently are infected by multiple myxozoans, particularly for coelozoic species, which include Ceratomyxa, Parvicapsula, Sphaerospora, Chloromyxum and Myxidium, which may not form discrete plasmodia or cysts.
In summary, we revealed the presence of ITS-1 variation within individual C. shasta parasite spores, and demonstrated conclusively that genotypes II and III should be regarded as a single C. shasta type based on DNA sequencing; the biological differences, if any, between ‘pure’ types II and III are unknown. The existence of variation in C. shasta ITS copies demonstrates that there is a limit to the usefulness of this locus, however given the independent correlations between fish host and ITS type (for types O, and I in particular; Atkinson and Bartholomew, Reference Atkinson and Bartholomew2010a) we consider the locus has value in this context, but no correlations should be made to parasite virulence until other genetic markers are developed for that purpose. We have demonstrated a workflow for purifying, digesting and amplifying DNA from single myxozoan myxospores, which we consider to be a useful tool for both higher resolution of myxozoan genotype analysis in mixed populations, and for generating unambiguous genetic data from spores in hosts with mixed myxozoan infections.
Acknowledgements
Rich Holt and Ryan Craig (both Oregon State University) exposed the sentinel fish in the Klamath River. We thank Yanhua Zhai (Huazhong Agricultural University) for sharing her experiences with in-tube extraction and amplification of DNA from low numbers of myxozoan actinospores, during her post-doctoral visit to OSU.
Financial support
This work was funded by the United States Department of the Interior, Bureau of Reclamation (J.L.B. and S.L.H. #R15PG00065); and by BARD, The United States-Israel Binational Agricultural Research and Development Fund (J.L.B. and S.D.A., Research Grant No. IS-4576-13).
Conflict of interest
None.