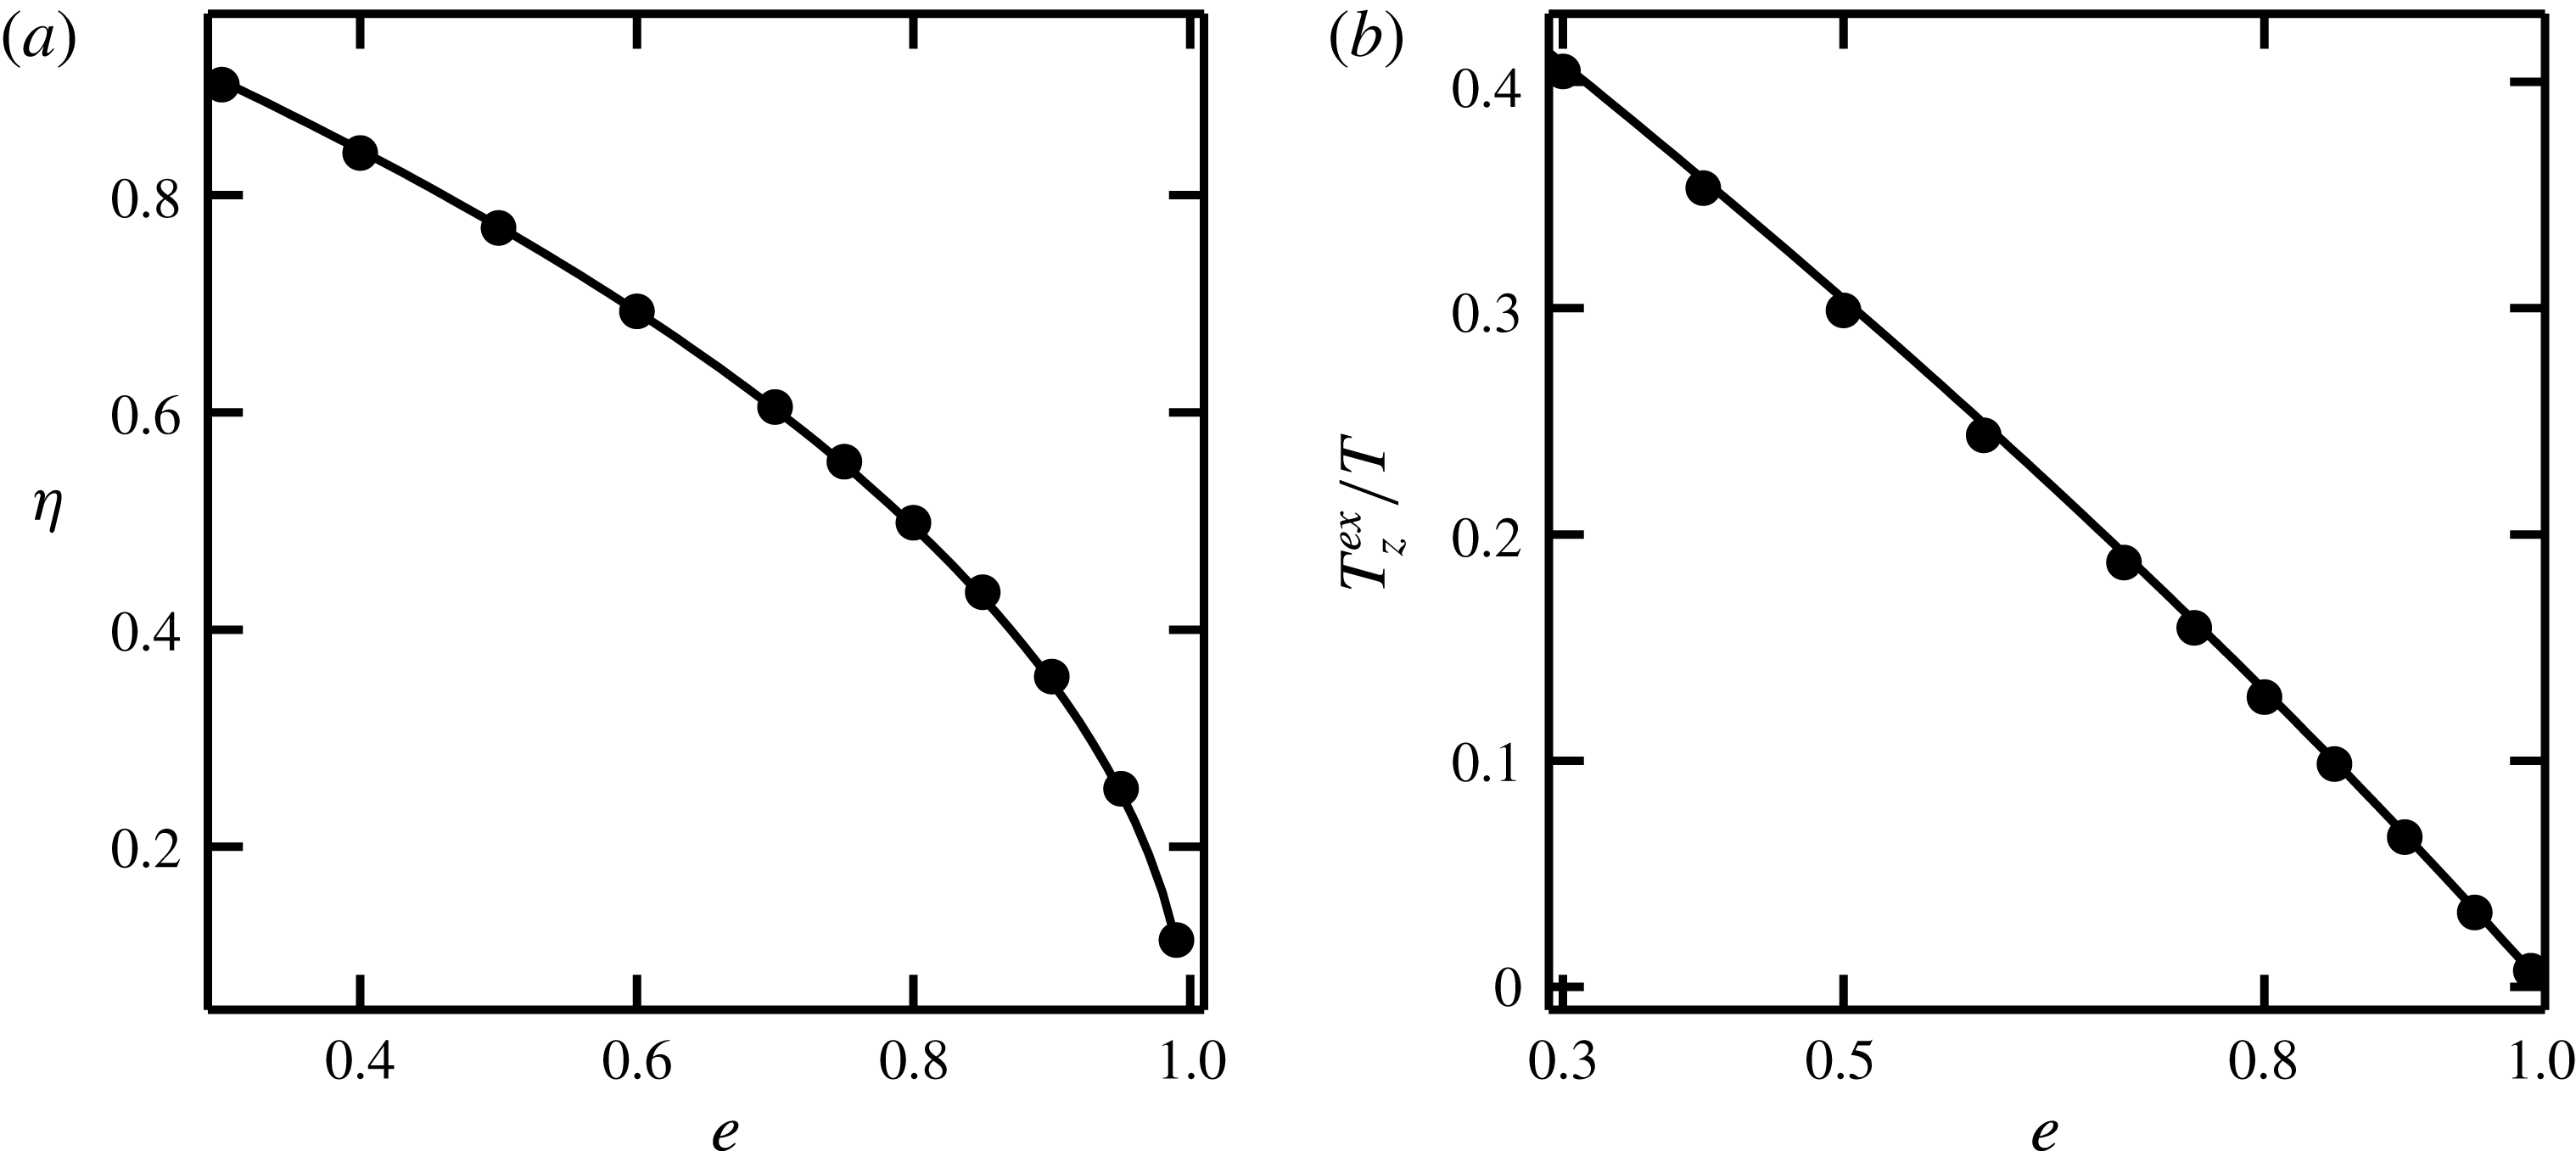
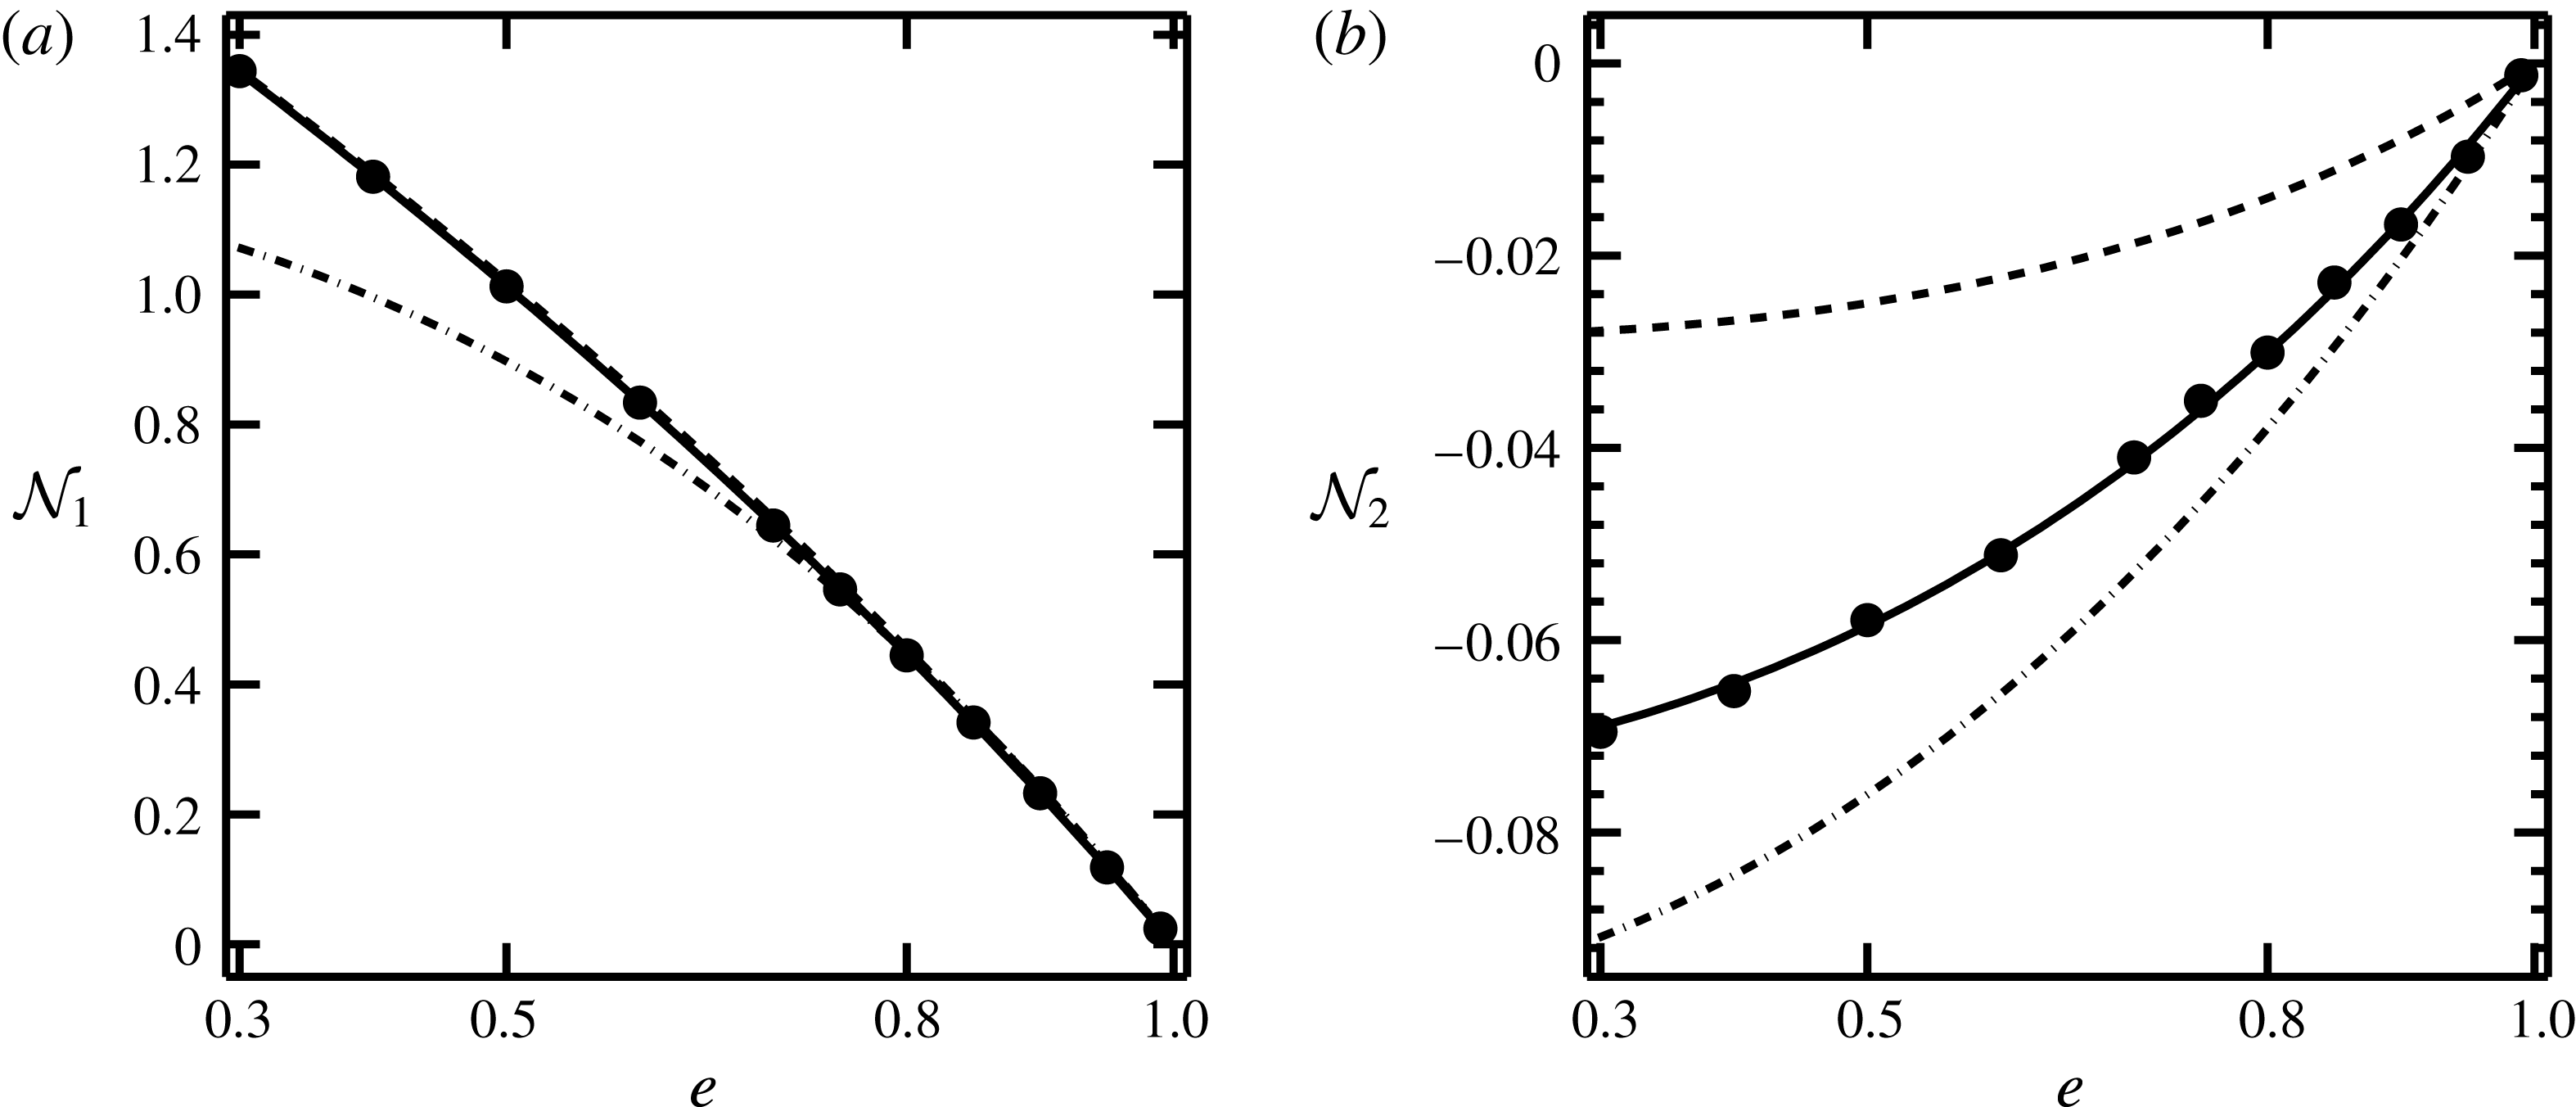
1 Introduction
During the last few decades, a lot of research has been done to understand the behaviours of rapid granular flows (Savage & Jeffrey Reference Savage and Jeffrey1981; Lun et al.
Reference Lun, Savage, Jeffrey and Chepurniy1984; Jenkins & Richman Reference Jenkins and Richman1985; Campbell Reference Campbell1990; Brey et al.
Reference Brey, Dufty, Kim and Santos1998; Sela & Goldhirsch Reference Sela and Goldhirsch1998; Goldhirsch Reference Goldhirsch2003; Forterre & Pouliquen Reference Forterre and Pouliquen2008; Rao & Nott Reference Rao and Nott2008), a collection macroscopic inelastic (the restitution coefficient
 $e<1$
) hard particles for which the effect of the interstitial fluid is neglected, and the tools from dense gas kinetic theory have been successfully employed to understand its hydrodynamics and rheology. The closely related research area of gas–solid suspensions (Davidson & Harrison Reference Davidson and Harrison1963; Anderson & Jackson Reference Anderson and Jackson1968; Buyevich Reference Buyevich1971; Gidaspow Reference Gidaspow1994; Jackson Reference Jackson2000; Guazzelli & Morris Reference Guazzelli and Morris2011), in which the viscous drag due to interstitial fluid and other related hydrodynamic effects need to be incorporated, has also been extensively studied over the last century due to its importance in fluidized bed and fluid catalytic cracking (FCC) reactors (Davidson & Harrison Reference Davidson and Harrison1963; Gidaspow Reference Gidaspow1994) encountered in chemical and process industries. For continuum models of gas–solid suspensions, the kinetic-theory-based rheological models have been suggested by considering elastically colliding particles (Koch Reference Koch1990; Tsao & Koch Reference Tsao and Koch1995) as well as for inelastic particles (Louge, Mastorakos & Jenkins Reference Louge, Mastorakos and Jenkins1991; Sangani et al.
Reference Sangani, Mo, Tsao and Koch1996; Lun & Savage Reference Lun, Savage, Pöschel and Brilliantov2003) interacting in a bath of a Newtonian gas.
For the present problem of a sheared gas–solid suspension of inelastic particles, the energy input due to shear is compensated by two mechanisms, (i) inelastic inter-particle collisions, characterized by a coefficient of normal restitution (
 $e$
) and (ii) the drag force which the surrounding fluid exerts on the particles. The volume fraction of the suspended particles (of diameter
 $\unicode[STIX]{x1D70E}$
and mass
 $m$
) is assumed to be small, i.e.
 $\unicode[STIX]{x1D708}=\unicode[STIX]{x03C0}\unicode[STIX]{x1D70E}^{3}n/6\ll 1$
, representing a ‘dilute’ suspension, along with the conditions of (i) small Reynolds number
 $Re=\unicode[STIX]{x1D70C}_{g}\dot{\unicode[STIX]{x1D6FE}}\unicode[STIX]{x1D70E}^{2}/\unicode[STIX]{x1D707}_{g}\ll 1$
(where
 $\unicode[STIX]{x1D70C}_{g}$
and
 $\unicode[STIX]{x1D707}_{g}$
are the gas density and its viscosity, respectively, and
 $\dot{\unicode[STIX]{x1D6FE}}$
is the imposed shear rate on the suspension) and (ii) finite Stokes number
 $$\begin{eqnarray}St=\dot{\unicode[STIX]{x1D6FE}}\unicode[STIX]{x1D70F}_{v},\quad \text{with }\unicode[STIX]{x1D70F}_{v}=m/3\unicode[STIX]{x03C0}\unicode[STIX]{x1D707}_{g}\unicode[STIX]{x1D70E}\end{eqnarray}$$
being the viscous relaxation time which is a measure of the time a typical particle takes to relax back to the local fluid velocity. The limit of
 $St\rightarrow \infty$
represents the ‘dry’ granular gas (Campbell Reference Campbell1990; Goldhirsch Reference Goldhirsch2003). Under the above assumptions, Tsao & Koch (Reference Tsao and Koch1995) analysed the hydrodynamics and the non-Newtonian rheology of a dilute suspension of elastic (
 $e=1$
) hard particles employing the Grad’s moment-expansion method (i.e. an expansion in terms of Hermite polynomials around a Maxwellian, Grad Reference Grad1949). They discovered two qualitatively different states, dubbed (i) ‘quenched’ (low temperature) and (ii) ‘ignited’ (high temperature) states, corresponding to the time intervals (i)
 $\unicode[STIX]{x1D70F}_{c}\gg \unicode[STIX]{x1D70F}_{v}\gg \dot{\unicode[STIX]{x1D6FE}}^{-1}$
and (ii)
 $\unicode[STIX]{x1D70F}_{c}\ll \dot{\unicode[STIX]{x1D6FE}}^{-1}\ll \unicode[STIX]{x1D70F}_{v}$
, respectively, where
 $\unicode[STIX]{x1D70F}_{c}$
is the collision time (i.e. the average time between two successive collisions). They analytically determined two critical Stokes numbers
 $St_{c_{1}}$
and
 $St_{c_{2}}$
(with
 $St_{c_{2}}>St_{c_{1}}$
), below and above which the flow remains in the quenched and ignited states, respectively. They also determined the shear viscosity and the first and second normal-stress differences, and compared their theory with DSMC (direct simulation Monte Carlo) data.
Sangani et al. (Reference Sangani, Mo, Tsao and Koch1996) extended the work of Tsao & Koch (Reference Tsao and Koch1995) to (i) a ‘dense’ gas–solid suspension of elastic (
 $e=1$
) particles as well as to (ii) a ‘dilute’ suspension of inelastic (
 $e<1$
) particles. The same Grad moment expansion was used to analyse constitutive relations from the underlying Enskog–Boltzmann equation; but their analysis is deficient in the sense that they found zero value for the second normal-stress difference as they did not incorporate certain nonlinear terms (see § 5 in this work). They briefly discussed the lower limit of Stokes number
 $St_{c_{1}}$
(based on the solution for the ignited state), but an analysis of the ‘ignited–quenched’ transitions, identifying the regions for the existence of different states, in terms of Stokes number (
 $St$
), particle volume fraction (
 $\unicode[STIX]{x1D708}$
) and the coefficient of restitution (
 $e$
) has not been worked out until now. The latter effect of the restitution coefficient is important for dissipative particles and forms one motivation of the present work.
In the current decade, Parmentier & Simonin (Reference Parmentier and Simonin2012) analysed a sheared gas–solid suspension by considering a distribution function that sandwiches both the ignited and quenched states – the resulting rheological fields are reasonably well predicted over a range of density and Stokes numbers, although quantitative mismatch with simulation data exists that increases with increasing dissipation (i.e. at smaller
 $e$
). A Navier–Stokes-order continuum model has been developed by Garzo et al. (Reference Garzo, Tenneti, Subramaniam and Hrenya2012) for a moderately dense gas–solid suspension following dense gas kinetic theory. They solved the underlying Enskog–Boltzmann equation using a Chapman–Enskog-like expansion around a time-dependent homogeneous cooling state for a gas–solid suspension, and the particle motion has been modelled via a Langevin-type stochastic model with Stokesian drag. The resulting transport coefficients for the particle phase are found to have explicit dependence on the gas-phase parameters. However, the prediction of the latter model for the shear viscosity of a suspension indicates large discrepancies with simulation data in the dilute limit of low-
 $St$
suspension, presumably due to the presence of order-one values of normal-stress differences and other non-Newtonian effects. A related work to uncover the non-Newtonian rheology of a ‘dilute’ gas–solid suspension has been done recently by Chamorro, Reyes & Garzo (Reference Chamorro, Reyes and Garzo2015). They followed the standard Grad’s method to analyse the ignited state of a gas–solid suspension, and the related predictions on the granular temperature and the non-Newtonian stress tensor are found to be quantitatively similar to the earlier work of Tsao & Koch (Reference Tsao and Koch1995); for example, the suspension viscosity is over-predicted by the Grad’s moment theory at smaller values of
 $e$
, although the discrepancy decreases with increasing Stokes number. Collectively, the above literature review points toward the need to go beyond the well-studied Newtonian rheology (of Navier–Stokes-order) for both dry granular and gas–solid suspensions.
In this paper, we revisit and extend the work of Tsao & Koch (Reference Tsao and Koch1995) by considering a dilute system of inelastic (
 $e\leqslant 1$
) particles suspended in a bath of a Newtonian gas, and interacting via (i) a Stokesian drag force and (ii) hard-core inelastic collisions. Our work differs from all previous works on gas–solid suspensions as we adopt the anisotropic-Maxwellian distribution function (Goldreich & Tremaine Reference Goldreich and Tremaine1978; Jenkins & Richman Reference Jenkins and Richman1988; Richman Reference Richman1989) to analyse the underlying Boltzmann equation under homogeneous shearing conditions. The latter assumption is motivated from our recent work (Saha & Alam Reference Saha and Alam2014, Reference Saha and Alam2016a
; Alam & Saha Reference Alam and Saha2017) on ‘dry’ (
 $St\rightarrow \infty$
) sheared granular fluids which established that the transport coefficients for highly inelastic systems (
 $e\ll 1$
) of a sheared granular fluid (both dilute and dense) can be accurately predicted by the anisotropic Maxwellian [in comparison to (i) the standard Grad’s moment expansion (in terms of a truncated Hermite series around a Maxwellian) as well as (ii) the Burnett-order solutions obtained from Chapman–Enskog expansion]. Here we demonstrate the superiority of the former for the case of a sheared gas–solid suspension via a one-to-one comparison of three theories with simulation data. Another important focus of the present work is to analyse and quantify the anisotropy of the second moment,
 $\unicode[STIX]{x1D648}=\langle \boldsymbol{C}\boldsymbol{C}\rangle$
, of fluctuation/peculiar velocity, and subsequently tie and explain the rheological/transport coefficients of a sheared gas–solid suspension in terms of anisotropies of
 $\unicode[STIX]{x1D648}$
. The underlying analysis utilizes the geometric structure of the eigen-basis of both the shear tensor and the second-moment tensor; this provides geometric insight into the origin of normal-stress differences as found for the case of a sheared granular fluid (Saha & Alam Reference Saha and Alam2016a
). It must be noted that the analysis of stress anisotropy in this form was initiated in a seminal work by Goldreich & Tremaine (Reference Goldreich and Tremaine1978) and subsequently by others (Shukhman Reference Shukhman1984; Araki & Tremaine Reference Araki and Tremaine1986; Araki Reference Araki1988; Jenkins & Richman Reference Jenkins and Richman1988; Richman Reference Richman1989) and the present effort is a continuation of the same legacy to the case of a sheared gas–solid suspension.
This paper is organized as follows. A brief account of the problem and the governing equations for the gas and particle phases are given in § 2. The anisotropic-Maxwellian distribution function is introduced in § 2.1 which is employed to analyse the ‘ignited’ state of sheared gas–solid suspension; the second-moment tensor for the uniform shear flow is constructed in § 2.1.1 in terms of its eigen-basis. The source term of the second-moment balance equation is calculated in §§ 2.1.2 and 2.2 for the ignited and quenched states, respectively. The second-moment balance combining both ignited (
 $I$
) and quenched (
 $Q$
) states is analysed in § 2.3. The multi-stability and hysteresis transitions in granular temperature are analysed in detail in § 3, along with (i) the validation and superiority of the present analysis in § 3.1, (ii) analytical/asymptotic solutions for temperatures in three states in § 3.2 and (iii) the critical Stokes numbers for ‘
 $I\leftrightarrow Q$
’ transitions in § 3.3. The non-Newtonian rheology (shear thickening, normal-stress differences) is analysed in §§ 4.2 and 4.3, in terms of the anisotropies of the second-moment tensor (§ 4.1). The relative merits of the present theory over the standard Grad’s moment expansion and Chapman–Enskog expansion are analysed in § 5 via comparisons with particle-level simulation data. The conclusions are given in § 6. The mathematical details of various analyses are relegated to appendices A–I.
2 Problem description and the kinetic-theory analysis
We examine the uniform shear flow (with an overall shear rate of
 $\dot{\unicode[STIX]{x1D6FE}}$
) of a ‘dilute’ gas–solid suspension in the absence of gravity, with a collection of smooth inelastic spheres of mass
 $m$
and diameter
 $\unicode[STIX]{x1D70E}$
being suspended in a gas. We are interested in a steady-state suspension where the fluid inertia is very small but the particle inertia remains finite. Under the assumptions of the smallness of particle Reynolds number (
 $Re=\unicode[STIX]{x1D70C}_{g}\dot{\unicode[STIX]{x1D6FE}}\unicode[STIX]{x1D70E}^{2}/\unicode[STIX]{x1D707}_{g}\ll 1$
), the gas-phase velocity (
 $\boldsymbol{v}$
) obeys the Stokes equations of motion
 $$\begin{eqnarray}\unicode[STIX]{x1D707}_{g}\unicode[STIX]{x1D6FB}^{2}\boldsymbol{v}=\unicode[STIX]{x1D735}p_{g},\quad \unicode[STIX]{x1D735}\boldsymbol{\cdot }\boldsymbol{v}=0,\end{eqnarray}$$
where
 $\unicode[STIX]{x1D707}_{g}$
is the shear viscosity of the gas and
 $p_{g}(\boldsymbol{x},t)$
is its pressure.
For the particle phase, we adopt the kinetic theory of gases as pursued in granular gases (Savage & Jeffrey Reference Savage and Jeffrey1981; Lun et al.
Reference Lun, Savage, Jeffrey and Chepurniy1984; Jenkins & Richman Reference Jenkins and Richman1985; Brey et al.
Reference Brey, Dufty, Kim and Santos1998; Sela & Goldhirsch Reference Sela and Goldhirsch1998; Brilliantov & Pöschel Reference Brilliantov and Pöschel2004; Rongali & Alam Reference Rongali and Alam2014) as well as in gas–solid suspensions (Koch Reference Koch1990; Louge et al.
Reference Louge, Mastorakos and Jenkins1991; Tsao & Koch Reference Tsao and Koch1995; Sangani et al.
Reference Sangani, Mo, Tsao and Koch1996; Lun & Savage Reference Lun, Savage, Pöschel and Brilliantov2003; Parmentier & Simonin Reference Parmentier and Simonin2012). The evolution of the single-particle distribution function
 $f(\boldsymbol{c},\boldsymbol{x},t)$
follows the celebrated Boltzmann equation
 $$\begin{eqnarray}\left(\frac{\unicode[STIX]{x2202}}{\unicode[STIX]{x2202}t}+\boldsymbol{c}\boldsymbol{\cdot }\unicode[STIX]{x1D735}\right)f+\unicode[STIX]{x1D735}_{\boldsymbol{c}}\boldsymbol{\cdot }\left(f\frac{\text{d}\boldsymbol{c}}{\text{d}t}\right)=\left(\frac{\unicode[STIX]{x2202}f}{\unicode[STIX]{x2202}t}\right)_{coll},\end{eqnarray}$$
where
 $\unicode[STIX]{x1D735}_{\boldsymbol{c}}$
is divergence operator in the velocity space and
 $(\unicode[STIX]{x2202}f/\unicode[STIX]{x2202}t)_{coll}$
is the well-known collision operator (Chapman & Cowling Reference Chapman and Cowling1970). The effect of the fluid phase is incorporated into (2.2) via the acceleration term on its left-hand side. The acceleration of the particles is assumed to follow the Stokes linear drag law:
 $$\begin{eqnarray}\frac{\text{d}\boldsymbol{c}}{\text{d}t}=-\frac{\boldsymbol{c}-\boldsymbol{v}}{\unicode[STIX]{x1D70F}_{v}},\end{eqnarray}$$
with
 $\unicode[STIX]{x1D70F}_{v}=m/(3\unicode[STIX]{x03C0}\unicode[STIX]{x1D707}_{g}\unicode[STIX]{x1D70E})$
being the viscous relaxation time of the particles. Equation (2.3) holds if the particle Reynolds number and the density ratio (
 $\unicode[STIX]{x1D70C}_{f}/\unicode[STIX]{x1D70C}_{p}$
) are very small; for large Reynolds numbers, a nonlinear form of the drag law would be necessary (Jackson Reference Jackson2000).
Let
 $\unicode[STIX]{x1D713}(\boldsymbol{C})$
denote any particle property and it’s mean/average is defined by
 $$\begin{eqnarray}\langle \unicode[STIX]{x1D713}\rangle =\frac{1}{n(\boldsymbol{x},t)}\int \unicode[STIX]{x1D713}(\boldsymbol{c})f(\boldsymbol{c},\boldsymbol{x},t)\,\text{d}\boldsymbol{c}\equiv \frac{1}{n(\boldsymbol{x},t)}\int \unicode[STIX]{x1D713}(\boldsymbol{C})f(\boldsymbol{C})\,\text{d}\boldsymbol{C}.\end{eqnarray}$$
Here
 $n\equiv n(\boldsymbol{x},t)$
denotes the number density and
 $\unicode[STIX]{x1D70C}(\boldsymbol{x},t)=mn\equiv \unicode[STIX]{x1D70C}_{p}\unicode[STIX]{x1D708}$
is the mass density of the particle phase, with
 $\unicode[STIX]{x1D708}=\unicode[STIX]{x03C0}\unicode[STIX]{x1D70E}^{3}n/6$
being the volume fraction of particles and
 $\unicode[STIX]{x1D70C}_{p}=m/(\unicode[STIX]{x03C0}\unicode[STIX]{x1D70E}^{3}/6)$
its intrinsic/material density. The macroscopic/hydrodynamic velocity
 $\boldsymbol{u}=\langle \boldsymbol{c}\rangle$
, the granular temperature
 $T=\langle \boldsymbol{C}^{2}/3\rangle$
and the second-moment tensor
 $\unicode[STIX]{x1D648}=\langle \boldsymbol{C}\boldsymbol{C}\rangle$
are obtained by substituting
 $\unicode[STIX]{x1D713}=\boldsymbol{c}$
,
 $(1/3)\boldsymbol{C}^{2}$
and
 $\boldsymbol{C}\boldsymbol{C}$
, respectively, in (2.4), where
 $\boldsymbol{C}=\boldsymbol{c}-\boldsymbol{u}$
is the peculiar velocity.
Focussing on a steady homogeneous sheared suspension, the Boltzmann equation (2.2) for the distribution function
 $f(\boldsymbol{C};\boldsymbol{x},t)$
reads (Chapman & Cowling Reference Chapman and Cowling1970)
 $$\begin{eqnarray}\displaystyle -C_{m}\dot{\unicode[STIX]{x1D6FE}}_{km}\frac{\unicode[STIX]{x2202}f}{\unicode[STIX]{x2202}C_{k}}+\frac{\unicode[STIX]{x2202}}{\unicode[STIX]{x2202}C_{k}}\left(\frac{\text{d}c_{k}}{\text{d}t}f\right)=\left(\frac{\unicode[STIX]{x2202}f}{\unicode[STIX]{x2202}t}\right)_{coll}, & & \displaystyle\end{eqnarray}$$
where
 $\dot{\unicode[STIX]{x1D6FE}}_{\unicode[STIX]{x1D6FC}\unicode[STIX]{x1D6FD}}=\dot{\unicode[STIX]{x1D6FE}}\unicode[STIX]{x1D6FF}_{\unicode[STIX]{x1D6FC}x}\unicode[STIX]{x1D6FF}_{\unicode[STIX]{x1D6FD}y}$
is the velocity gradient tensor of the uniform shear flow. On multiplying (2.5) by
 $m\unicode[STIX]{x1D713}(\boldsymbol{C})$
and integrating over the velocity space, the master balance equation is obtained (Jenkins & Richman Reference Jenkins and Richman1985; Sangani et al.
Reference Sangani, Mo, Tsao and Koch1996) as
 $$\begin{eqnarray}\unicode[STIX]{x1D70C}\left(\dot{\unicode[STIX]{x1D6FE}}_{km}\left\langle C_{m}\frac{\unicode[STIX]{x2202}\unicode[STIX]{x1D713}}{\unicode[STIX]{x2202}C_{k}}\right\rangle -\left\langle \frac{\text{d}c_{k}}{\text{d}t}\frac{\unicode[STIX]{x2202}\unicode[STIX]{x1D713}}{\unicode[STIX]{x2202}C_{k}}\right\rangle \right)=\boldsymbol{\aleph }(m\unicode[STIX]{x1D713}),\end{eqnarray}$$
where
 $$\begin{eqnarray}\boldsymbol{\aleph }(m\unicode[STIX]{x1D713})=\int m\unicode[STIX]{x1D713}\left(\frac{\unicode[STIX]{x2202}f}{\unicode[STIX]{x2202}t}\right)_{coll}\,\text{d}\boldsymbol{C}\end{eqnarray}$$
represents the collisional source of
 $m\unicode[STIX]{x1D713}$
.
Putting
 $\unicode[STIX]{x1D713}=1$
and
 $\boldsymbol{c}$
into (2.6), the mass and momentum balance equations for the particle phase, respectively, are obtained. For the steady uniform shear flow (
 $\boldsymbol{u}=(\dot{\unicode[STIX]{x1D6FE}}y,0,0)$
), the mass balance (
 $\unicode[STIX]{x1D735}\boldsymbol{\cdot }\boldsymbol{u}=0$
) is identically satisfied; the momentum balance equation is also satisfied since (i) the stress tensor is constant and (ii) the ‘mean’ drag on the particle phase (due to the gas phase) is zero. The latter follows from the assumption that there is no ‘slip’ between the coarse-grained velocity of the particle phase (
 $\boldsymbol{u}$
) and the ‘local’ gas velocity (
 $\boldsymbol{v}$
), i.e.
 $\boldsymbol{u}_{s}=\boldsymbol{u}-\boldsymbol{v}=0$
. The hydrodynamic interactions among particles are neglected in the present analysis which can be justified for a dilute suspension (Koch Reference Koch1990; Tsao & Koch Reference Tsao and Koch1995) at moderate to high values of Stokes number. For moderately dense gas–solid suspensions, Sangani et al. (Reference Sangani, Mo, Tsao and Koch1996) developed a Grad-type moment theory by incorporating hydrodynamic interactions in an ad hoc manner (via a corrective function
 $R_{diss}(\unicode[STIX]{x1D708})$
to the Stokes drag, with its dilute limit being
 $R_{diss}(\unicode[STIX]{x1D708}\rightarrow 0)\rightarrow 1$
). This theory was found to be in good agreement with full dynamic simulations of gas–solid suspensions even at a small Stokes number of
 $St\geqslant 5$
. The mean-field arguments of Sangani et al. (Reference Sangani, Mo, Tsao and Koch1996) were also used in a more recent work (Parmentier & Simonin Reference Parmentier and Simonin2012) on dense suspensions. The reader is referred to a review article (Koch & Hill Reference Koch and Hill2001) for further details on hydrodynamic interactions.
Inserting
 $\unicode[STIX]{x1D713}=\boldsymbol{C}\boldsymbol{C}$
into (2.6), we obtain the balance equation for the second moment:
 $$\begin{eqnarray}\unicode[STIX]{x1D64B}\boldsymbol{\cdot }\unicode[STIX]{x1D735}\boldsymbol{u}+(\unicode[STIX]{x1D64B}\boldsymbol{\cdot }\unicode[STIX]{x1D735}\boldsymbol{u})^{\text{T}}+\frac{2}{\unicode[STIX]{x1D70F}_{v}}\unicode[STIX]{x1D70C}\langle \boldsymbol{C}\boldsymbol{C}\rangle +\frac{1}{\unicode[STIX]{x1D70F}_{v}}\unicode[STIX]{x1D70C}\langle (\boldsymbol{u}-\boldsymbol{v})\boldsymbol{C}\rangle +\frac{1}{\unicode[STIX]{x1D70F}_{v}}\unicode[STIX]{x1D70C}\langle ((\boldsymbol{u}-\boldsymbol{v})\boldsymbol{C})^{\text{T}}\rangle =\boldsymbol{\aleph }(m\boldsymbol{C}\boldsymbol{C}),\end{eqnarray}$$
where
 $\unicode[STIX]{x1D64B}=\unicode[STIX]{x1D70C}\langle \boldsymbol{C}\boldsymbol{C}\rangle$
is the particle-phase stress tensor and
 $\boldsymbol{\aleph }(m\boldsymbol{C}\boldsymbol{C})$
is the collisional source of the second moment as defined in (2.7). The third term on the left-hand side of (2.8) embodies the Stokes drag law (2.3), along with the following assumption
 $$\begin{eqnarray}\left\langle (\unicode[STIX]{x1D6FF}_{ik}C_{j}+\unicode[STIX]{x1D6FF}_{jk}C_{i})\frac{\text{d}\boldsymbol{c}_{k}}{\text{d}t}\right\rangle =-\frac{2}{\unicode[STIX]{x1D70F}_{v}}\langle C_{i}C_{j}\rangle ,\end{eqnarray}$$
which holds if the microstructure of the suspension is nearly isotropic (Sangani et al.
Reference Sangani, Mo, Tsao and Koch1996). The fourth and fifth terms in (2.8) vanish due to the zero-slip (
 $\boldsymbol{u}_{s}=\boldsymbol{u}-\boldsymbol{v}=0$
) assumption, leading to the final form of the second-moment balance equation
 $$\begin{eqnarray}\unicode[STIX]{x1D64B}\boldsymbol{\cdot }\unicode[STIX]{x1D735}\boldsymbol{u}+(\unicode[STIX]{x1D64B}\boldsymbol{\cdot }\unicode[STIX]{x1D735}\boldsymbol{u})^{\text{T}}+\frac{2}{\unicode[STIX]{x1D70F}_{v}}\unicode[STIX]{x1D64B}=\boldsymbol{\aleph }(m\boldsymbol{C}\boldsymbol{C}),\end{eqnarray}$$
which must be solved for the homogeneously sheared gas–solid suspension.
The integral expression for the source term in (2.10) is given by Jenkins & Richman (Reference Jenkins and Richman1985) and Saha & Alam (Reference Saha and Alam2014)
 $$\begin{eqnarray}\displaystyle \boldsymbol{\aleph }=\int m\boldsymbol{C}\boldsymbol{C}\left(\frac{\unicode[STIX]{x2202}f}{\unicode[STIX]{x2202}t}\right)_{coll}\,\text{d}\boldsymbol{C}=\frac{\unicode[STIX]{x1D70E}^{2}}{2}\int \unicode[STIX]{x1D6E5}(m\boldsymbol{C}\boldsymbol{C})f(\boldsymbol{C}_{1})f(\boldsymbol{C}_{2})(\boldsymbol{g}\boldsymbol{\cdot }\boldsymbol{k})\,\text{d}\boldsymbol{k}\,\text{d}\boldsymbol{C}_{1}\,\text{d}\boldsymbol{C}_{2}, & & \displaystyle\end{eqnarray}$$
with
 $$\begin{eqnarray}\unicode[STIX]{x1D6E5}(\boldsymbol{C}\boldsymbol{C})=\frac{(1+e)}{2}\{(1+e)(\boldsymbol{g}\boldsymbol{\cdot }\boldsymbol{k})^{2}\boldsymbol{k}\boldsymbol{k}-(\boldsymbol{g}\boldsymbol{\cdot }\boldsymbol{k})\boldsymbol{k}\boldsymbol{w}-(\boldsymbol{g}\boldsymbol{\cdot }\boldsymbol{k})\boldsymbol{w}\boldsymbol{k}\},\end{eqnarray}$$
where
 $\boldsymbol{g}=\boldsymbol{c}_{1}-\boldsymbol{c}_{2}$
and
 $\boldsymbol{w}=\boldsymbol{C}_{1}-\boldsymbol{C}_{2}\equiv \boldsymbol{g}-(\boldsymbol{u}_{1}-\boldsymbol{u}_{2})$
are the relative velocity and the relative fluctuation velocity, respectively, between two colliding particles 1 and 2;
 $\boldsymbol{k}\equiv \boldsymbol{k}_{12}=(\boldsymbol{x}_{2}-\boldsymbol{x}_{1})/|\boldsymbol{x}_{2}-\boldsymbol{x}_{1}|$
is the unit contact vector joining the centre of particle-1 to that particle-2. The molecular chaos ansatz,
 $f(\boldsymbol{C}_{1},\boldsymbol{C}_{2})=f(\boldsymbol{C}_{1})f(\boldsymbol{C}_{2})$
(i.e. the two-particle distribution function can be written as the product of two single-particle distribution functions), has been adopted in (2.11).
With an appropriate choice of the single-particle distribution function
 $f(\boldsymbol{C})$
, the collision integral (2.11) can be evaluated, which will be plugged into (2.10) to carry out the analysis for the particle-phase rheology and hydrodynamics of a sheared gas–solid suspension.
2.1 Analysis in the ignited sate
The ‘ignited’ state (Tsao & Koch Reference Tsao and Koch1995) represents the hydrodynamic state of fluidized particles in rapid granular flow (Goldhirsch Reference Goldhirsch2003), where the particles fly around randomly between two collisions without being much affected by the viscous drag of the interstitial fluid. A typical particle encounters successive collisions with other particles again and again before it can relax back to the local fluid velocity and hence the collision time is much smaller than the viscous relaxation time (
 $\unicode[STIX]{x1D70F}_{c}\ll \unicode[STIX]{x1D70F}_{v}$
). In this state, the particles have strong velocity fluctuations, resulting in
 $T/\dot{\unicode[STIX]{x1D6FE}}\unicode[STIX]{x1D70E}\gg 1$
.
As in our recent work (Saha & Alam Reference Saha and Alam2014, Reference Saha and Alam2016a ), the distribution function in the ignited state of a sheared suspension is assumed to be an anisotropic Maxwellian,
 $$\begin{eqnarray}f(\boldsymbol{c},\boldsymbol{x},t)=\frac{n}{(8\unicode[STIX]{x03C0}^{3}|\unicode[STIX]{x1D648}|)^{1/2}}\exp \left(-\frac{1}{2}\boldsymbol{C}\boldsymbol{\cdot }\unicode[STIX]{x1D648}\boldsymbol{\cdot }\boldsymbol{C}\right),\end{eqnarray}$$
where
 $\unicode[STIX]{x1D648}=\langle \boldsymbol{C}\boldsymbol{C}\rangle$
is the second moment of the fluctuation velocity, with
 $|\unicode[STIX]{x1D648}|=\det (\unicode[STIX]{x1D648})$
. This form of the distribution function has been used previously in studying the velocity dispersions in Saturn’s rings (Goldreich & Tremaine Reference Goldreich and Tremaine1978; Shukhman Reference Shukhman1984; Araki & Tremaine Reference Araki and Tremaine1986; Araki Reference Araki1988) as well as to analyse the shear flow of dry rapid granular flows (Jenkins & Richman Reference Jenkins and Richman1988; Richman Reference Richman1989; Lutsko Reference Lutsko2004). The choice of an anisotropic Maxwellian distribution function (2.13) can be justified from the maximum entropy principle as discussed in appendix A.
Note that for an isotropic second-moment tensor (
 $\unicode[STIX]{x1D648}\equiv T\unicode[STIX]{x1D6FF}_{ij}$
), equation (2.13) reduces to the well-known Maxwell–Boltzmann distribution function
 $$\begin{eqnarray}f^{M}=\frac{n}{(2\unicode[STIX]{x03C0}T)^{3/2}}\exp (-C^{2}/2T),\end{eqnarray}$$
which holds for the equilibrium/rest state of a molecular gas. A Hermite expansion around (2.14) of the form
 $$\begin{eqnarray}\displaystyle f(\boldsymbol{c},\boldsymbol{x},t)=f^{M}\mathop{\sum }_{i}a^{(i)}{\mathcal{H}}^{(i)}=f^{M}\left\{1+\frac{1}{2\unicode[STIX]{x1D70C}T^{2}}P_{\langle \unicode[STIX]{x1D6FC}\unicode[STIX]{x1D6FD}\rangle }C_{\unicode[STIX]{x1D6FC}}C_{\unicode[STIX]{x1D6FD}}+\cdots \,\right\} & & \displaystyle\end{eqnarray}$$
represents the well-known Grad’s moment expansion (GME) (Grad Reference Grad1949). Such moment expansion (2.15) has subsequently been employed to analyse the Boltzmann equation for molecular gases (Herdegen & Hess Reference Herdegen and Hess1982; Kremer Reference Kremer2010), granular gases (Jenkins & Richman Reference Jenkins and Richman1985; Kremer & Marques Reference Kremer and Marques2011) and gas–solid suspensions (Tsao & Koch Reference Tsao and Koch1995; Sangani et al. Reference Sangani, Mo, Tsao and Koch1996; Chamorro et al. Reference Chamorro, Reyes and Garzo2015).
Equation (2.15) with leading-order term (
 $P_{\langle \unicode[STIX]{x1D6FC}\unicode[STIX]{x1D6FD}\rangle }=\unicode[STIX]{x1D70C}M_{\unicode[STIX]{x1D6FC}\unicode[STIX]{x1D6FD}}-\unicode[STIX]{x1D70C}T\unicode[STIX]{x1D6FF}_{\unicode[STIX]{x1D6FC}\unicode[STIX]{x1D6FD}}$
is the stress deviator) yields the ten-moment system of Grad (Reference Grad1949), with density, velocity, temperature and stress deviator constituting the extended set of ten hydrodynamic fields – this is the minimal hydrodynamic set (Saha & Alam Reference Saha and Alam2016a
; Alam & Saha Reference Alam and Saha2017) that incorporates stress anisotropy (i.e. the normal-stress differences). It is shown in appendix A that the optimum distribution function for such an extended set of hydrodynamic fields (with anisotropic stress) is in fact given by (2.13) which maximizes entropy. Another justification for the choice of (2.13) will be provided a posteriori from a favourable comparison of its prediction for the hydrodynamic and rheological quantities of a sheared gas–solid suspension of inelastic particles (see §§ 3.1 and 5).
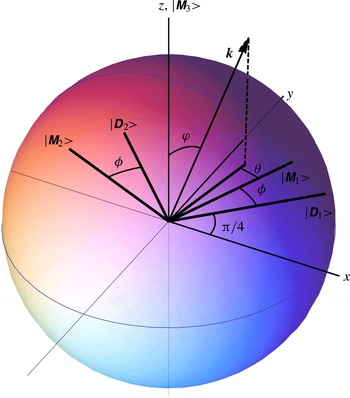
Schematic of the coordinate system and the eigen-basis for analysis; the eigen-directions of the shear tensor
 $\unicode[STIX]{x1D63F}$
and the second-moment tensor
 $\unicode[STIX]{x1D648}$
are depicted. The uniform shear flow,
 $\boldsymbol{u}=(\dot{\unicode[STIX]{x1D6FE}}y,0,0)$
, is directed along the
 $x$
-direction, with the velocity gradient along the
 $y$
-direction and the mean vorticity along the
 $z$
-direction. The angle
 $\unicode[STIX]{x1D719}$
between the principal eigen-directions of
 $\unicode[STIX]{x1D63F}$
and
 $\unicode[STIX]{x1D648}$
on the shear plane (
 $x,y$
) form the ‘non-coaxiality’ angle. Adapted from Saha & Alam (Reference Saha and Alam2016a
, figure 2).

2.1.1 Uniform shear flow and the second-moment tensor
The analysis in this section closely follows the theoretical framework introduced by Goldreich & Tremaine (Reference Goldreich and Tremaine1978), Richman (Reference Richman1989) and others (Shukhman Reference Shukhman1984; Araki & Tremaine Reference Araki and Tremaine1986; Jenkins & Richman Reference Jenkins and Richman1988; Chou & Richman Reference Chou and Richman1998). For the uniform shear flow (USF), the velocity gradient tensor can be decomposed as
 $$\begin{eqnarray}\unicode[STIX]{x1D735}\boldsymbol{u}=\unicode[STIX]{x1D63F}+\unicode[STIX]{x1D652}\equiv \left[\begin{array}{@{}ccc@{}}0 & \dot{\unicode[STIX]{x1D6FE}}/2 & 0\\ \dot{\unicode[STIX]{x1D6FE}}/2 & 0 & 0\\ 0 & 0 & 0\end{array}\right]+\left[\begin{array}{@{}ccc@{}}0 & \dot{\unicode[STIX]{x1D6FE}}/2 & 0\\ -\dot{\unicode[STIX]{x1D6FE}}/2 & 0 & 0\\ 0 & 0 & 0\end{array}\right],\end{eqnarray}$$
where
 $\unicode[STIX]{x1D63F}$
and
 $\unicode[STIX]{x1D652}$
are the shear and spin tensors, respectively. Referring to figure 1, the (
 $x,y$
)-plane is dubbed the shear plane and the
 $z$
-direction is the vorticity direction. The eigenvalues of
 $\unicode[STIX]{x1D63F}$
are
 $\dot{\unicode[STIX]{x1D6FE}}/2$
,
 $-\dot{\unicode[STIX]{x1D6FE}}/2$
and 0, with the corresponding orthonormal eigenvectors,
 $|D_{1}\!\rangle =(\cos (\unicode[STIX]{x03C0}/4),\sin (\unicode[STIX]{x03C0}/4),0)$
,
 $|D_{2}\!\rangle =(-\sin (\unicode[STIX]{x03C0}/4),\cos (\unicode[STIX]{x03C0}/4),0)$
and
 $|D_{3}\!\rangle =(0,0,1)$
, respectively, that are sketched in figure 1. While
 $|D_{3}\!\rangle$
is directed along the
 $z$
-axis, the shear-plane eigenvectors
 $|D_{1}\!\rangle$
and
 $|D_{2}\!\rangle$
are rotated by
 $45^{\circ }$
anticlockwise from the
 $xy$
-axes.
Since the granular temperature
 $T=M_{\unicode[STIX]{x1D6FC}\unicode[STIX]{x1D6FC}}/3$
is the isotropic measure of the second-moment tensor
 $\unicode[STIX]{x1D648}=\langle \boldsymbol{C}\boldsymbol{C}\rangle$
, we can decompose it as
 $\unicode[STIX]{x1D648}/T=\unicode[STIX]{x1D644}+\widehat{\unicode[STIX]{x1D648}}/T$
, where
 $\widehat{\unicode[STIX]{x1D648}}/T$
is the dimensionless counterpart of its deviatoric/traceless tensor. The eigenvalues of
 $\unicode[STIX]{x1D648}$
are denoted by
 $T(1+\unicode[STIX]{x1D709})$
,
 $T(1+\unicode[STIX]{x1D70D})$
and
 $T(1+\unicode[STIX]{x1D701})$
, with
 $\unicode[STIX]{x1D709}$
,
 $\unicode[STIX]{x1D70D}$
and
 $\unicode[STIX]{x1D701}$
being the eigenvalues of
 $\widehat{\unicode[STIX]{x1D648}}/T$
such that
 $$\begin{eqnarray}\unicode[STIX]{x1D709}+\unicode[STIX]{x1D70D}+\unicode[STIX]{x1D701}=0.\end{eqnarray}$$
The corresponding orthonormal set of eigen-directions are assumed to be
 $|M_{1}\!\rangle$
,
 $|M_{2}\!\rangle$
and
 $|M_{3}\!\rangle$
, respectively, as depicted in figure 1. Therefore, the second-moment tensor
 $\unicode[STIX]{x1D648}$
can be written in terms of its eigen-basis (Richman Reference Richman1989)
 $$\begin{eqnarray}\unicode[STIX]{x1D648}=T(1+\unicode[STIX]{x1D709})|M_{1}\!\rangle \!\langle \!M_{1}|+T(1+\unicode[STIX]{x1D70D})|M_{2}\!\rangle \!\langle \!M_{2}|+T(1+\unicode[STIX]{x1D701})|M_{3}\!\rangle \!\langle \!M_{3}|.\end{eqnarray}$$
Referring to figure 1, we assume that the shear-plane eigenvectors
 $|M_{1}\!\rangle$
and
 $|M_{2}\!\rangle$
can be obtained by rotating the system of axes at an angle
 $(\unicode[STIX]{x03C0}/4+\unicode[STIX]{x1D719})$
, with
 $\unicode[STIX]{x1D719}$
being unknown, in the anti-clockwise sense about the
 $z$
-axis which coincides with
 $|M_{3}\!\rangle$
:
 $$\begin{eqnarray}|M_{1}\!\rangle =\left[\begin{array}{@{}c@{}}\cos \left(\unicode[STIX]{x1D719}+{\displaystyle \frac{\unicode[STIX]{x03C0}}{4}}\right)\\ \sin \left(\unicode[STIX]{x1D719}+{\displaystyle \frac{\unicode[STIX]{x03C0}}{4}}\right)\\ 0\end{array}\right],\quad |M_{2}\!\rangle =\left[\begin{array}{@{}c@{}}-\sin \left(\unicode[STIX]{x1D719}+{\displaystyle \frac{\unicode[STIX]{x03C0}}{4}}\right)\\ \cos \left(\unicode[STIX]{x1D719}+{\displaystyle \frac{\unicode[STIX]{x03C0}}{4}}\right)\\ 0\end{array}\right]\quad \text{and}\quad |M_{3}\!\rangle =\left[\begin{array}{@{}c@{}}0\\ 0\\ 1\end{array}\right]\!.\end{eqnarray}$$
We further assume that the contact vector
 $\boldsymbol{k}$
makes an angle
 $\unicode[STIX]{x1D711}$
with
 $|M_{3}\!\rangle$
, and
 $\unicode[STIX]{x1D703}$
is the angle between
 $|M_{1}\!\rangle$
and
 $\boldsymbol{k}-(\boldsymbol{k}\boldsymbol{\cdot }\boldsymbol{z})\boldsymbol{z}$
, the projection of
 $\boldsymbol{k}$
on the shear plane, as shown in figure 1. Inserting (2.19) into (2.18), we obtain the following expression for the second-moment tensor
 $$\begin{eqnarray}\unicode[STIX]{x1D648}=T\unicode[STIX]{x1D644}+\widehat{\unicode[STIX]{x1D648}}\equiv T[\unicode[STIX]{x1D6FF}_{\unicode[STIX]{x1D6FC}\unicode[STIX]{x1D6FD}}]+T\left[\begin{array}{@{}ccc@{}}\unicode[STIX]{x1D706}^{2}+\unicode[STIX]{x1D702}\sin 2\unicode[STIX]{x1D719} & -\unicode[STIX]{x1D702}\cos 2\unicode[STIX]{x1D719} & 0\\ -\unicode[STIX]{x1D702}\cos 2\unicode[STIX]{x1D719} & \unicode[STIX]{x1D706}^{2}-\unicode[STIX]{x1D702}\sin 2\unicode[STIX]{x1D719} & 0\\ 0 & 0 & -2\unicode[STIX]{x1D706}^{2}\end{array}\right]\!,\end{eqnarray}$$
with the second term above denoting the deviatoric part of
 $\unicode[STIX]{x1D648}$
. Here we have introduced the following notations (Richman Reference Richman1989; Saha & Alam Reference Saha and Alam2016a
)
 $$\begin{eqnarray}\unicode[STIX]{x1D702}\equiv {\textstyle \frac{1}{2}}(\unicode[STIX]{x1D70D}-\unicode[STIX]{x1D709})\geqslant 0\quad \text{and}\quad \unicode[STIX]{x1D706}^{2}\equiv \frac{1}{2}(\unicode[STIX]{x1D70D}+\unicode[STIX]{x1D709})=-\frac{\unicode[STIX]{x1D701}}{2}\geqslant 0,\end{eqnarray}$$
such that the eigenvalues in the shear plane can be expressed in terms of
 $\unicode[STIX]{x1D702}$
and
 $\unicode[STIX]{x1D706}$
via
 $$\begin{eqnarray}\unicode[STIX]{x1D709}=\unicode[STIX]{x1D706}^{2}-\unicode[STIX]{x1D702}\quad \text{and}\quad \unicode[STIX]{x1D70D}=\unicode[STIX]{x1D706}^{2}+\unicode[STIX]{x1D702}>\unicode[STIX]{x1D709},\end{eqnarray}$$
with the eigenvalue,
 $\unicode[STIX]{x1D701}$
, along the vorticity direction (
 $z$
), being given by (2.21).
Since
 $\unicode[STIX]{x1D719}=0$
implies that the shear tensor (
 $\unicode[STIX]{x1D63F}$
) and the second-moment tensor (
 $\unicode[STIX]{x1D648}$
) have the same principal directions, a non-zero value of
 $\unicode[STIX]{x1D719}$
is a measure of the non-coaxiality angle between the principal directions of
 $\unicode[STIX]{x1D63F}$
and
 $\unicode[STIX]{x1D648}$
. It is straightforward to show that
 $\unicode[STIX]{x1D702}\sim (T_{x}-T_{y})$
is proportional to the difference between two temperatures
 $T_{x}$
and
 $T_{y}$
on the shear plane (
 $x,y$
), and hence
 $\unicode[STIX]{x1D702}\neq 0$
is indicative of the degree of temperature anisotropy on the shear plane. On the other hand, a non-zero value of
 $\unicode[STIX]{x1D706}^{2}$
is a measure of the excess temperature (Saha & Alam Reference Saha and Alam2016a
,Reference Saha and Alam
b
),
 $$\begin{eqnarray}T_{z}^{ex}=(T-T_{z})=2\unicode[STIX]{x1D706}^{2}T\quad \Rightarrow \quad \unicode[STIX]{x1D706}^{2}=\frac{T_{z}^{ex}}{2T},\end{eqnarray}$$
along the mean vorticity direction. In summary, the anisotropy of
 $\unicode[STIX]{x1D648}$
is quantified in terms of three dimensionless quantities: (i)
 $\unicode[STIX]{x1D702}\propto (T_{x}-T_{y})\neq 0$
, (ii)
 $\unicode[STIX]{x1D719}\neq 0$
and (iii)
 $\unicode[STIX]{x1D706}^{2}\propto T_{z}^{ex}\neq 0$
.
The second-moment tensor (2.20) in the USF of the suspension, constructed from its eigen-basis, is therefore completely determined when
 $T$
,
 $\unicode[STIX]{x1D702}$
,
 $\unicode[STIX]{x1D719}$
and
 $\unicode[STIX]{x1D706}^{2}$
are specified; the dependence on the Stokes number (
 $St$
) and the particle volume fraction (
 $\unicode[STIX]{x1D708}$
) are implicit, as will be made clear below.
2.1.2 Source term in the ignited state
Employing (2.13), the collisional production term (2.11) for the ignited state has been evaluated (see (B11) in appendix B in supplementary materials available online at https://doi.org/10.1017/jfm.2017.722)
 $$\begin{eqnarray}\displaystyle \aleph _{\unicode[STIX]{x1D6FC}\unicode[STIX]{x1D6FD}}^{is} & = & \displaystyle -\frac{6(1+e)\unicode[STIX]{x1D70C}_{p}\unicode[STIX]{x1D708}^{2}}{\unicode[STIX]{x03C0}^{3/2}\unicode[STIX]{x1D70E}}\left\{(1-e)\int k_{\unicode[STIX]{x1D6FC}}k_{\unicode[STIX]{x1D6FD}}(\boldsymbol{k}\boldsymbol{\cdot }\unicode[STIX]{x1D648}\boldsymbol{\cdot }\boldsymbol{k})^{3/2}\,\text{d}\boldsymbol{k}\right.\nonumber\\ \displaystyle & & \displaystyle \left.+\,2\int (k_{\unicode[STIX]{x1D6FC}}\,j_{\unicode[STIX]{x1D6FD}}+j_{\unicode[STIX]{x1D6FC}}k_{\unicode[STIX]{x1D6FD}})(\boldsymbol{k}\boldsymbol{\cdot }\unicode[STIX]{x1D648}\boldsymbol{\cdot }\boldsymbol{k})^{1/2}(\boldsymbol{k}\boldsymbol{\cdot }\unicode[STIX]{x1D648}\boldsymbol{\cdot }\boldsymbol{j})\,\text{d}\boldsymbol{k}\right\},\end{eqnarray}$$
 $$\begin{eqnarray}\displaystyle & = & \displaystyle -\frac{4(1+e)\unicode[STIX]{x1D70C}_{p}\unicode[STIX]{x1D708}^{2}T^{3/2}}{35\unicode[STIX]{x1D70E}\sqrt{\unicode[STIX]{x03C0}}}\left\{\vphantom{\left[\begin{array}{@{}ccc@{}}\unicode[STIX]{x1D702}^{2}+21\unicode[STIX]{x1D706}^{2}+21\unicode[STIX]{x1D702}\sin 2\unicode[STIX]{x1D719} & -21\unicode[STIX]{x1D702}\cos 2\unicode[STIX]{x1D719} & 0\\ -21\unicode[STIX]{x1D702}\cos 2\unicode[STIX]{x1D719} & \unicode[STIX]{x1D702}^{2}+21\unicode[STIX]{x1D706}^{2}-21\unicode[STIX]{x1D702}\sin 2\unicode[STIX]{x1D719} & 0\\ 0 & 0 & -2(\unicode[STIX]{x1D702}^{2}+21\unicode[STIX]{x1D706}^{2})\end{array}\right]}(1-e)\right.\nonumber\\ \displaystyle & & \displaystyle \times \left[\begin{array}{@{}ccc@{}}70+9\unicode[STIX]{x1D702}^{2}+42\unicode[STIX]{x1D706}^{2}+42\unicode[STIX]{x1D702}\sin 2\unicode[STIX]{x1D719} & -42\unicode[STIX]{x1D702}\cos 2\unicode[STIX]{x1D719} & 0\\ -42\unicode[STIX]{x1D702}\cos 2\unicode[STIX]{x1D719} & 70+9\unicode[STIX]{x1D702}^{2}+42\unicode[STIX]{x1D706}^{2}-42\unicode[STIX]{x1D702}\sin 2\unicode[STIX]{x1D719} & 0\\ 0 & 0 & 70+3\unicode[STIX]{x1D702}^{2}-84\unicode[STIX]{x1D706}^{2}\end{array}\right]\nonumber\\ \displaystyle & & \displaystyle \left.+\,4\left[\begin{array}{@{}ccc@{}}\unicode[STIX]{x1D702}^{2}+21\unicode[STIX]{x1D706}^{2}+21\unicode[STIX]{x1D702}\sin 2\unicode[STIX]{x1D719} & -21\unicode[STIX]{x1D702}\cos 2\unicode[STIX]{x1D719} & 0\\ -21\unicode[STIX]{x1D702}\cos 2\unicode[STIX]{x1D719} & \unicode[STIX]{x1D702}^{2}+21\unicode[STIX]{x1D706}^{2}-21\unicode[STIX]{x1D702}\sin 2\unicode[STIX]{x1D719} & 0\\ 0 & 0 & -2(\unicode[STIX]{x1D702}^{2}+21\unicode[STIX]{x1D706}^{2})\end{array}\right]\right\},\end{eqnarray}$$
which is a function of
 $\unicode[STIX]{x1D708}$
,
 $e$
,
 $T$
,
 $\unicode[STIX]{x1D702}$
,
 $\unicode[STIX]{x1D719}$
and
 $\unicode[STIX]{x1D706}^{2}$
. In the final expression (2.25), we have retained terms that are up to second order in
 $\unicode[STIX]{x1D702}$
,
 $\sin \unicode[STIX]{x1D719}$
and
 $\unicode[STIX]{x1D706}$
– we shall show in the end that this is sufficient to yield accurate predictions of the transport coefficients of a sheared dilute suspension for a wide range of (i) restitution coefficient
 $e$
and (ii) Stokes number
 $St$
.
2.2 Analysis in the quenched state
Tsao & Koch (Reference Tsao and Koch1995) envisaged a scenario of a dilute gas–solid suspension in which the particle inertia is very low such that the particles tend to align with fluid streamlines after a collision. Most of the particles will be having their individual velocity equal to the fluid velocity
 $(\boldsymbol{c}\approx \boldsymbol{u})$
which implies that the peculiar velocity
 $\boldsymbol{C}\approx 0$
and therefore the particle agitation is very small (
 $T/\dot{\unicode[STIX]{x1D6FE}}\unicode[STIX]{x1D70E}\ll 1$
) – this is dubbed the quenched state. The collisions in this state are mainly shear induced with some occasional variance-driven collisions and the particles relax back to the local fluid velocity after such a collision before they encounter a second collision and therefore the viscous relaxation time is much smaller than the collision time
 $\unicode[STIX]{x1D70F}_{v}\ll \unicode[STIX]{x1D70F}_{c}$
.
In the present work, the velocity distribution function of the quenched state is taken to be a delta function (Tsao & Koch Reference Tsao and Koch1995)
 $$\begin{eqnarray}f(\boldsymbol{C})=n\unicode[STIX]{x1D6FF}(\boldsymbol{C}),\end{eqnarray}$$
which is a solution of the Boltzmann equation. The relative velocity between two colliding particles in the quenched state can be approximated as
 $\boldsymbol{g}=\boldsymbol{c}_{1}-\boldsymbol{c}_{2}\approx \boldsymbol{u}_{1}-\boldsymbol{u}_{2}\equiv \unicode[STIX]{x1D6FF}\boldsymbol{u}=-\dot{\unicode[STIX]{x1D6FE}}\unicode[STIX]{x1D70E}k_{y}\boldsymbol{e}_{x}$
(where
 $\boldsymbol{e}_{i}$
is the unit vector along
 $i$
th direction), and therefore
 $\boldsymbol{g}\boldsymbol{\cdot }\boldsymbol{k}\approx \unicode[STIX]{x1D6FF}\boldsymbol{u}\boldsymbol{\cdot }\boldsymbol{k}=-\dot{\unicode[STIX]{x1D6FE}}\unicode[STIX]{x1D70E}k_{x}k_{y}$
. Plugging the latter information into (B9) (see appendix B), the resulting collisional production term can be evaluated, by using (2.26), as
 $$\begin{eqnarray}\displaystyle \aleph _{\unicode[STIX]{x1D6FC}\unicode[STIX]{x1D6FD}}^{qs} & {\approx} & \displaystyle \frac{m}{4}\unicode[STIX]{x1D70E}^{2}(1+e)^{2}\int _{\unicode[STIX]{x1D6FF}\boldsymbol{u}\boldsymbol{\cdot }\boldsymbol{k}>0}(\unicode[STIX]{x1D6FF}\boldsymbol{u}\boldsymbol{\cdot }\boldsymbol{k})^{3}k_{\unicode[STIX]{x1D6FC}}k_{\unicode[STIX]{x1D6FD}}\,\text{d}\boldsymbol{k}\int f(\boldsymbol{C}_{1})f(\boldsymbol{C}_{2})\,\text{d}\boldsymbol{C}_{1}\text{d}\boldsymbol{C}_{2}\nonumber\\ \displaystyle & = & \displaystyle -\frac{m}{4}\unicode[STIX]{x1D70E}^{2}(1+e)^{2}\dot{\unicode[STIX]{x1D6FE}}^{3}\unicode[STIX]{x1D70E}^{3}n^{2}\int _{k_{x}k_{y}<0}(k_{x}k_{y})^{3}k_{\unicode[STIX]{x1D6FC}}k_{\unicode[STIX]{x1D6FD}}\,\text{d}\boldsymbol{k},\nonumber\\ \displaystyle & = & \displaystyle \unicode[STIX]{x1D70C}_{p}\dot{\unicode[STIX]{x1D6FE}}^{3}\unicode[STIX]{x1D70E}^{2}\frac{(1+e)^{2}\unicode[STIX]{x1D708}^{2}}{16}\left[\begin{array}{@{}ccc@{}}{\displaystyle \frac{512}{315\unicode[STIX]{x03C0}}} & -{\displaystyle \frac{16}{35}} & 0\\ -{\displaystyle \frac{16}{35}} & {\displaystyle \frac{512}{315\unicode[STIX]{x03C0}}} & 0\\ 0 & 0 & {\displaystyle \frac{128}{315\unicode[STIX]{x03C0}}}\end{array}\right].\end{eqnarray}$$
Note that the final expression (2.27) for
 $e=1$
differs from that of Tsao & Koch (Reference Tsao and Koch1995) by a numerical factor
 $2$
which was also noted previously (Parmentier & Simonin Reference Parmentier and Simonin2012).
The analyses of Tsao & Koch (Reference Tsao and Koch1995) suggest that the velocity distribution function in the quenched state is indeed very different from the Maxwellian, with a power-law decay of its high-velocity tails. They also carried out Monte Carlo simulations of gas–solid suspensions which confirmed delta-function-like peaked structures for the distribution function at small values of the Stokes number: the width of the distribution is found to decay with decreasing volume fraction, with the high-velocity tails of its marginal distributions behaving like
 $f_{x}=\iint f\,\text{d}C_{y}\,\text{d}C_{z}\sim C_{x}^{-0.91}$
and
 $f_{y}=\iint f\,\text{d}C_{x}\,\text{d}C_{z}\sim C_{y}^{-1.03}$
. In a related work, Kumaran, Tsao & Koch (Reference Kumaran, Tsao and Koch1993) analysed the properties of a bidisperse settling suspension by assuming a composite distribution function, having non-zero skewness; However, it is worth noting that the ‘non-zero’ skewness of the distribution function is unlikely to influence the present analysis since skewness affects only the odd moments (like heat flux, etc.) of the distribution function and the divergence of the heat flux (in the second-moment balance) vanishes in uniform shear flow. In any case, the possible impact of other forms of composite distribution function having properties of both the ignited and quenched states on the ignited–quenched transition of a sheared suspension can be assessed a future work.
2.3 Second-moment balance combining quenched and ignited states
Combining the ignited and quenched states, the second-order moment balance equation (2.10) for a ‘dilute’ gas–solid suspension undergoing USF is
 $$\begin{eqnarray}P_{\unicode[STIX]{x1D6FF}\unicode[STIX]{x1D6FD}}u_{\unicode[STIX]{x1D6FC},\unicode[STIX]{x1D6FF}}+P_{\unicode[STIX]{x1D6FF}\unicode[STIX]{x1D6FC}}u_{\unicode[STIX]{x1D6FD},\unicode[STIX]{x1D6FF}}+\frac{2\dot{\unicode[STIX]{x1D6FE}}}{St}P_{\unicode[STIX]{x1D6FC}\unicode[STIX]{x1D6FD}}=\aleph _{\unicode[STIX]{x1D6FC}\unicode[STIX]{x1D6FD}}\equiv \aleph _{\unicode[STIX]{x1D6FC}\unicode[STIX]{x1D6FD}}^{qs}+\aleph _{\unicode[STIX]{x1D6FC}\unicode[STIX]{x1D6FD}}^{is},\end{eqnarray}$$
where the superscripts
 $qs$
and
 $is$
stand for the source of second moment in quenched and ignited states, respectively. Following (2.20), the expression for the stress tensor can be written as
 $$\begin{eqnarray}\unicode[STIX]{x1D64B}=\unicode[STIX]{x1D70C}\unicode[STIX]{x1D648}=\unicode[STIX]{x1D70C}_{p}\unicode[STIX]{x1D708}T\left[\begin{array}{@{}ccc@{}}1+\unicode[STIX]{x1D706}^{2}+\unicode[STIX]{x1D702}\sin 2\unicode[STIX]{x1D719} & -\unicode[STIX]{x1D702}\cos 2\unicode[STIX]{x1D719} & 0\\ -\unicode[STIX]{x1D702}\cos 2\unicode[STIX]{x1D719} & 1+\unicode[STIX]{x1D706}^{2}-\unicode[STIX]{x1D702}\sin 2\unicode[STIX]{x1D719} & 0\\ 0 & 0 & 1-2\unicode[STIX]{x1D706}^{2}\end{array}\right].\end{eqnarray}$$
Substituting (2.25), (2.27) and (2.29) into (2.28), we obtain the following four independent equations:
 $$\begin{eqnarray}\displaystyle \left.\begin{array}{@{}rcl@{}}-2T\unicode[STIX]{x1D702}\cos 2\unicode[STIX]{x1D719}+{\displaystyle \frac{2}{St}}T(1+\unicode[STIX]{x1D706}^{2}+\unicode[STIX]{x1D702}\sin 2\unicode[STIX]{x1D719})\, & =\, & \left[-{\displaystyle \frac{2(1-e^{2})\unicode[STIX]{x1D708}T^{3/2}}{35\sqrt{\unicode[STIX]{x03C0}}}}(70+9\unicode[STIX]{x1D702}^{2}+42\unicode[STIX]{x1D706}^{2}+42\unicode[STIX]{x1D702}\sin 2\unicode[STIX]{x1D719})\right.\\ \, & \, & \left.-\,{\displaystyle \frac{8(1+e)\unicode[STIX]{x1D708}T^{3/2}}{35\sqrt{\unicode[STIX]{x03C0}}}}(\unicode[STIX]{x1D702}^{2}+21\unicode[STIX]{x1D706}^{2}+21\unicode[STIX]{x1D702}\sin 2\unicode[STIX]{x1D719})\right]\\ \, & \, & +\left[{\displaystyle \frac{128(1+e)^{2}\unicode[STIX]{x1D708}}{315\unicode[STIX]{x03C0}}}\right]\\ {\displaystyle \frac{2}{St}}T(1+\unicode[STIX]{x1D706}^{2}-\unicode[STIX]{x1D702}\sin 2\unicode[STIX]{x1D719})\, & =\, & \left[-{\displaystyle \frac{2(1-e^{2})\unicode[STIX]{x1D708}T^{3/2}}{35\sqrt{\unicode[STIX]{x03C0}}}}(70+9\unicode[STIX]{x1D702}^{2}+42\unicode[STIX]{x1D706}^{2}-42\unicode[STIX]{x1D702}\sin 2\unicode[STIX]{x1D719})\right.\\ \, & \, & \left.-\,{\displaystyle \frac{8(1+e)\unicode[STIX]{x1D708}T^{3/2}}{35\sqrt{\unicode[STIX]{x03C0}}}}(\unicode[STIX]{x1D702}^{2}+21\unicode[STIX]{x1D706}^{2}-21\unicode[STIX]{x1D702}\sin 2\unicode[STIX]{x1D719})\right]\\ \, & \, & +\left[{\displaystyle \frac{128(1+e)^{2}\unicode[STIX]{x1D708}}{315\unicode[STIX]{x03C0}}}\right]\\ {\displaystyle \frac{2}{St}}T(1-2\unicode[STIX]{x1D706}^{2})\, & =\, & \left[-{\displaystyle \frac{2(1-e^{2})\unicode[STIX]{x1D708}T^{3/2}}{35\sqrt{\unicode[STIX]{x03C0}}}}(70+3\unicode[STIX]{x1D702}^{2}-84\unicode[STIX]{x1D706}^{2})\right.\\ \, & \, & \left.+{\displaystyle \frac{16(1+e)\unicode[STIX]{x1D708}T^{3/2}}{35\sqrt{\unicode[STIX]{x03C0}}}}(\unicode[STIX]{x1D702}^{2}+21\unicode[STIX]{x1D706}^{2})\right]+\left[{\displaystyle \frac{32(1+e)^{2}\unicode[STIX]{x1D708}}{315\unicode[STIX]{x03C0}}}\right]\\ T(1+\unicode[STIX]{x1D706}^{2}-\unicode[STIX]{x1D702}\sin 2\unicode[STIX]{x1D719})-{\displaystyle \frac{2}{St}}T\unicode[STIX]{x1D702}\cos 2\unicode[STIX]{x1D719}\, & =\, & \left[{\displaystyle \frac{12(1-e)(3-e)\unicode[STIX]{x1D708}T^{3/2}}{5\sqrt{\unicode[STIX]{x03C0}}}}\unicode[STIX]{x1D702}\cos 2\unicode[STIX]{x1D719}\right]-\left[{\displaystyle \frac{4(1+e)^{2}\unicode[STIX]{x1D708}}{35}}\right].\end{array}\right\} & & \displaystyle \nonumber\\ \displaystyle & & \displaystyle\end{eqnarray}$$
Note that the terms involving the Stokes number (
 $St$
) on the left-hand sides of (2.30) vanish in the limit of
 $St\rightarrow \infty$
; in addition, removing the contributions of the quenched state (the last term on the right-hand side of each equation above), equation (2.30) degenerates into the second-moment balance for the shear flow of a ‘dry’ granular gas (Saha & Alam Reference Saha and Alam2016a
).
In (2.30), we have made temperature dimensionless via
 $T=T/(\dot{\unicode[STIX]{x1D6FE}}\unicode[STIX]{x1D70E}/2)^{2}$
. The coupled system of equations (2.30) must be solved to determine
 $\unicode[STIX]{x1D702}$
,
 $\unicode[STIX]{x1D706}$
,
 $\unicode[STIX]{x1D719}$
and
 $T$
for specified values of (i) particle volume fraction (
 $\unicode[STIX]{x1D708}$
), (ii) Stokes number (
 $St$
) and (iii) restitution coefficient (
 $e$
). Analytical progress can be made to solve (2.30) as discussed in §§ 3 and 4.
Before proceeding further, it may be noted that the analysis of the second-moment balance (2.28) or (2.30) in the ignited state (i.e. with
 $\aleph _{\unicode[STIX]{x1D6FC}\unicode[STIX]{x1D6FD}}^{qs}=0$
) is considerably simplified for elastically colliding (
 $e=1$
) particles, see appendix C. The related analytical results on the temperature field provide a lower bound on the Stokes number for the existence of the ignited state (and consequently on the multiple states and hysteresis, § 3.2) in a dilute gas–solid suspension.
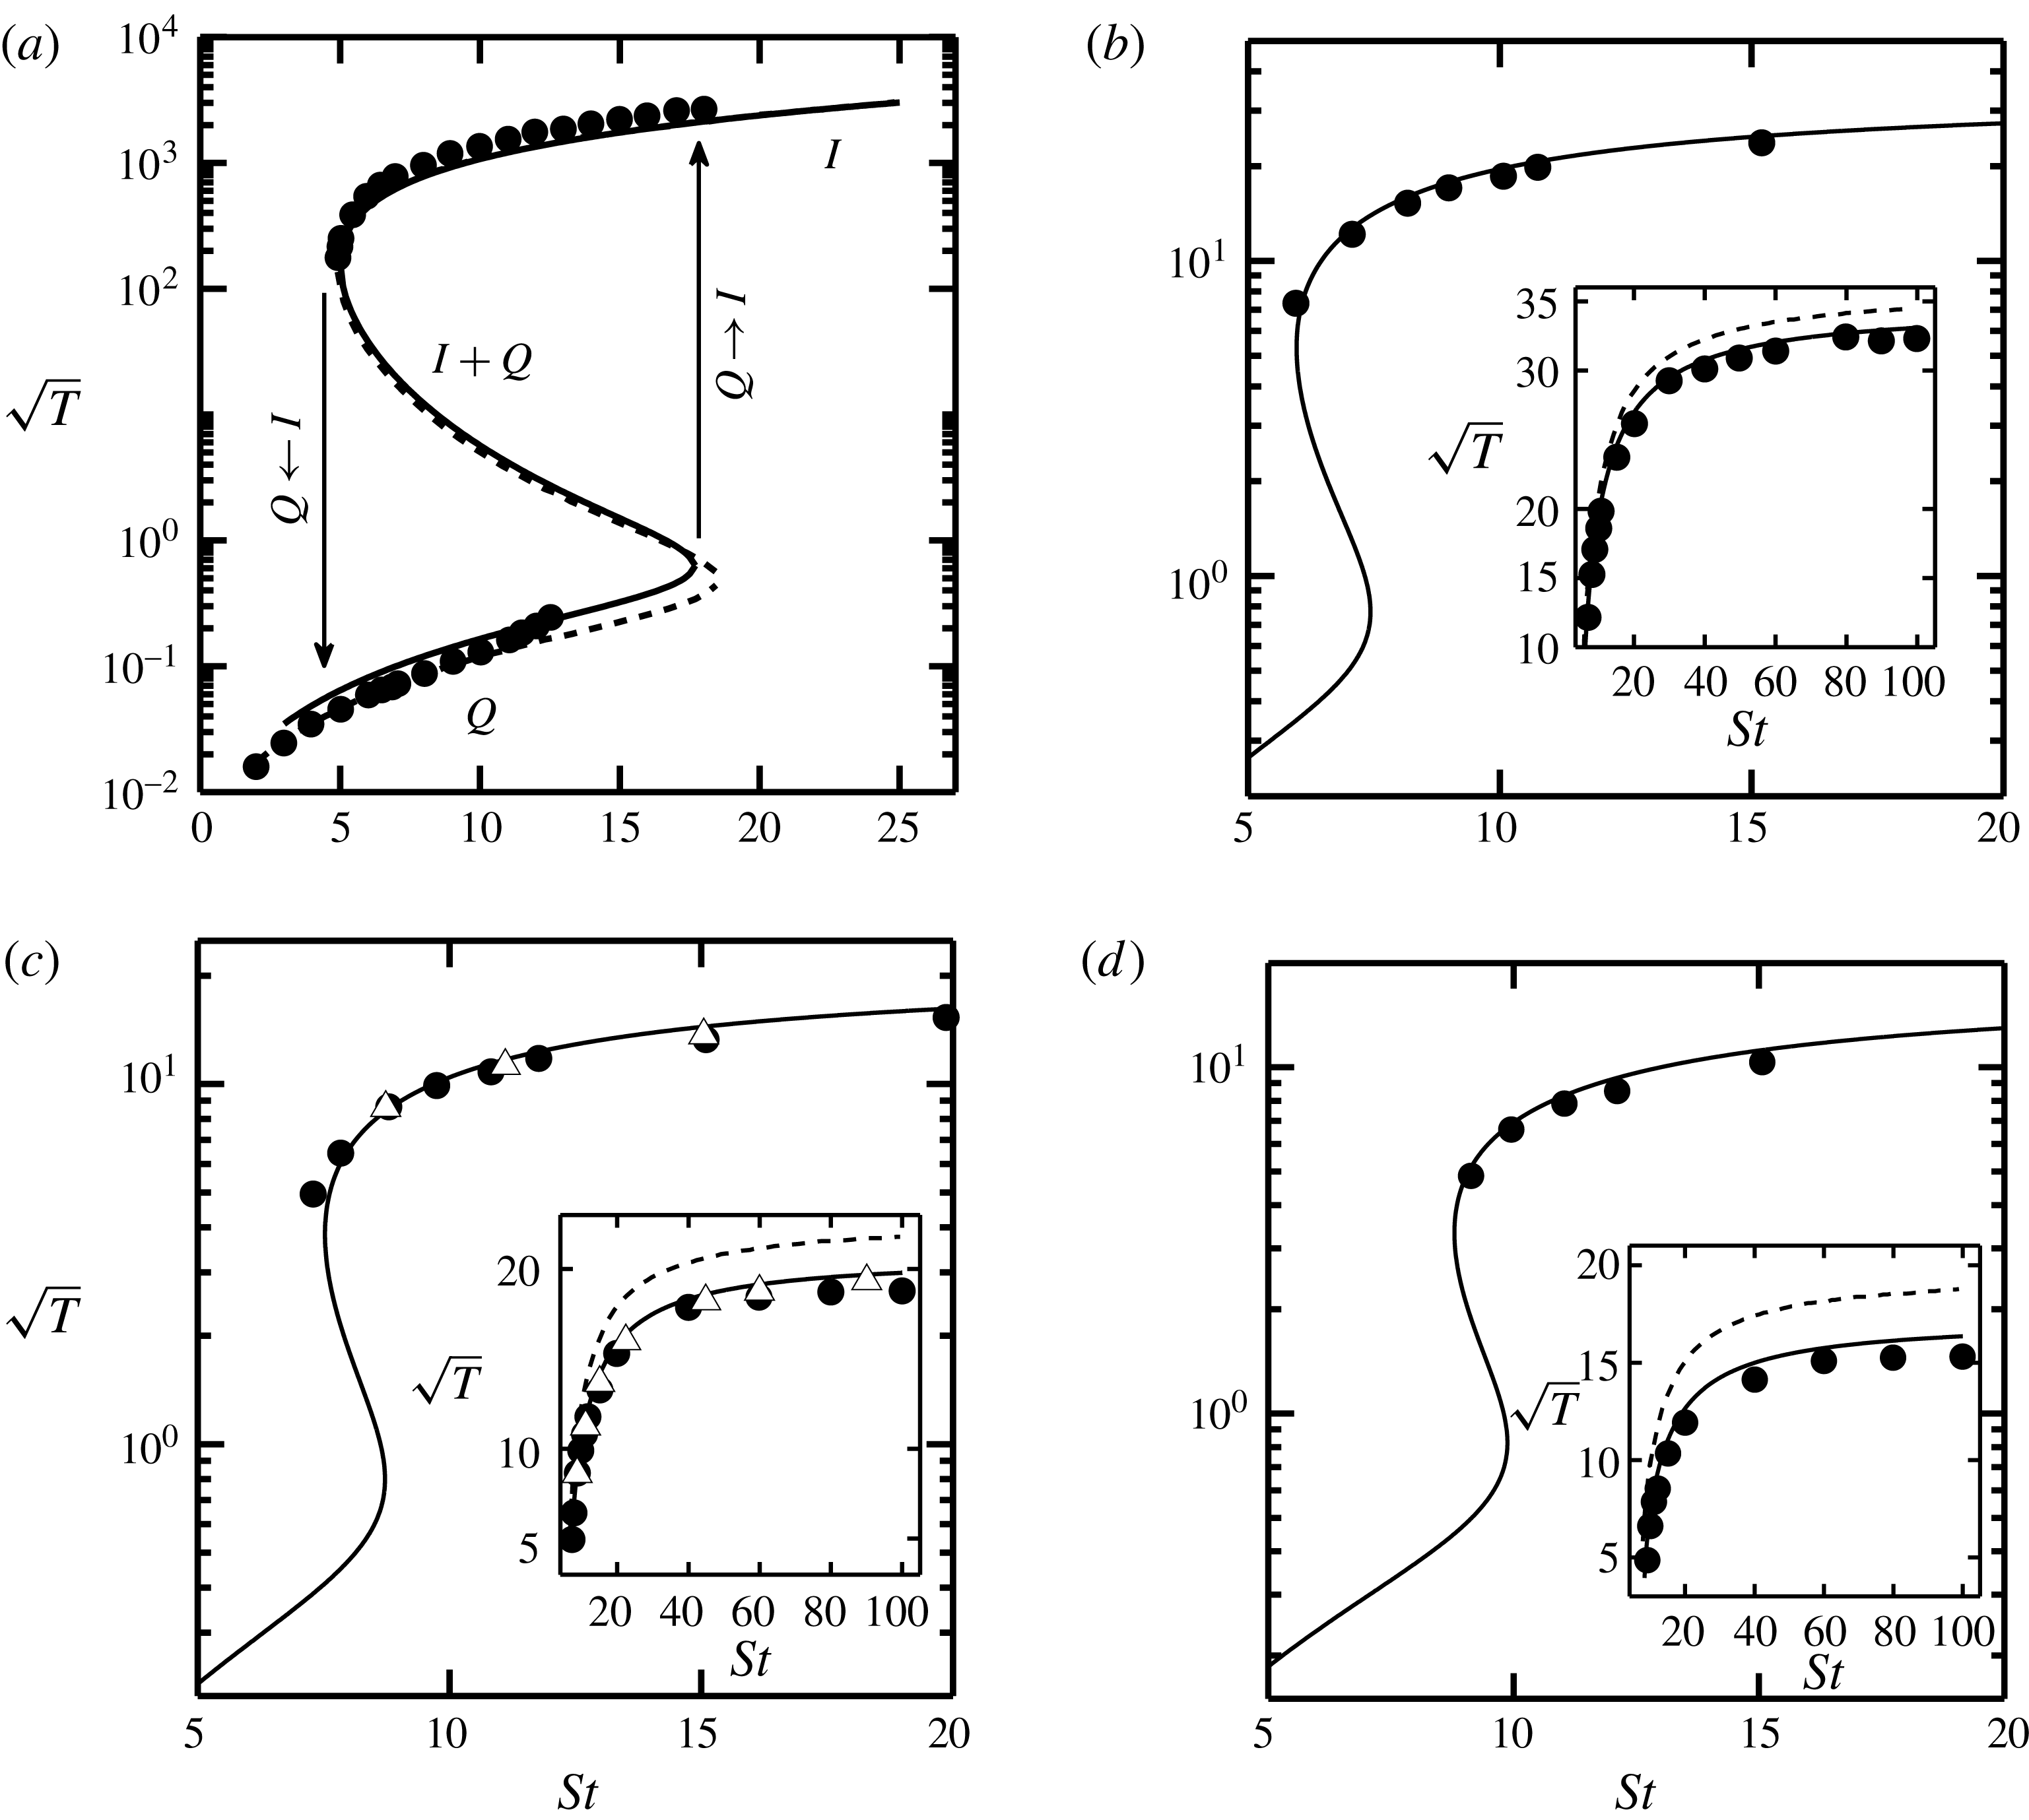
Hysteretic/first-order transitions of granular temperature for (a)
 $e=1$
and
 $\unicode[STIX]{x1D708}=5\times 10^{-4}$
; (b)
 $e=0.8$
, (c)
 $e=0.5$
and (d)
 $e=0.3$
with
 $\unicode[STIX]{x1D708}=0.01$
. The solid and dashed (inset) lines denote the present anisotropic-Maxwellian theory and the Maxwellian theory (Tsao & Koch Reference Tsao and Koch1995; Sangani et al.
Reference Sangani, Mo, Tsao and Koch1996), respectively. The filled circles represent the DSMC data of Sangani et al. (Reference Sangani, Mo, Tsao and Koch1996); the open triangles in (c) denote the DSMC data of Chamorro et al. (Reference Chamorro, Reyes and Garzo2015). In each main panel, the black solid lines represent numerical solutions of (3.1); the intermediate branch [with
 $\text{d}T/\text{d}(St)<0$
] in each panel represent an unstable solution, see discussion in § 4.2.2.

3 Granular temperature: multi-stability and ignited-to-quenched state transitions
After some tedious algebra, we found that (2.30) can be decoupled to yield a tenth degree polynomial for granular temperature
 $\unicode[STIX]{x1D709}=\sqrt{T}$
:
 $$\begin{eqnarray}{\mathcal{G}}(\unicode[STIX]{x1D709})\equiv a_{10}\unicode[STIX]{x1D709}^{10}+a_{9}\unicode[STIX]{x1D709}^{9}+a_{8}\unicode[STIX]{x1D709}^{8}+a_{7}\unicode[STIX]{x1D709}^{7}+a_{6}\unicode[STIX]{x1D709}^{6}+a_{5}\unicode[STIX]{x1D709}^{5}+a_{4}\unicode[STIX]{x1D709}^{4}+a_{3}\unicode[STIX]{x1D709}^{3}+a_{2}\unicode[STIX]{x1D709}^{2}+a_{1}\unicode[STIX]{x1D709}+a_{0}=0,\end{eqnarray}$$
the explicit expressions of the coefficients
 $a_{i}$
are given in appendix D (supplementary materials). It is straightforward to verify that for the case of elastically colliding particles (
 $e=1$
),
 $a_{10}=0=a_{9}=a_{8}$
and hence (3.1) reduces to a polynomial of seventh degree; in fact these three roots vaporize to
 $-\infty$
at
 $e=1$
and remain negative for
 $e<1$
and hence unphysical. It has been verified numerically (as well as via an ordering analysis, see appendix E in supplementary materials) that at most three roots of (3.1) are real positive, depending on the values of
 $\unicode[STIX]{x1D708}$
,
 $St$
and
 $e$
, and the remaining roots are negative and/or complex.
3.1 Validation of present anisotropic-Maxwellian theory
We solve the temperature equation (3.1) numerically and compare it with simulation data in order to validate the present theory.
Figure 2(a–d) shows the variations of the granular temperature with Stokes number
 $(St)$
at particle volume fractions of (a)
 $\unicode[STIX]{x1D708}=5\times 10^{-4}$
and (b–d)
 $\unicode[STIX]{x1D708}=0.01$
, with different values of the restitution coefficient (a)
 $e=1$
, (b)
 $e=0.8$
, (c)
 $e=0.5$
and
 $e=0.3$
. In each panel and inset, the symbols represent the DSMC data of Sangani et al. (Reference Sangani, Mo, Tsao and Koch1996) which are compared with the (i) present anisotropic-Maxwellian theory (solid line) and (ii) the standard moment expansion (dashed line) of Tsao & Koch (Reference Tsao and Koch1995, for
 $e=1$
) and Sangani et al. (Reference Sangani, Mo, Tsao and Koch1996, for
 $e\neq 1$
). Figure 2(a) indicates that for the case of elastically colliding particles, the present theory is on par with Tsao–Koch theory. On the other hand, for inelastic particles (
 $e<1$
), the insets of figure 2(b–d) confirm that the present theory is able to better predict the temperature variation with
 $St$
; however, the agreement with Tsao–Koch theory worsens with increasing dissipation. In panel (c), the recent DSMC data (open triangles) of Chamorro et al. (Reference Chamorro, Reyes and Garzo2015) for
 $e=0.5$
also agree quantitatively with the present theory.
Overall, the moment theory with an anisotropic Maxwellian as the leading term seems better suited for a dilute gas–solid suspension of inelastic particles undergoing shear flow for a large range of
 $e<1$
at small and moderate values of the Stokes number. It may be noted that a similar analysis (Saha & Alam Reference Saha and Alam2014, Reference Saha and Alam2016a
) for a sheared granular gas (
 $St\rightarrow \infty$
) provides excellent predictions for temperature and rheological quantities for highly dissipative particles. The same conclusions seem to carry over to the limit of small Stokes numbers of a sheared gas–solid suspension too, and this issue is further discussed in §§ 4 and 5 (with respect to predictions for viscosity and normal-stress differences).
3.2 Asymptotic solution for three temperatures: hysteresis and multi-stability
Returning to figure 2, we note that the temperature is a multi-valued function of Stokes number for a range of
 $St$
over which there are three possible solutions; there are hysteretic/discontinuous jumps in temperature from the low/high temperature branches with increasing/decreasing
 $St$
. For a better understanding of this hysteresis phenomenon, equation (3.1) has been solved in the asymptotic limit
 $\unicode[STIX]{x1D708}\ll 1$
,
 $St\gg 1$
, and
 $St^{3}\unicode[STIX]{x1D708}\ll 1$
via an ordering analysis, the details of which are given in appendices E.1–E.3 (supplementary materials). Three real solutions have been found,
 $$\begin{eqnarray}\displaystyle & \displaystyle \sqrt{T_{is}}={\displaystyle \frac{5(1+e)^{-1}(1691+539e-1223e^{2}+337e^{3})\sqrt{\unicode[STIX]{x03C0}}}{48(3-e)(12607-19952e+10099e^{2}-1746e^{3})}}\left(\frac{St}{\unicode[STIX]{x1D708}}\right)\stackrel{e=1}{\equiv }\frac{5\sqrt{\unicode[STIX]{x03C0}}}{144}\frac{St}{\unicode[STIX]{x1D708}}, & \displaystyle\end{eqnarray}$$
 $$\begin{eqnarray}\displaystyle & \displaystyle \sqrt{T_{qs}}=\sqrt{{\displaystyle \frac{32(1+e)^{2}}{945\unicode[STIX]{x03C0}}}}St^{3/2}\unicode[STIX]{x1D708}^{1/2}\stackrel{e=1}{\equiv }\frac{8\sqrt{2}}{3\sqrt{105\unicode[STIX]{x03C0}}}St^{3/2}\unicode[STIX]{x1D708}^{1/2}, & \displaystyle\end{eqnarray}$$
 $$\begin{eqnarray}\displaystyle & \displaystyle \sqrt{T_{us}}=\frac{840\sqrt{\unicode[STIX]{x03C0}}}{(1+e)(107+193e)}\left(\frac{1}{St^{3}\unicode[STIX]{x1D708}}\right)\stackrel{e=1}{\equiv }\frac{7\sqrt{\unicode[STIX]{x03C0}}}{5}\left(\frac{1}{St^{3}\unicode[STIX]{x1D708}}\right), & \displaystyle\end{eqnarray}$$
which correspond to the temperatures in the ignited (
 $T_{is}$
), quenched (
 $T_{qs}$
) and unstable (
 $T_{us}$
) states, respectively. These three solutions (3.2)–(3.4) can be identified in figure 2 as the high-, low- and intermediate-temperature branches, respectively; the intermediate solution branch in each panel of figure 2 (with
 $\text{d}T/\text{d}(St)<0$
) represents
 $T_{us}$
which is of course unstable from a stability viewpoint (see § 4.2.2 for related discussion). It must be noted that the analysis in appendices E.1–E.3 is strictly valid for
 $St^{3}\unicode[STIX]{x1D708}\ll 1$
(i.e. the viscous dissipation remains an order-one quantity relative to inelastic dissipation), and therefore the ignited-state solution in (3.2) should not be extrapolated to
 $St\rightarrow \infty$
for inelastic particles. For a suspension of inelastic (
 $e<1$
) particles in the large shear-rate regime, the shear work is balanced by inelastic dissipation (see appendix E.4), leading to the (dimensional) granular temperature varying quadratically with shear rate and hence
 $T_{is}\equiv \tilde{T}_{is}/(\dot{\unicode[STIX]{x1D6FE}}\unicode[STIX]{x1D70E}/2)^{2}$
is a constant at large
 $St$
as is evident in the insets of figure 2(b–d) (as well as in figure E.1(a) in appendix E). In contrast, for a suspension of hard elastic (
 $e=1$
) particles, the balance between the shear work and viscous dissipation yields the well-known quartic scaling for temperature (
 $\tilde{T}_{is}\sim \dot{\unicode[STIX]{x1D6FE}}^{4}$
) with the shear rate, which is discussed in appendix E.4.
It is clear from (3.2) that
 $T_{is}$
increases with increasing Stokes number
 $St$
, but decreases with increasing particle volume fraction
 $\unicode[STIX]{x1D708}$
. On the other hand, the quenched-state temperature (3.3) increases with increasing
 $St$
and
 $\unicode[STIX]{x1D708}$
, whereas the unstable temperature (3.4) decreases with increasing
 $St$
and
 $\unicode[STIX]{x1D708}$
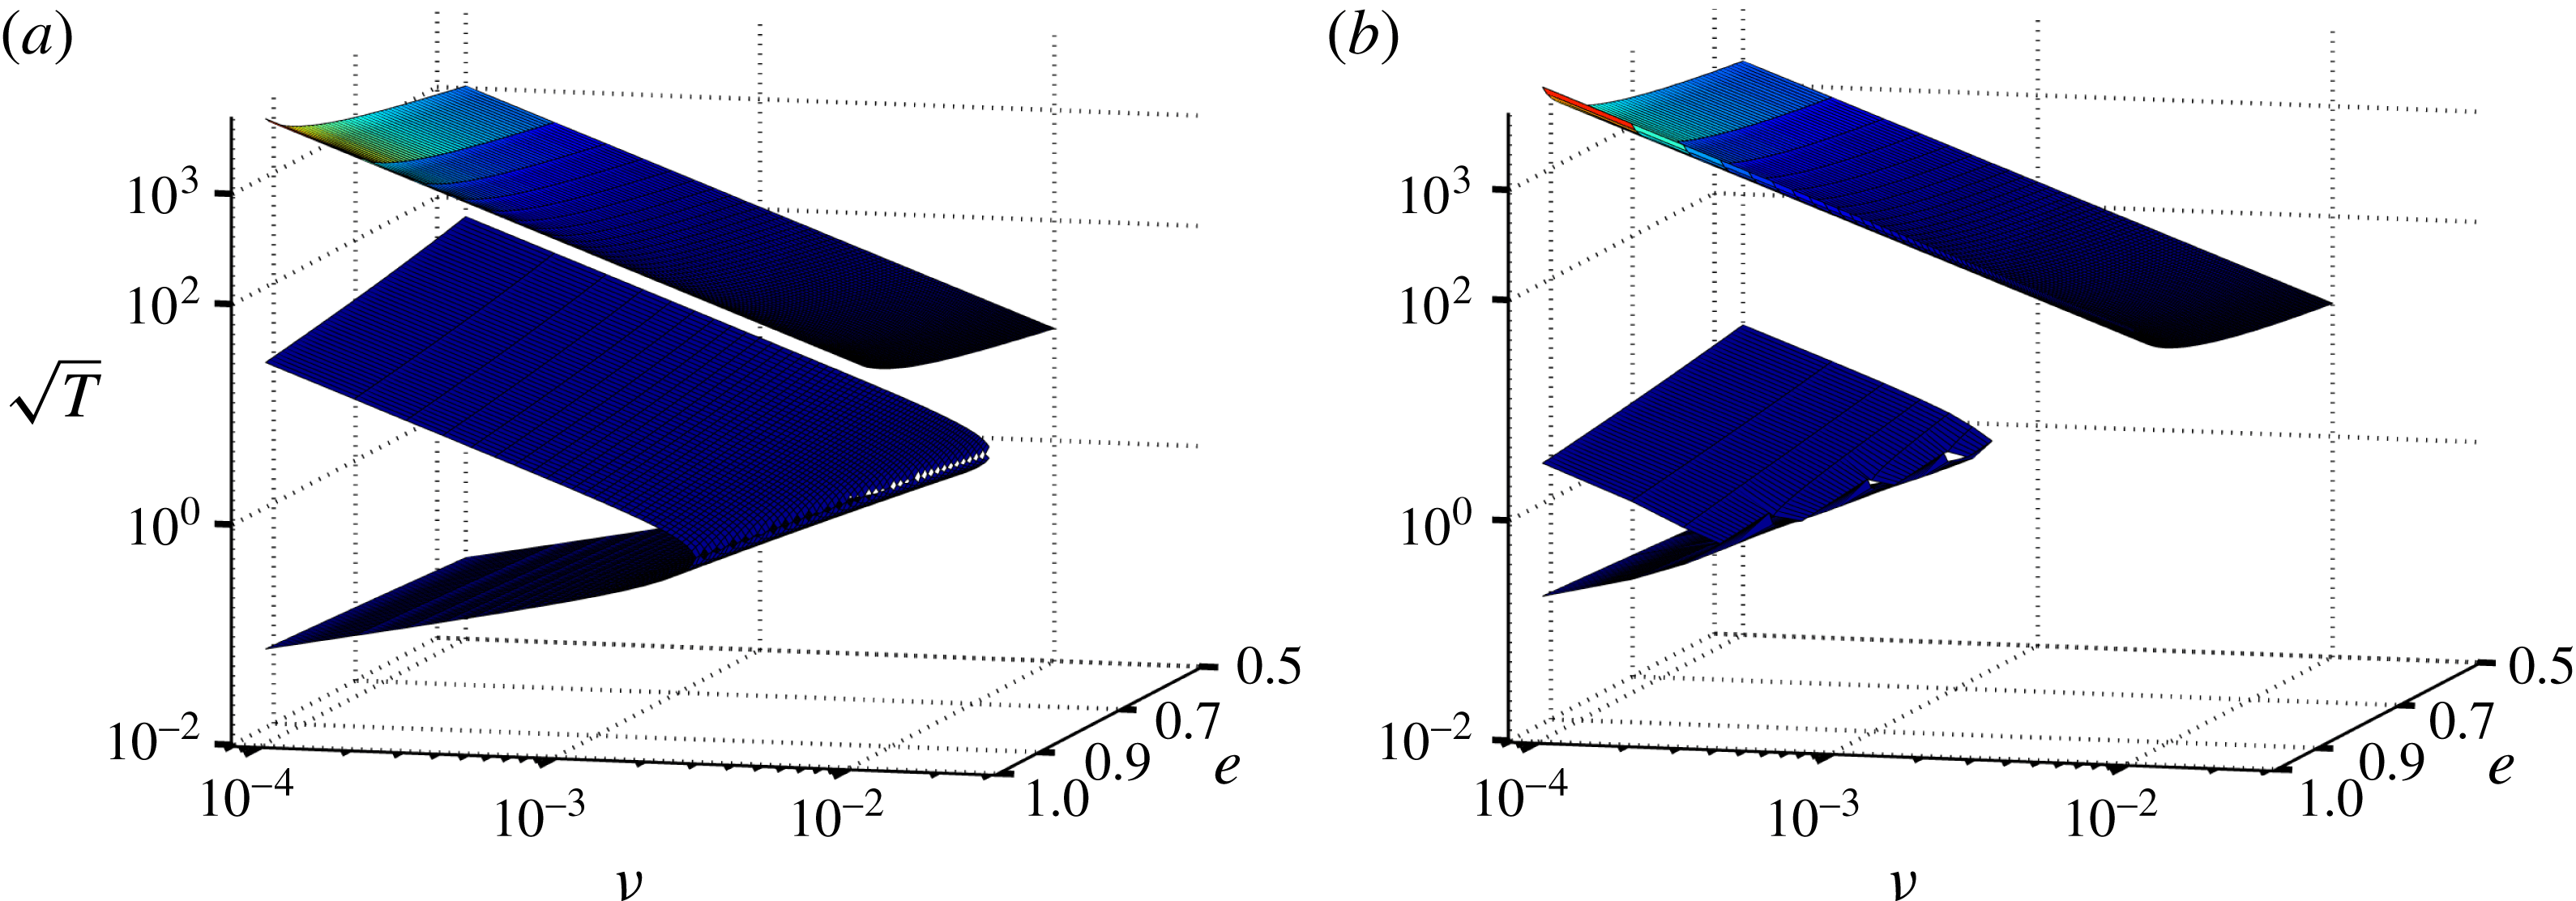
. These overall predictions are verified in figure 3 (see also figure E.1(a) in appendix E) which displays the variations of granular temperature as functions of (
 $\unicode[STIX]{x1D708},e$
) for two values of Stokes number (a)
 $St=10$
and (b)
 $St=20$
. In each panel, the uppermost branch corresponds to the ignited state of high temperature
 $T_{is}$
; the middle and the lowermost planes represent the unstable and quenched states, respectively. The latter two states are connected via a line of turning points, resulting in saddle-node bifurcations (jump transitions) from ‘
 $Q\rightarrow I$
’ with increasing
 $\unicode[STIX]{x1D708}$
, above which the ignited state is the only solution. The critical density
 $\unicode[STIX]{x1D708}=\unicode[STIX]{x1D708}_{c}(St,e)$
for this transition increases with increasing inelasticity but decreases with increasing
 $St$
(see panel b). The corresponding Stokes number for the ‘
 $Q\rightarrow I$
’-transition is denoted by
 $St_{c_{2}}(\unicode[STIX]{x1D708},e)$
which can also be identified with the right limit point in figure 2.
Multiple states of granular temperature as functions of the mean volume fraction
 $\unicode[STIX]{x1D708}$
and restitution coefficient
 $e$
for (a)
 $St=10$
and (b)
 $St=20$
.

A noteworthy feature of figure 3 is that the ignited branch (
 $T\propto \unicode[STIX]{x1D708}^{-2}$
, see (3.2)) is disconnected from the quenched and unstable branches, and therefore there are no jump transitions (on decreasing
 $\unicode[STIX]{x1D708}$
) from
 $I\rightarrow Q$
at
 $St=10$
(a) and 20 (b). However, on further decreasing the Stokes number (below
 $St=10$
), the ignited-state solution disappears below a minimum
 $St$
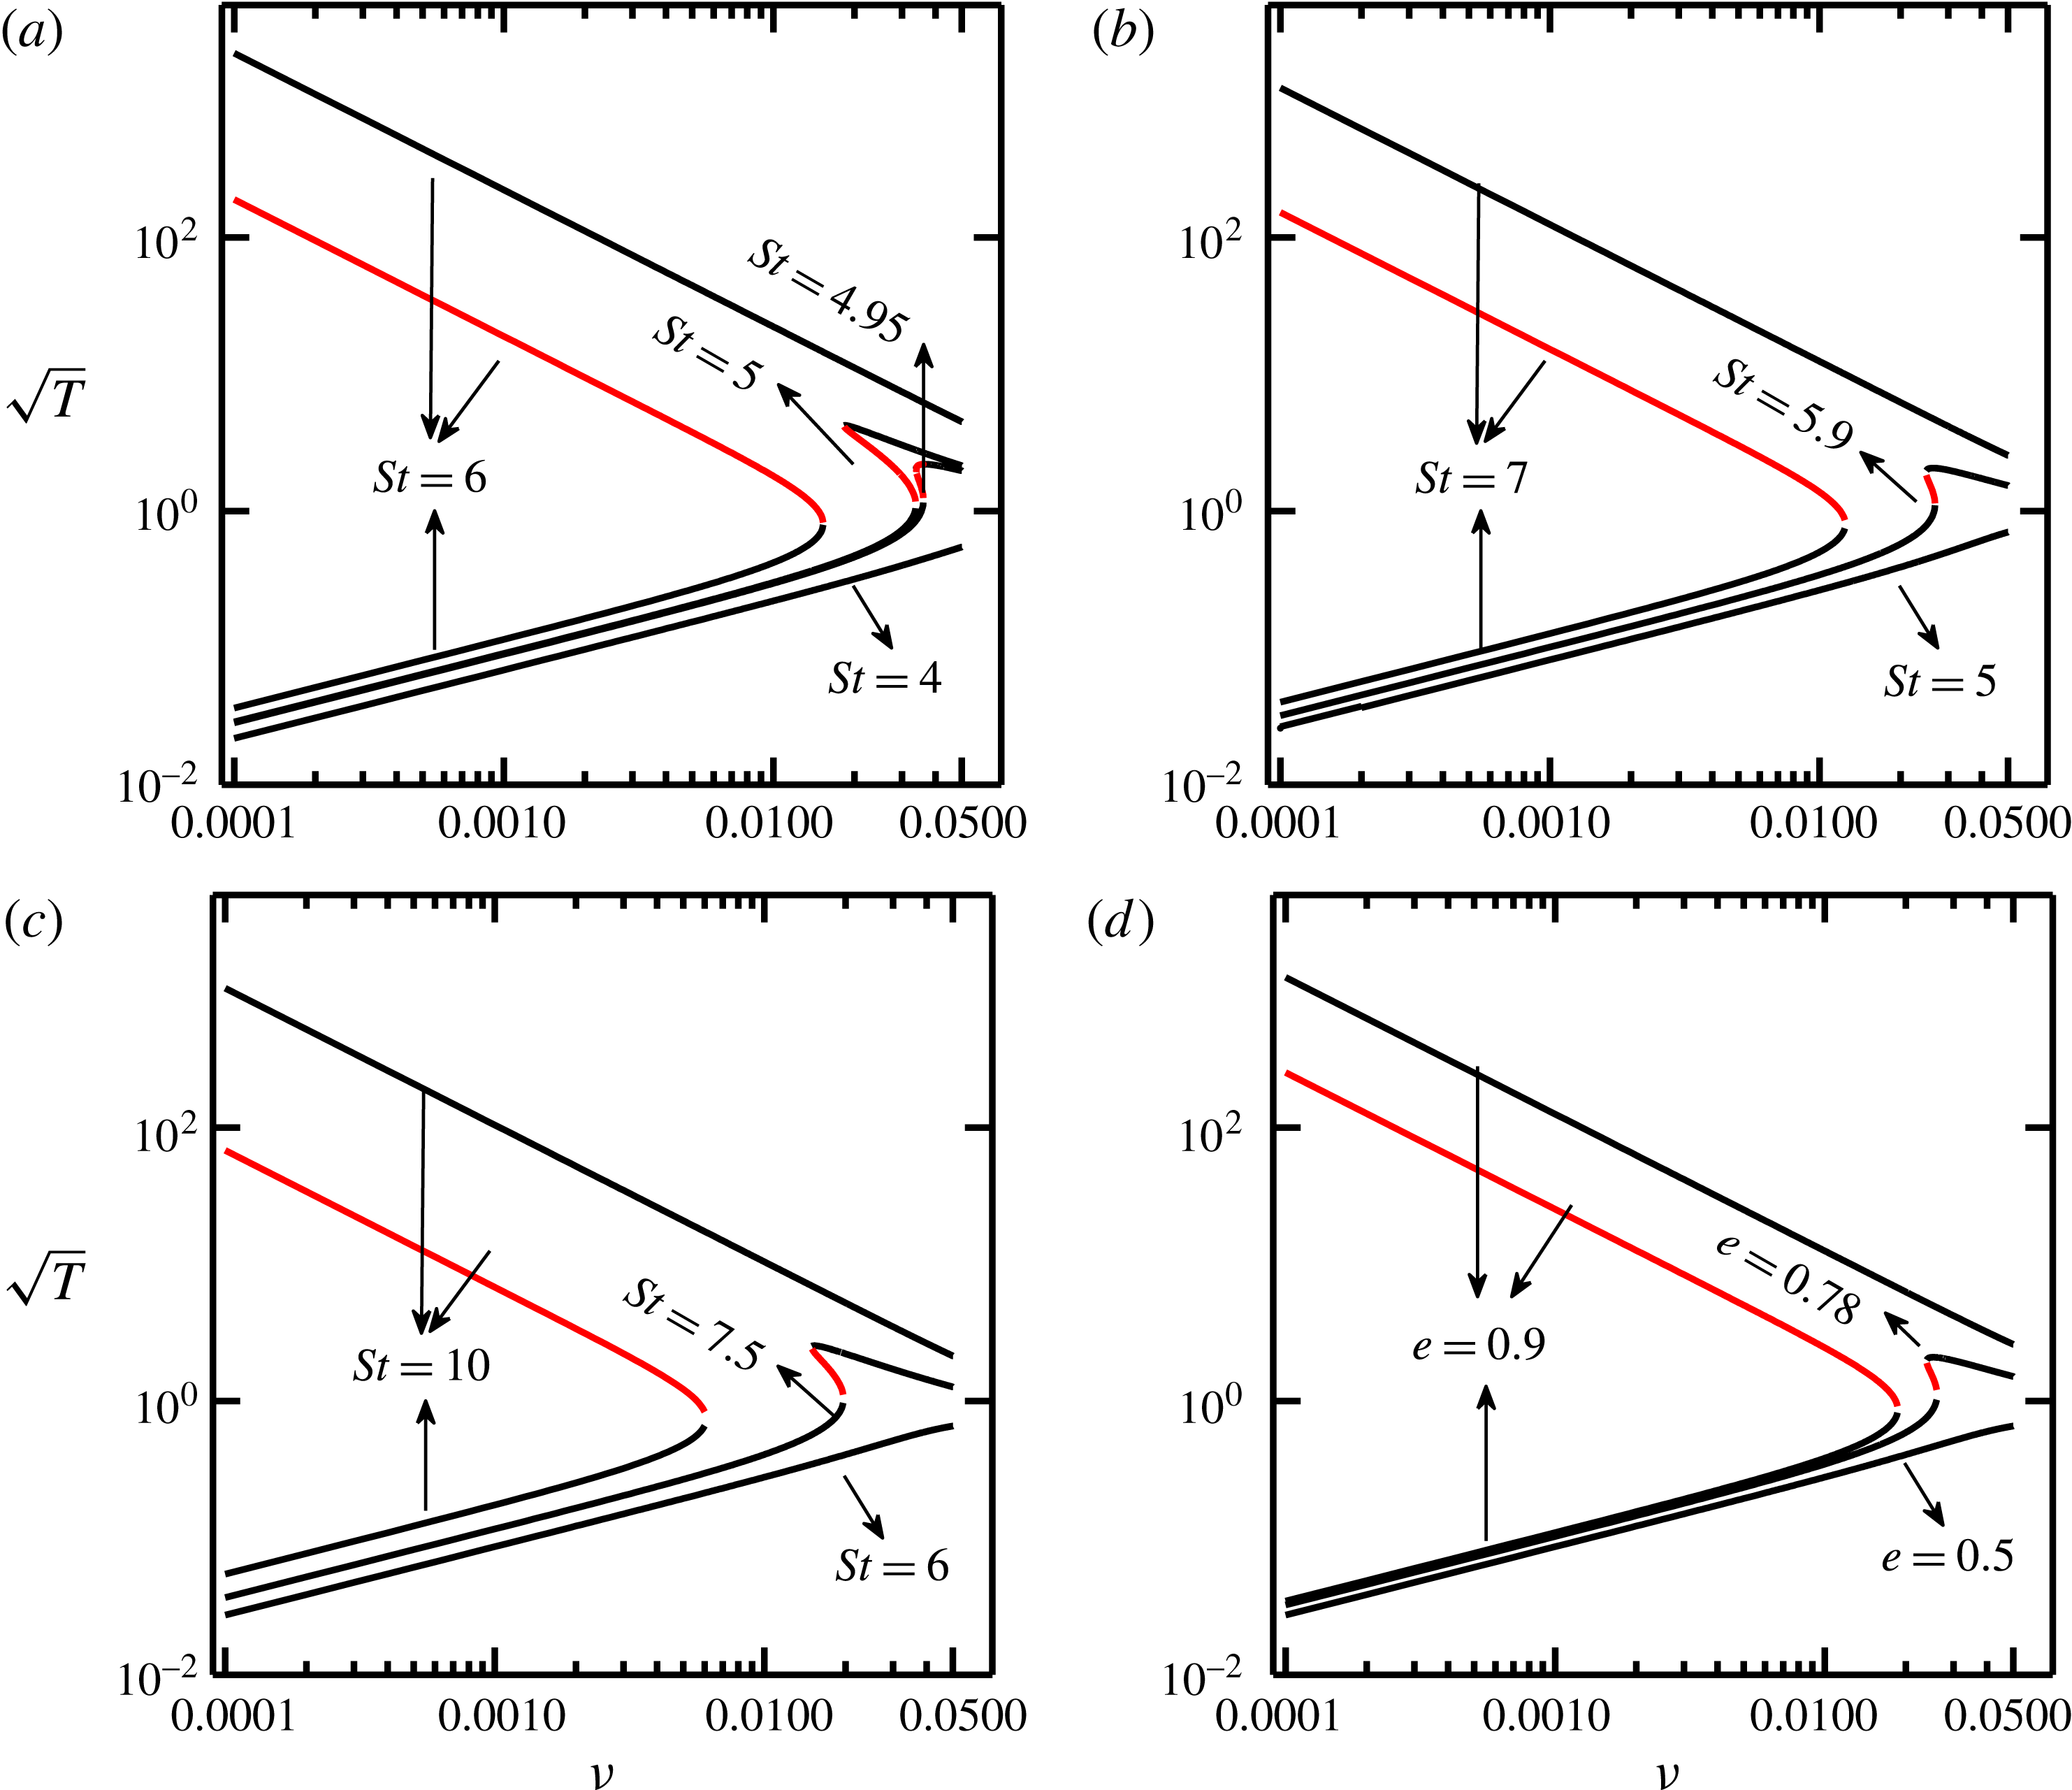
– how this process occurs is explained in figure 4(a–c) for
 $e=1$
, 0.8 and 0.5, respectively. In particular, at any
 $e$
, the unstable branch (red line) and the ignited branch come closer with decreasing
 $St$
and merge with each other at some minimum
 $St$
below which only the quenched-state solution (
 $T\propto \unicode[STIX]{x1D708}$
, see (3.3)) survives. Similarly, by fixing the Stokes number at
 $St=6$
but increasing the inelasticity (decreasing
 $e$
) also results in the disappearance of the ignited-state solution, see figure 4(d). Therefore, the quenched state is the only possible solution below a minimum Stokes number
 $St=St_{c_{1}}(e,\unicode[STIX]{x1D708})$
– this can be identified with the left limit point in figure 2 for ‘
 $I\rightarrow Q$
’ transition.
Disappearance of the ignited-state branch with (a–c) decreasing Stokes number at (a)
 $e=1$
, (b)
 $e=0.8$
and (c)
 $e=0.5$
, and (d) the same with decreasing restitution coefficient at
 $St=6$
.

3.3 Critical Stokes numbers
 $(St_{c_{1}},St_{c_{2}})$
and the master phase diagram

Referring to figure 2, two critical/limit points (at
 $St=St_{c_{1}}$
and
 $St_{c_{2}}$
, with
 $St_{c_{2}}>St_{c_{1}}$
) correspond to the double roots of (3.1) at which the following conditions must be satisfied:
 $$\begin{eqnarray}{\mathcal{G}}(\unicode[STIX]{x1D709}_{c})=0\quad \text{and}\quad {\mathcal{G}}^{\prime }(\unicode[STIX]{x1D709}_{c})=0.\end{eqnarray}$$
This implies that two solution branches, corresponding to two different states ((i) ignited
 $(T_{is})$
, (ii) quenched
 $(T_{qs})$
and (iii) unstable
 $(T_{us})$
) meet at
 $\unicode[STIX]{x1D709}=\unicode[STIX]{x1D709}_{c}$
, leading to saddle-node bifurcations from one stable state to another stable state.
The discontinuous ‘
 $Q\rightarrow I$
’ transition corresponds to a limit point (
 $St=St_{c_{2}}$
, viz. figure 2
a) at which the quenched and unstable solution branches meet. Carrying out the asymptotic analysis of (3.1) with
 $T_{qs}=T_{us}$
and satisfying (3.5) (see appendix F in supplementary materials for details), we obtain the following relation
 $$\begin{eqnarray}St_{c_{2}}^{3}\unicode[STIX]{x1D708}_{c}=\left(\frac{3\,087\,000\unicode[STIX]{x03C0}^{2}}{(1+e)^{4}(107+193e)^{2}}\right)^{1/3},\end{eqnarray}$$
that represents a critical surface in the (
 $\unicode[STIX]{x1D708},St,e$
)-plane, above which only the ignited state exists. Equation (3.6) is depicted in figure 5 as a blue surface. In the elastic limit of
 $e=1$
, equation (3.6) reduces to
 $St_{c_{2}}^{3}\unicode[STIX]{x1D708}_{c}=2.7685$
which differs from the prediction
 $({\approx}3.23)$
of Tsao & Koch (Reference Tsao and Koch1995).
The critical Stokes number,
 $St_{c_{1}}$
, for the ‘
 $I\rightarrow Q$
’ transition (on decreasing
 $St$
) corresponds to the limit point at which
 $T_{is}=T_{us}$
. The asymptotic analysis of (3.1) yields the following expression for
 $St_{c_{1}}$
(see appendix F in supplementary materials):
 $$\begin{eqnarray}St_{c_{1}}\approx 9.9-4.91e,\end{eqnarray}$$
which is marked as a brown-shaded plane in figure 5, to the left of which only the quenched state exists. For elastically colliding particles (
 $e=1$
), we have
 $St_{c_{1}}\approx 4.99$
which is close to our numerical solution of
 $4.94\ldots$
; both are close to the result of
 $\sqrt{169.5/7}\approx 4.92$
obtained by Tsao & Koch (Reference Tsao and Koch1995). Our expression (3.7) should be contrasted with that of Sangani et al. (Reference Sangani, Mo, Tsao and Koch1996):
 $$\begin{eqnarray}St_{c_{1}}\approx 8.7-3.8e,\end{eqnarray}$$
which was derived from standard Grad moment expansion. It is clear that the predictions of critical Stokes numbers based on (3.7) and (3.8) differ substantially with decreasing
 $e$
. In any case, both (3.7) and (3.8) depend only on the restitution coefficient, and therefore the minimum value of Stokes number
 $(St_{c_{1}})$
, below which only the quenched state exists, is independent of the volume fraction for a dilute gas–solid suspension.
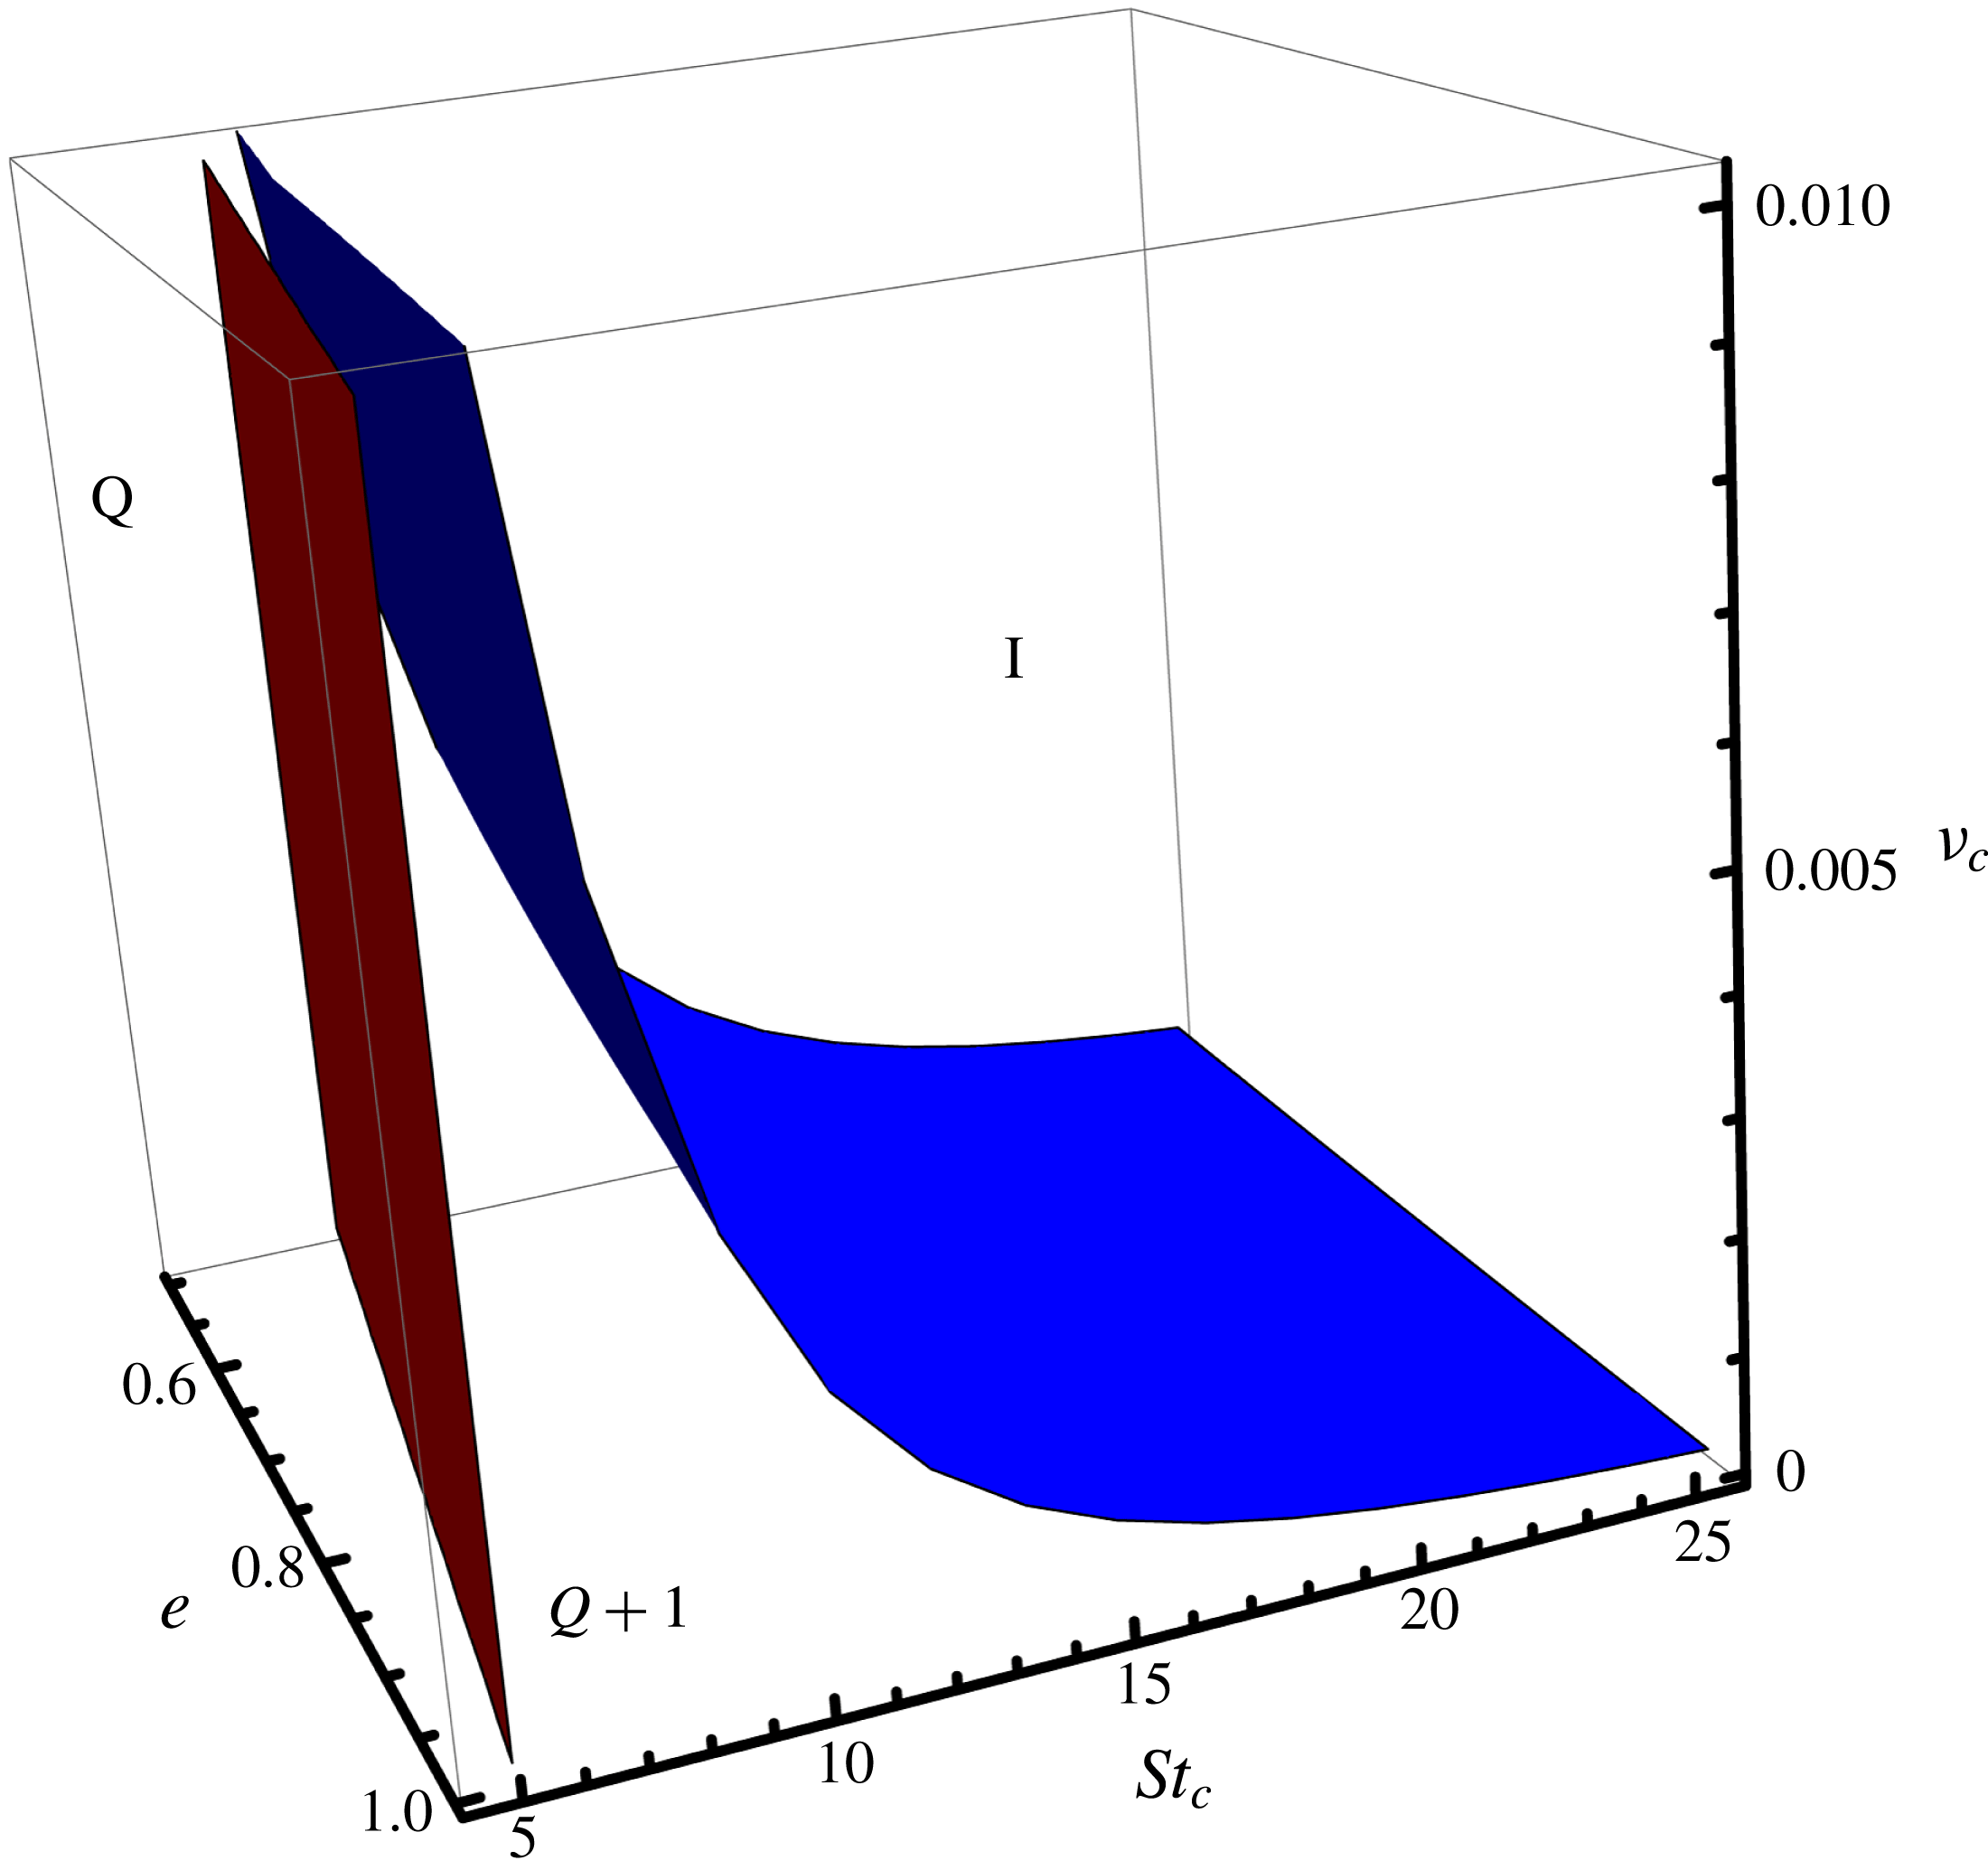
Complete phase diagram of different states (‘ignited’ (
 $I$
), ‘quenched’ (
 $Q$
) and their coexistence (
 $Q+I$
)) in the (
 $\unicode[STIX]{x1D708},St,e$
)-plane. The blue- and brown-coloured planes, above and below which, respectively, the ignited and quenched states exist, have been determined analytically from an ordering analysis of (3.1) in the dilute limit; for details, see the text in § 3.3 and appendix F.

The master phase diagram in figure 5 summarizes all possible states in the (
 $\unicode[STIX]{x1D708},St,e$
)-plane: (i) the ignited state (
 $I$
) exists above the blue surface, (ii) the quenched state (
 $Q$
) is the only solution to the left of the brown surface and (iii) the coexistence of ignited and quenched (
 $I+Q$
) states occurs for parameter values lying between the blue and brown surfaces. Two critical surfaces in figure 5 would meet along a curve, thus acting as an upper bound for the existence of the unstable-state (
 $T_{us}$
) solution (and hence the existence of the mixed state
 $I+Q$
). By equating
 $St_{c_{1}}=St_{c_{2}}$
, the equation of this curve is obtained as
 $$\begin{eqnarray}\unicode[STIX]{x1D708}_{us}^{l}(e)=\left.\left(\frac{3\,087\,000\unicode[STIX]{x03C0}^{2}}{(1+e)^{4}(107+193e)^{2}}\right)^{1/3}\!\right/\!(9.9-4.91e)^{3}=\left\{\begin{array}{@{}ll@{}}0.0226 & \quad (e=1)\\ 0.0143 & \quad (e=0),\end{array}\right.\end{eqnarray}$$
which is a decreasing function of the restitution coefficient. Note that (3.9) is not a critical point, rather it represents an upper bound on density below which the phase coexist (
 $I+Q$
) occurs in the small-
 $St$
regime of a sheared gas–solid suspension.
It is clear from (3.7) and (3.6) that the critical Stokes numbers
 $St_{c_{1}}$
and
 $St_{c_{2}}$
increase with decreasing
 $e$
(i.e. increasing inelasticity) at a fixed volume fraction
 $\unicode[STIX]{x1D708}<\unicode[STIX]{x1D708}_{us}^{l}$
, when dissipative particles (
 $e\ll 1$
) collide with each other they loose more energy and hence loose more of their inertia; in that case the recovery time
 $(\unicode[STIX]{x1D70F}_{v})$
reduces and the adjustment with the local fluid velocity becomes faster, leading to the quenched state. On the other hand, for nearly elastic (
 $e\sim 1$
) collisions, the particles lose very little kinetic energy during collisions and take much more time to come back to the bulk flow and hence the recovery process becomes slow. Therefore, at higher values of
 $e$
, both ignited and quenched states exist but only the quenched state is possible if we increase inelasticity of the system, leading to the behaviour of
 $St_{c_{1}}$
as in (3.7). Similar argument holds for the variation of
 $St_{c_{2}}$
with inelasticity as well.
4 Non-Newtonian rheology: second-moment anisotropy, shear thickening and normal-stress differences
Once the temperature field is solved from (3.1) for specified values of
 $\unicode[STIX]{x1D708}$
,
 $St$
and
 $e$
, the non-coaxiality angle
 $\unicode[STIX]{x1D719}$
, the temperature anisotropy
 $\unicode[STIX]{x1D702}$
and the excess temperature
 $\unicode[STIX]{x1D706}^{2}$
can be calculated from the remaining equations (2.30) – these are amenable to analytical solutions as described in § 4.1. The behaviour of the shear viscosity and normal-stress differences are analysed in §§ 4.2 and 4.3, respectively.
4.1 Anisotropies of second-moment tensor: analytical solution for
$\unicode[STIX]{x1D719}$
,
$\unicode[STIX]{x1D702}$
and
$\unicode[STIX]{x1D706}^{2}$


After some algebra and rearrangement of terms in (2.30), the closed-form solutions for
 $\unicode[STIX]{x1D719}$
,
 $\unicode[STIX]{x1D702}^{2}$
and
 $\unicode[STIX]{x1D706}^{2}$
have been found:
 $$\begin{eqnarray}\displaystyle & \displaystyle \unicode[STIX]{x1D719}=\frac{1}{2}\tan ^{-1}\left(\frac{2}{St}+\frac{12(1+e)(3-e)\unicode[STIX]{x1D708}\sqrt{T}}{5\sqrt{\unicode[STIX]{x03C0}}}\right)^{-1}, & \displaystyle\end{eqnarray}$$
 $$\begin{eqnarray}\displaystyle & \displaystyle \unicode[STIX]{x1D702}^{2}=-\frac{\mathfrak{b}}{2\mathfrak{a}}-\frac{1}{2\mathfrak{a}}\sqrt{\mathfrak{b}^{2}-4\mathfrak{a}\mathfrak{ c}}, & \displaystyle\end{eqnarray}$$
 $$\begin{eqnarray}\displaystyle & \displaystyle \unicode[STIX]{x1D706}^{2}=\frac{{\displaystyle \frac{5\sqrt{\unicode[STIX]{x03C0}}}{2St}}T+(1+e)\unicode[STIX]{x1D708}T^{3/2}\left[5(1-e)-(5+3e){\displaystyle \frac{\unicode[STIX]{x1D702}^{2}}{14}}\right]-{\displaystyle \frac{8(1+e)^{2}\unicode[STIX]{x1D708}}{63\sqrt{\unicode[STIX]{x03C0}}}}}{\left({\displaystyle \frac{5\sqrt{\unicode[STIX]{x03C0}}}{St}}T+6(1+e)(3-e)\unicode[STIX]{x1D708}T^{3/2}\right)}, & \displaystyle\end{eqnarray}$$
with
 $T$
being calculated from (3.1) for specified values of
 $St$
,
 $\unicode[STIX]{x1D708}$
and
 $e$
. The solution for the temperature anisotropy
 $\unicode[STIX]{x1D702}$
follows from the quadratic equation
 $\mathfrak{a}\unicode[STIX]{x1D702}^{4}+\mathfrak{b}\unicode[STIX]{x1D702}^{2}+\mathfrak{c}=0$
, where
 $$\begin{eqnarray}\left.\begin{array}{@{}rcl@{}}\mathfrak{a}\, & =\, & {\displaystyle \frac{9(1-e^{2})^{2}\unicode[STIX]{x1D708}^{2}T^{3}}{25\unicode[STIX]{x03C0}}}>0\\ \mathfrak{b}\, & =\, & {\displaystyle \frac{6(1-e^{2})\unicode[STIX]{x1D708}T^{3/2}}{5\sqrt{\unicode[STIX]{x03C0}}}}\left({\displaystyle \frac{3}{St}}T-{\displaystyle \frac{16\unicode[STIX]{x1D708}(1+e)^{2}}{35\unicode[STIX]{x03C0}}}+{\displaystyle \frac{6(1-e^{2})\unicode[STIX]{x1D708}T^{3/2}}{\sqrt{\unicode[STIX]{x03C0}}}}\right)-T^{2}\cos ^{2}2\unicode[STIX]{x1D719}\\ \mathfrak{c}\, & =\, & \left({\displaystyle \frac{3}{St}}T-{\displaystyle \frac{16\unicode[STIX]{x1D708}(1+e)^{2}}{35\unicode[STIX]{x03C0}}}+{\displaystyle \frac{6(1-e^{2})\unicode[STIX]{x1D708}T^{3/2}}{\sqrt{\unicode[STIX]{x03C0}}}}\right)^{2}>0.\end{array}\right\}\end{eqnarray}$$
For a suspension of elastically colliding particles (
 $e=1$
, with finite
 $St$
), we have
 $\mathfrak{a}=0$
and
 $\mathfrak{b}=-T^{2}\cos ^{2}2\unicode[STIX]{x1D719}$
, and hence the above solutions (4.1)–(4.3) simplify to
 $$\begin{eqnarray}\left.\begin{array}{@{}rcl@{}}\unicode[STIX]{x1D719}(e=1)\, & =\, & {\displaystyle \frac{1}{2}}\tan ^{-1}\left({\displaystyle \frac{2}{St}}+{\displaystyle \frac{48\unicode[STIX]{x1D708}\sqrt{T}}{5\sqrt{\unicode[STIX]{x03C0}}}}\right)^{-1}>0,\\ \unicode[STIX]{x1D702}^{2}(e=1)\, & =\, & -{\displaystyle \frac{\mathfrak{c}}{\mathfrak{b}}}\equiv \left({\displaystyle \frac{3}{St}}T-{\displaystyle \frac{64\unicode[STIX]{x1D708}}{35\unicode[STIX]{x03C0}}}\right)^{2}T^{-2}\sec ^{2}2\unicode[STIX]{x1D719}>0,\\ \unicode[STIX]{x1D706}^{2}(e=1)\, & =\, & {\displaystyle \frac{{\displaystyle \frac{5\sqrt{\unicode[STIX]{x03C0}}}{2St}}T-{\displaystyle \frac{8}{7}}\unicode[STIX]{x1D708}T^{3/2}\unicode[STIX]{x1D702}^{2}-{\displaystyle \frac{32\unicode[STIX]{x1D708}}{63\sqrt{\unicode[STIX]{x03C0}}}}}{\left({\displaystyle \frac{5\sqrt{\unicode[STIX]{x03C0}}}{St}}T+24\unicode[STIX]{x1D708}T^{3/2}\right)}}>0.\end{array}\right\}\end{eqnarray}$$
Recall from (2.20) that the non-zero values of (
 $\unicode[STIX]{x1D719},\unicode[STIX]{x1D702},\unicode[STIX]{x1D706}^{2}$
) quantify the degree of anisotropy of the second-moment tensor
 $\unicode[STIX]{x1D648}$
(and hence is a measure of the anisotropy of the kinetic stress tensor,
 $\unicode[STIX]{x1D64B}=\langle \unicode[STIX]{x1D70C}\boldsymbol{C}\boldsymbol{C}\rangle =\unicode[STIX]{x1D70C}\unicode[STIX]{x1D648}$
, too).
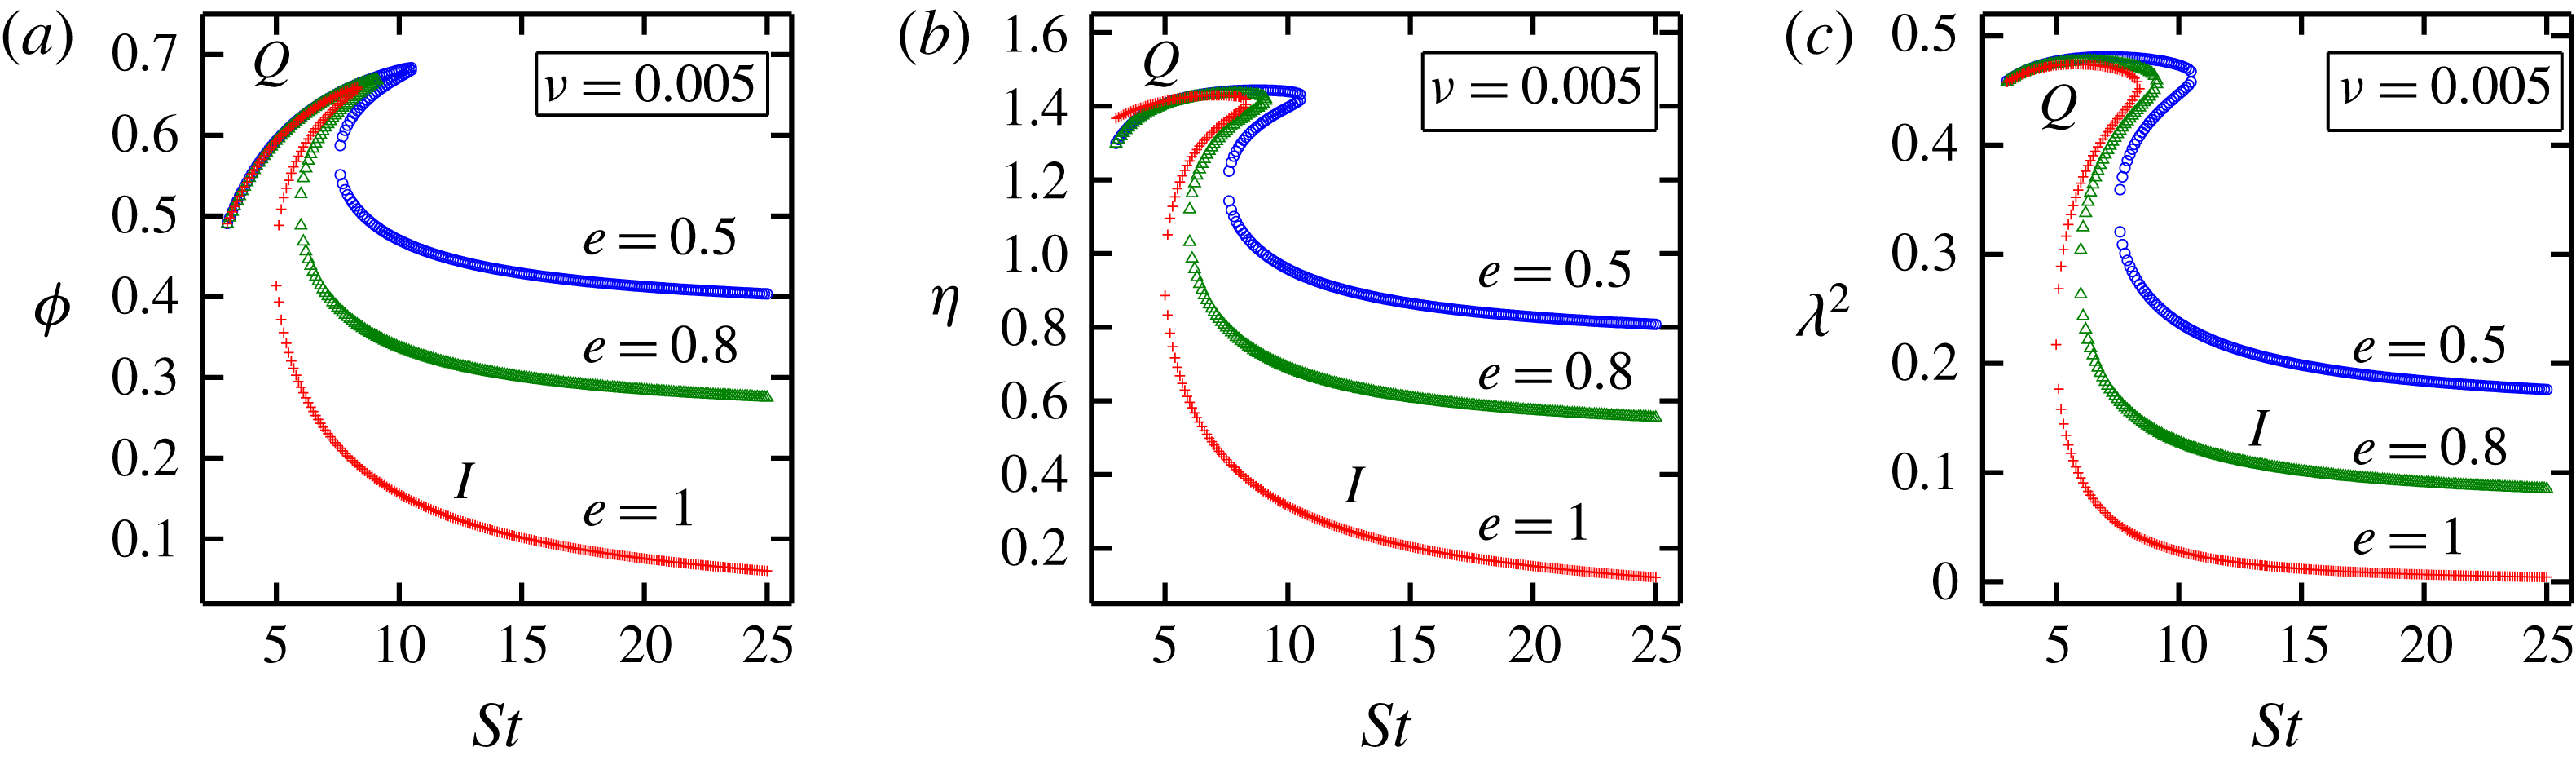
Variations of (a) the non-coaxiality angle
 $\unicode[STIX]{x1D719}$
, (b) the shear-plane anisotropy
 $\unicode[STIX]{x1D702}$
and (c) the excess temperature
 $\unicode[STIX]{x1D706}^{2}$
with Stokes number for different
 $e$
. The mean volume fraction is set to
 $\unicode[STIX]{x1D708}=0.005$
.

The positivity of (4.1)–(4.3) is verified in figures 6(a–c), respectively, which display the variations of
 $\unicode[STIX]{x1D719}$
,
 $\unicode[STIX]{x1D702}$
and
 $\unicode[STIX]{x1D706}^{2}$
with Stokes number for different values of the restitution coefficient
 $e\leqslant 1$
, at a mean volume fraction of
 $\unicode[STIX]{x1D708}=0.005$
– the results look qualitatively similar at other values of
 $\unicode[STIX]{x1D708}<\unicode[STIX]{x1D708}_{us}^{l}$
(3.9). It is seen from figure 6 that the increasing inelasticity markedly increases the values of (
 $\unicode[STIX]{x1D719},\unicode[STIX]{x1D702},\unicode[STIX]{x1D706}^{2}$
) on the ignited state, thereby enhancing the anisotropy of the second-moment tensor. In contrast, the inelasticity does not noticeably affect (
 $\unicode[STIX]{x1D719},\unicode[STIX]{x1D702},\unicode[STIX]{x1D706}^{2}$
) the quenched state in which the particle collisions are rare and the dynamics is primarily dictated by fluid inertia. Interestingly, increasing shear makes the second-moment tensor more anisotropic on the quenched branch – this can be understood by considering the scaling relations of (
 $\unicode[STIX]{x1D719},\unicode[STIX]{x1D702},\unicode[STIX]{x1D706}^{2}$
) at
 $St\sim 0$
as follows. Using the closed-form solutions for three temperatures (3.2)–(3.4), the non-coaxiality angle for
 $e=1$
can be rewritten as
 $$\begin{eqnarray}\tan 2\unicode[STIX]{x1D719}_{qs}=\frac{St}{2+{\displaystyle \frac{128\sqrt{2}}{5\sqrt{105}\unicode[STIX]{x03C0}}}\unicode[STIX]{x1D708}^{3/2}St^{5/2}}\sim St/2\quad \text{at }St\sim 0.\end{eqnarray}$$
Therefore, in the limit of small
 $St$
, the inertia enhances the non-coaxiality angle in the quenched state. On the other hand, increasing
 $St$
decreases
 $\unicode[STIX]{x1D719}$
in the ignited state, reaching some asymptotic value (depending on
 $e$
) at large enough
 $St$
as seen in figure 6(a). This can be explained from an analysis of the ignited branch solution, leading to:
 $$\begin{eqnarray}\tan 2\unicode[STIX]{x1D719}_{is}=\frac{3St}{6+St^{2}}\sim \frac{3}{St},\quad \text{for }St\gg 1.\end{eqnarray}$$
Similar scalings (4.6)–(4.7) hold for the temperature anisotropy
 $\unicode[STIX]{x1D702}$
and the excess temperature
 $\unicode[STIX]{x1D706}^{2}$
too, that explain the observed behaviour in figures 6(b) and 6(c), respectively. In summary, the degree of anisotropy of the second-moment tensor in the quenched and ignited states is primarily dictated by the background shear and inelasticity, respectively. The latter effect of inelasticity can be understood from following scaling arguments.
It may be noted that the scaling relation (4.7) is not strictly valid at
 $St\rightarrow \infty$
since the double limit of
 $e\rightarrow 1$
and
 $St\rightarrow \infty$
leads to a singular behaviour of temperature
 $T\rightarrow \infty$
(and hence a thermostat is necessary to achieve a steady shearing state of elastically colliding particles in the absence of fluid drag). The case of a sheared granular gas (
 $St=\infty$
at
 $e\neq 1$
) has been analysed previously (Jenkins & Richman Reference Jenkins and Richman1988; Richman Reference Richman1989; Saha & Alam Reference Saha and Alam2014, Reference Saha and Alam2016a
); it can be verified that the above solutions (4.1)–(4.3) for the ignited branch reduce to the low-density solution of Saha & Alam (Reference Saha and Alam2016a
):
 $$\begin{eqnarray}\left.\begin{array}{@{}rcl@{}}\unicode[STIX]{x1D706}^{2} & {\approx} & {\displaystyle \frac{1}{48e}}(168+53(1-e))\left[\sqrt{1+5760e(1-e)(168+53(1-e))^{-2}}-1\right]\\ & {\approx} & {\displaystyle \frac{5}{14}}(1-e)\left(1+{\displaystyle \frac{53}{168}}(1-e)\right)\left(1-{\displaystyle \frac{53}{84}}(1-e)\right)\\ \unicode[STIX]{x1D702}^{2} & = & {\displaystyle \frac{3\unicode[STIX]{x1D706}^{2}(7+6\unicode[STIX]{x1D706}^{2})}{6+\unicode[STIX]{x1D706}^{2}}}\approx {\displaystyle \frac{7}{2}}\unicode[STIX]{x1D706}^{2}={\displaystyle \frac{5}{4}}(1-e)\left(1+{\displaystyle \frac{53}{168}}(1-e)\right)\left(1-{\displaystyle \frac{53}{84}}(1-e)\right)\\ \sin 2\unicode[STIX]{x1D719} & = & {\displaystyle \frac{\unicode[STIX]{x1D702}}{1+\unicode[STIX]{x1D706}^{2}}}\approx \unicode[STIX]{x1D702}\sim \sqrt{1-e}\\ \sqrt{T} & = & {\displaystyle \frac{5\sqrt{\unicode[STIX]{x03C0}}\unicode[STIX]{x1D702}\cos \unicode[STIX]{x1D719}}{3(1-e^{2})\unicode[STIX]{x1D708}(10+\unicode[STIX]{x1D702}^{2})}}\approx {\displaystyle \frac{\sqrt{\unicode[STIX]{x03C0}}}{6(1-e^{2})\unicode[STIX]{x1D708}}}\unicode[STIX]{x1D702}(1-\unicode[STIX]{x1D702}^{2}/10)(1-\unicode[STIX]{x1D702}^{2}/2)\\ & {\approx} & {\displaystyle \frac{\sqrt{\unicode[STIX]{x03C0}}}{6(1-e^{2})\unicode[STIX]{x1D708}}}\unicode[STIX]{x1D702}\left(1-{\displaystyle \frac{3}{5}}\unicode[STIX]{x1D702}^{2}\right)\sim (1-e)^{-1/2}.\end{array}\right\}\end{eqnarray}$$
Therefore, in the limit (
 $St\rightarrow \infty$
) of a granular gas,
 $\unicode[STIX]{x1D702}\sim \unicode[STIX]{x1D706}\sim \sin 2\unicode[STIX]{x1D719}\sim \sqrt{(1-e)}$
, with the granular temperature diverging like
 $T\sim (1-e)^{-1}$
– the latter finding rules out the possibility of the quenched-state solution in a sheared granular gas. The scaling relations (4.8) hold at leading order in
 $\sqrt{1-e}$
for
 $St\gg 1$
, and therefore we conclude that the inelasticity enhances the degree of anisotropy of
 $\unicode[STIX]{x1D648}$
on the ignited branch, see figure 6.
4.2 Shear viscosity of particle phase
The dimensionless shear viscosity for the particle phase is given by
 $$\begin{eqnarray}\displaystyle \unicode[STIX]{x1D707} & = & \displaystyle -\frac{P_{xy}}{\unicode[STIX]{x1D70C}_{p}\unicode[STIX]{x1D708}(\dot{\unicode[STIX]{x1D6FE}}\unicode[STIX]{x1D70E}/2)^{2}}=\unicode[STIX]{x1D702}\cos (2\unicode[STIX]{x1D719})T\end{eqnarray}$$
 $$\begin{eqnarray}\displaystyle & {\approx} & \displaystyle \frac{3}{St}T-\frac{16\unicode[STIX]{x1D708}(1+e)^{2}}{35\unicode[STIX]{x03C0}}+\frac{3(1-e^{2})\unicode[STIX]{x1D708}T^{3/2}}{5\sqrt{\unicode[STIX]{x03C0}}}(10+\unicode[STIX]{x1D702}^{2}).\end{eqnarray}$$
While (4.9) is an exact expression of viscosity in terms of the invariants of the second-moment tensor, equation (4.10) is an approximation that holds at quadratic order in anisotropies as embodied in the second-moment balance (2.30). For the case of only ignited state (i.e. with
 $\aleph \equiv \aleph ^{is}$
), it can be verified that the shear viscosity for a gas–solid suspension of elastically colliding particles (
 $e=1$
) is
 $\unicode[STIX]{x1D707}=3T/St$
which represents the first term in (4.10); its second term represents one contribution from the quenched state, and the third term accounts for inelastic dissipation. It is straightforward to verify that in the limit of a dry granular gas (
 $St\rightarrow \infty$
), the second-moment balance equations (2.30) boil down to (4.3) of Saha & Alam (Reference Saha and Alam2016a
), and consequently the shear viscosity (4.9) reduces to the well-known expression (C 15) for a hard sphere gas.
4.2.1 Shear-thickening and shear-thinning behaviour
The variation of (4.9) as functions of (
 $St,e$
) is depicted in figure 7(a) for a particle volume fraction of
 $\unicode[STIX]{x1D708}=0.005$
. Similar to granular temperature, the shear viscosity undergoes hysteretic jumps at
 $St=St_{c_{2}}$
(‘
 $Q\rightarrow I$
’) and
 $St_{c_{1}}$
(‘
 $I\rightarrow Q$
’) on increasing and decreasing
 $St$
, respectively. The effect of dissipation (
 $e<1$
) is to reduce the viscosity of the particle phase in each state, see figure 7(b). The inset of figure 7(b) clarifies that the shear-rate scalings of viscosity for elastic (
 $e=1$
) and granular (
 $e<1$
) suspensions are different as expected from the behaviour of granular temperature in the same limit (§ 3.2). For example, plugging (3.2) into the first term in (4.10) yields the viscosity of elastically colliding (
 $e=1$
) particles
 $$\begin{eqnarray}\displaystyle \unicode[STIX]{x1D707}_{is}(e=1)\approx \frac{75\unicode[STIX]{x03C0}}{20\,736}\frac{St}{\unicode[STIX]{x1D708}^{2}} & & \displaystyle\end{eqnarray}$$
in the ignited state, which provides the correct scaling in the limit of
 $St\rightarrow \infty$
as depicted by the red line in the inset of figure 7(b). In contrast, for a granular suspension (
 $e<1$
) at
 $St\rightarrow \infty$
, the contribution from the first term in (4.10) is negligible and the third term dominates, yielding
 $$\begin{eqnarray}\unicode[STIX]{x1D707}_{is}(e<1)\approx \frac{6}{\sqrt{\unicode[STIX]{x03C0}}}(1-e^{2})\unicode[STIX]{x1D708}T^{3/2}\sim \frac{6}{\sqrt{\unicode[STIX]{x03C0}}}(1-e^{2})^{-1/2}\unicode[STIX]{x1D708}^{-1/2},\end{eqnarray}$$
which is independent of
 $St$
as verified in the inset of figure 7(b) (see the blue line for
 $e=0.5$
). Recall that the elastic limit of (4.12) remains finite (Sela & Goldhirsch Reference Sela and Goldhirsch1998) for reasons discussed in the last paragraph of § 4.1. The leading
 $O(St^{-1})$
correction to (4.12) would not change the large shear-rate behaviour of the ignited-state viscosity for granular suspensions.
(a) Hysteretic behaviour of ‘particle-phase’ viscosity (
 $\unicode[STIX]{x1D707}$
) as functions of (
 $St$
,
 $e$
) for a volume fraction of
 $\unicode[STIX]{x1D708}=0.005$
; this represents DST (discontinuous shear thickening) behaviour for any
 $e$
at
 $\unicode[STIX]{x1D708}<\unicode[STIX]{x1D708}_{us}^{l}$
(3.8). (b) Viscosity versus
 $St$
for
 $e=1$
(red line) and
 $e=0.5$
(blue line); the vertical dotted lines represent the coexistence point, marked by circles in (
 $c$
), at which two states
 $I$
and
 $Q$
coexists with each other. Inset of (
 $b$
) illustrates different scaling behaviour of
 $\unicode[STIX]{x1D707}$
for elastic (
 $e=1$
) and inelastic (
 $e<1$
) particles in large-
 $St$
limit. (c) An effective Massieu function (4.15), with parameter values as in (
 $b$
); see the text for details.

For the quenched state (i.e. with
 $\aleph \equiv \aleph ^{is}$
), the second-moment balance (2.28) can be exactly solved, yielding the following expression for the particle-phase viscosity in the quenched state (see appendix G.1)
 $$\begin{eqnarray}\frac{\unicode[STIX]{x1D707}_{qs}}{\unicode[STIX]{x1D707}_{g}}=\frac{(1+e)^{2}}{2}St^{2}\left(\frac{32St}{35\unicode[STIX]{x03C0}}+\frac{18}{35}\right)\unicode[STIX]{x1D708}^{2},\end{eqnarray}$$
which appears at quadratic order in both
 $\unicode[STIX]{x1D708}$
and
 $St$
. The above formula accounts for the ‘shear-induced’ finite-
 $St$
contribution to the well-known Einstein formula for the ‘effective/suspension’ viscosity of a dilute ‘Stokesian’ (
 $Re=0$
) suspension – note that (4.13) differs from that in Tsao & Koch (Reference Tsao and Koch1995) for
 $e=1$
by a numerical factor of 2. It is clear from (4.13) that the effect of inelasticity is to decrease the quenched-state viscosity as verified in the main panel of figure 7(b).
In summary, the Stokes number scaling of the particle-phase viscosity is given by
 $$\begin{eqnarray}\unicode[STIX]{x1D707}_{is}\propto St^{\unicode[STIX]{x1D6FC}},\quad \unicode[STIX]{x1D707}_{qs}\propto St^{2}\quad \text{and}\quad \unicode[STIX]{x1D707}_{us}\propto St^{-7},\end{eqnarray}$$
where
 $\unicode[STIX]{x1D6FC}=1$
and
 $0$
for
 $e=1$
and
 $e<1$
, respectively; while the ignited and quenched states are shear thickening, the unstable branch is shear thinning. Note that the power-law exponent for the unstable branch in (4.14) directly follows when our asymptotic solution (3.4) of corresponding temperature
 $T_{us}$
is substituted into
 $3T/St$
(i.e. the first term in (4.10)). These exponents have been verified in figure E.1(b) in appendix E.
4.2.2 Instability of shear-thinning branch: possible origin of DST
The middle branch in figure 7(a,b), over which viscosity (
 $\unicode[STIX]{x1D707}$
) decreases with increasing Stokes number
 $St$
(i.e. the shear-thinning branch), is unstable. The underlying instability is of thermodynamic/constitutive (Callen Reference Callen1985; Goddard & Alam Reference Goddard and Alam1999; Gayen & Alam Reference Gayen and Alam2006) origin and can be understood from a phenomenological viewpoint. Let us calculate the following quantity,
 $$\begin{eqnarray}\unicode[STIX]{x1D6F4}(\dot{\unicode[STIX]{x1D6FE}})=\int _{\dot{\unicode[STIX]{x1D6FE}}_{R}}^{\dot{\unicode[STIX]{x1D6FE}}}\unicode[STIX]{x1D707}(\dot{\unicode[STIX]{x1D6FE}})\dot{\unicode[STIX]{x1D6FE}}\,\text{d}\dot{\unicode[STIX]{x1D6FE}}+\unicode[STIX]{x1D6F4}_{R},\end{eqnarray}$$
which is a measure of the stress work and the reference value
 $\unicode[STIX]{x1D6F4}_{R}$
is added to make
 $\unicode[STIX]{x1D6F4}(\dot{\unicode[STIX]{x1D6FE}})$
positive definite. The variation of (4.15) is plotted against
 $St$
in figure 7(c) for
 $e=1$
(red line) and 0.5 (blue line). For each case, the uppermost envelope in figure 7(c) represents the stable solution, and the intersection between the ignited and quenched branches represent the coexistence point at which both states coexist with each other. The latter point is marked by vertical dashed lines in figure 7(b) – this also follows from the well-known Maxwell equal-area rule. For the present problem, the effective shear work
 $\unicode[STIX]{x1D6F4}(\dot{\unicode[STIX]{x1D6FE}})$
, equation (4.15), behaves like a ‘Massieu’ function (Callen Reference Callen1985) since the supremum of
 $\unicode[STIX]{x1D6F4}(\dot{\unicode[STIX]{x1D6FE}})$
corresponds to the ‘selected’ branch among three ‘coexisting’ solutions, see figure 7(c). It must be noted that the choice of (4.15) is not unique and depends on the quantity whose solution multiplicity is being probed.
Variations of the dynamic friction
 $\unicode[STIX]{x1D6FD}_{d}=-P_{xy}/p$
(main panel) and its Massieu function (inset), equation (4.17), with Stokes number: (a)
 $e=0.5$
and (b)
 $e=0.3$
.

A related quantity of interest is the ‘dynamic’ friction, defined as the ratio between the shear stress and pressure,
 $$\begin{eqnarray}\unicode[STIX]{x1D6FD}_{d}=-\frac{P_{xy}}{p}\equiv \unicode[STIX]{x1D702}\cos 2\unicode[STIX]{x1D719},\end{eqnarray}$$
whose variation with Stokes number is shown in the main panels of figure 8(a,b) for
 $e=0.5$
and 0.3; the upper, middle and lower branches correspond to ignited-, unstable- and quenched-state solutions, respectively. It is seen that at any
 $e$
the dynamic friction decreases sharply with increasing shear rate on both quenched and unstable branches, while its value increases slightly in the same limit on the ignited branch. The variation of the integral quantity,
 $$\begin{eqnarray}\unicode[STIX]{x1D6F4}_{\unicode[STIX]{x1D6FD}}(\dot{\unicode[STIX]{x1D6FE}})=\int _{0}^{\dot{\unicode[STIX]{x1D6FE}}}\unicode[STIX]{x1D6FD}_{d}(\dot{\unicode[STIX]{x1D6FE}})\,\text{d}\dot{\unicode[STIX]{x1D6FE}},\end{eqnarray}$$
is displayed in the inset of each panel in figure 8. It is seen that the value of
 $\unicode[STIX]{x1D6F4}_{\unicode[STIX]{x1D6FD}}$
for the unstable branch remains the least (the rightmost curve in each inset) for the range of
 $St$
over which three states (
 $I$
,
 $Q$
and
 $U$
) are possible; the coexistence point between
 $I$
and
 $Q$
is marked by a circle in each inset whose location is denoted the vertical dashed line in the corresponding main panel in figure 8. For the case of dynamic friction too, the supremum of
 $\unicode[STIX]{x1D6F4}_{\unicode[STIX]{x1D6FD}}(\dot{\unicode[STIX]{x1D6FE}})$
, equation (4.17), corresponds to the selected branch and hence
 $\unicode[STIX]{x1D6F4}_{\unicode[STIX]{x1D6FD}}(\dot{\unicode[STIX]{x1D6FE}})$
acts like a Massieu function. A proper identification of a Massieu/entropy function, or, a thermodynamic potential for the present sheared suspension would require a stability analysis (Alam & Nott Reference Alam and Nott1997; Gayen & Alam Reference Gayen and Alam2006) of the underlying moment equations subject to uniform shear flow.
Overall, figure 7(a,b) illustrates that two shear-thickening branches (
 $Q$
and
 $I$
) are connected via an intermediate shear-thinning branch, and there are discontinuous jumps in viscosity with increasing/decreasing
 $St$
along the quenched/ignited states, respectively. While the discontinuous jump in viscosity with shear rate is dubbed ‘discontinuous shear thickening’ (DST), its continuous variation with shear rate is known as ‘continuous shear thickening’ (CST) (Hoffman Reference Hoffman1972; Brown & Jaeger Reference Brown and Jaeger2014). Returning to the phase diagram in figure 5, the hysteretic jump in viscosity (as well as in other transport coefficient) occurs in the region where both
 $I$
- and
 $Q$
-states can coexist – note that the range of Stokes number for this coexistence region decreases with increasing volume fraction. Therefore, the DST behaviour, such as in figure 7(a,b), occurs only in the small Stokes number limit of a dilute gas–solid suspension at any restitution coefficient. Indeed, Sangani et al. (Reference Sangani, Mo, Tsao and Koch1996) showed that the DST behaviour changes to CST behaviour in a moderately dense suspension (of elastic particles) beyond a minimum value of the volume fraction
 $\unicode[STIX]{x1D708}>\unicode[STIX]{x1D708}_{us}^{l}\approx 0.058$
; for the present analysis, this critical volume fraction is given by (3.9) which also depends on the restitution coefficient. In this regard the connection of the ignited–quenched transition with recent works (Hayakawa, Takada & Garzo Reference Hayakawa, Takada and Garzo2017) on DST for a thermalized granular gas is briefly discussed in appendix G.2 (supplementary materials).
Variations of the first
 $({\mathcal{N}}_{1})$
normal-stress differences against Stokes number (
 $St$
) and restitution coefficient (
 $e$
) at
 $\unicode[STIX]{x1D708}=0.005$
. In (b) the projection of (a) is displayed for different
 $e$
.

4.3 First and second normal-stress differences
The expression for the first normal-stress difference is
 $$\begin{eqnarray}\displaystyle {\mathcal{N}}_{1}=\frac{P_{xx}-P_{yy}}{p}=2\unicode[STIX]{x1D702}\sin 2\unicode[STIX]{x1D719}, & & \displaystyle\end{eqnarray}$$
which has been ‘scaled’ by the mean pressure
 $p=(P_{xx}+P_{yy}+P_{zz})/3$
; in (4.18),
 $\unicode[STIX]{x1D719}$
and
 $\unicode[STIX]{x1D702}$
are calculated from (4.1) and (4.2), respectively. The variation of (4.18) as functions of (
 $St,e$
) is displayed in figure 9(a,b). The quenched branch
 ${\mathcal{N}}_{1}$
remains unaffected by inelasticity (see panel b), however, on the ignited branch, increasing inelasticity increases
 ${\mathcal{N}}_{1}$
; the effect of the gas phase (i.e. decreasing
 $St$
) also increases the ignited branch
 ${\mathcal{N}}_{1}$
. On the whole, the dependence of
 ${\mathcal{N}}_{1}$
on both
 $St$
and
 $e$
mirrors that of the non-coaxiality angle (
 $\unicode[STIX]{x1D719}$
) and the shear-plane temperature anisotropy (
 $\unicode[STIX]{x1D702}$
), compare figure 9(b) with figure 6(a,b). It is clear from (4.18) that the origin of the first normal-stress difference is tied to the shear-plane anisotropies (
 $\unicode[STIX]{x1D702}$
and
 $\unicode[STIX]{x1D719}$
) of the second-moment tensor as in the case of a sheared granular gas (Jenkins & Richman Reference Jenkins and Richman1988; Saha & Alam Reference Saha and Alam2016a
) – the dependence of
 $St$
on its origin remains implicit via two anisotropy parameters (
 $\unicode[STIX]{x1D719},\unicode[STIX]{x1D702}$
).
(a) Variation of the second
 $({\mathcal{N}}_{2})$
normal-stress difference against Stokes number
 $(St)$
for different values of the restitution coefficient; the particle volume fraction is
 $\unicode[STIX]{x1D708}=0.005$
. (b) Variations of
 $3\unicode[STIX]{x1D706}^{2}$
(blue circles) and
 ${\mathcal{N}}_{1}/2$
(green triangles) with
 $St$
for
 $e=0.5$
, with other parameters as in (a). (c) Variations of the critical Stokes number
 $St_{\pm }$
(at which
 ${\mathcal{N}}_{2}=0$
) with
 $e$
for
 $\unicode[STIX]{x1D708}=0.005$
(solid line) and
 $\unicode[STIX]{x1D708}=0.0005$
(dashed line).

The scaled second normal-stress difference is given by
 $$\begin{eqnarray}\displaystyle {\mathcal{N}}_{2}=\frac{P_{yy}-P_{zz}}{p}=3\unicode[STIX]{x1D706}^{2}-\unicode[STIX]{x1D702}\sin 2\unicode[STIX]{x1D719}=3\unicode[STIX]{x1D706}^{2}-\frac{1}{2}{\mathcal{N}}_{1}, & & \displaystyle\end{eqnarray}$$
whose variation with
 $St$
is shown in figure 10(a) for different values of the restitution coefficient
 $e$
. Similar to
 ${\mathcal{N}}_{1}$
, the effect of inelasticity is to increase the magnitude of the second normal-stress difference on the ignited branch, but the quenched branch
 ${\mathcal{N}}_{2}$
remains unaffected (expectedly) by changing
 $e$
. It is noteworthy in figure 10(a) that
 ${\mathcal{N}}_{2}$
is positive and negative in the quenched and ignited states, respectively. This sign change can be understood from figure 10(b) which displays the variations of two terms in (4.19) with
 $St$
. In the quenched state the excess temperature (
 $3\unicode[STIX]{x1D706}^{2}\propto T_{z}^{ex}$
) dominates over the shear-plane anisotropies (
 $\unicode[STIX]{x1D702}\sin 2\unicode[STIX]{x1D719}\equiv {\mathcal{N}}_{1}/2$
), whereas the latter dominates over the former in the ignited state, resulting in the sign change of
 ${\mathcal{N}}_{2}$
at some finite value of
 $St$
.
The parameter combinations (
 $St,e,\unicode[STIX]{x1D708}$
) at which
 ${\mathcal{N}}_{2}$
undergoes sign reversal can be calculated by solving the following equation
 $$\begin{eqnarray}{\mathcal{N}}_{1}-6\unicode[STIX]{x1D706}^{2}=0,\end{eqnarray}$$
along with (4.18) and (4.3). Figure 10(c) shows the variation of
 $St_{\pm }$
with restitution coefficient:
 ${\mathcal{N}}_{2}$
is positive and negative, respectively, below and above each line for a specified density
 $\unicode[STIX]{x1D708}$
. It is seen that the effect of inelastic dissipation is to increase the critical value of
 $St_{\pm }$
at which
 ${\mathcal{N}}_{2}$
changes its sign; reducing the mean density increases
 $St_{\pm }$
at any
 $e$
.
It may be noted that for a ‘dense’ sheared granular gas (
 $St\rightarrow \infty$
), the second normal-stress difference undergoes sign change (Alam & Luding Reference Alam, Luding, Garcia-Rojo, Herrmann and McNamara2005; Saha & Alam Reference Saha and Alam2016a
) at some critical density (
 $\unicode[STIX]{x1D708}_{\pm }\sim 0.2$
), with
 ${\mathcal{N}}_{2}$
being negative and positive in the dilute and dense limits, respectively; the competition between (i) the collisional anisotropies in a dense system (that makes the particle motion increasingly streamlined (Alam & Luding Reference Alam, Luding, Garcia-Rojo, Herrmann and McNamara2005) with increasing density) and (ii) the second-moment anisotropies (
 $\unicode[STIX]{x1D719},\unicode[STIX]{x1D702},\unicode[STIX]{x1D706}^{2}$
) is known to be responsible for this sign change (Saha & Alam Reference Saha and Alam2016a
). For the present case of a ‘dilute’ suspension, the behaviour of
 ${\mathcal{N}}_{2}$
in the quenched state resembles that in a sheared ‘dense’ granular fluid; this could possibly be due to the ‘streamlined’ particle motion in both systems, characterizing the underlying anisotropy of a sheared system.
5 Discussion: comparison with Grad’s moment expansion
Recall that in figure 2, we have made a detailed comparison between the predictions of two moment theories: (i) the standard Grad’s moment expansion around a Maxwellian (Grad Reference Grad1949; Jenkins & Richman Reference Jenkins and Richman1985; Tsao & Koch Reference Tsao and Koch1995; Sangani et al.
Reference Sangani, Mo, Tsao and Koch1996; Chamorro et al.
Reference Chamorro, Reyes and Garzo2015) using Hermite polynomials and (ii) the present anisotropic-Maxwellian moment expansion (AME). Overall, the AME predictions for granular temperature are found to be more accurate (see insets in figure 2) than that of GME, especially at lower values of restitution coefficient, via a comparison with available simulation data. This conclusion holds for shear viscosity too since
 $\unicode[STIX]{x1D707}\propto \sqrt{T}$
(in the ignited state, see (C 14) and (C 15) appendix C) – in the following we focus on the predictive abilities of the present theory with reference to two normal-stress differences, focussing on the ignited state of a gas–solid suspension. (The reader is referred to Saha & Alam (Reference Saha and Alam2014) for details on AME that has been used to derive a generalized Fourier law for heat flux vector, along with conductivity tensors; the heat flux, however, vanishes in uniform shear flow as in the present case.)
5.1 Suspension of elastic and inelastic hard spheres:
${\mathcal{N}}_{1}$
and
${\mathcal{N}}_{2}$


From the present AME theory, the normal-stress differences for elastic (
 $e=1$
) hard sphere suspensions in the ‘ignited’ state are given by (appendix C)
 $$\begin{eqnarray}{\mathcal{N}}_{1}=\frac{18}{6+\unicode[STIX]{x1D6FA}St^{2}}\quad \text{and}\quad -{\mathcal{N}}_{2}=\frac{9(9+\unicode[STIX]{x1D6FA}St^{2})\unicode[STIX]{x1D6FA}St^{2}}{(6+\unicode[STIX]{x1D6FA}St^{2})[252+87\unicode[STIX]{x1D6FA}St^{2}+7\unicode[STIX]{x1D6FA}^{2}St^{4}]}>0,\end{eqnarray}$$
with
 $$\begin{eqnarray}\unicode[STIX]{x1D6FA}=\frac{1}{2St^{2}}\left[\left(St^{2}-\frac{171}{7}\right)+\left(\left(St^{2}-\frac{3}{7}\right)^{2}-(12\sqrt{2})^{2}\right)^{1/2}\right].\end{eqnarray}$$
The last quantity
 $\unicode[STIX]{x1D6FA}$
is positive for
 $St>St_{c_{1}}=\sqrt{171/7}$
(the critical Stokes number for ‘ignited-to-unstable’ transition, viz. (3.7)), and asymptotically approaches unity,
 $\unicode[STIX]{x1D6FA}(St\rightarrow \infty )=1$
, and hence
 $\unicode[STIX]{x1D6FA}\in (0,1)$
at any
 $St>St_{c_{1}}$
.
The AME predictions (5.1) can be compared with the corresponding GME predictions for
 ${\mathcal{N}}_{1}$
and
 ${\mathcal{N}}_{2}$
:
 $$\begin{eqnarray}{\mathcal{N}}_{1}=\frac{18}{6+\unicode[STIX]{x1D6E9}St^{2}}\quad \text{and}\quad -{\mathcal{N}}_{2}=\frac{\frac{9}{14}\unicode[STIX]{x1D6E9}}{6+\unicode[STIX]{x1D6E9}St^{2}}>0,\end{eqnarray}$$
where
 $$\begin{eqnarray}\unicode[STIX]{x1D6E9}=\frac{1}{2St^{2}}\left[\left(St^{2}-\frac{171}{14}\right)+\left(\left(St^{2}-\frac{171}{14}\right)^{2}-12^{2}\right)^{1/2}\right].\end{eqnarray}$$
In (5.3) there is a minor correction in the expression for
 ${\mathcal{N}}_{2}$
: the numerical factor
 $9/14$
in the numerator was taken as
 $9/7$
in Tsao & Koch (Reference Tsao and Koch1995). The positivity of (5.4) follows from the positivity of its discriminant, resulting in
 $St>St_{c_{1}}=\sqrt{169.5/7}$
, which is very close to
 $\sqrt{171/7}$
for the positivity of (5.2). It is worth pointing out that the functional dependence of both (5.2) and (5.4) yields almost identical values for
 $\unicode[STIX]{x1D6FA}$
and
 $\unicode[STIX]{x1D6E9}$
at any
 $St>St_{c_{1}}$
.
Variations of the first (circles) and second (squares) normal-stress differences with Stokes number for a suspension of elastic (
 $e=1$
) hard spheres – the particle volume fraction is
 $\unicode[STIX]{x1D708}=0.01$
, representing a ‘dilute’ suspension. The solid lines represent the present theory (5.1) and the dashed lines represent standard Grad’s moment theory (5.3); the DSMC simulation data (Tsao & Koch Reference Tsao and Koch1995) are denoted by symbols.

Figure 11 shows a comparison of (5.1) (denoted by solid lines) for
 ${\mathcal{N}}_{1}$
and
 ${\mathcal{N}}_{2}$
with (i) the DSMC simulation data (symbols) of Tsao & Koch (Reference Tsao and Koch1995) and (ii) the GME theory (5.3) (dashed lines) – the particle volume fraction is set to
 $\unicode[STIX]{x1D708}=0.01$
, representing a ‘dilute’ gas–solid suspension. It is seen that both (5.1) and (5.3) predict the correct behaviour of
 ${\mathcal{N}}_{1}$
– the two theories are almost indistinguishable from each other, with excellent quantitative agreement with simulation. However, there is a significant disagreement (by a factor of approximately
 $2$
) between (5.3) and the DSMC data for the second normal-stress difference
 ${\mathcal{N}}_{2}$
; in contrast, the predictions of AME (5.1) are uniformly good for both
 ${\mathcal{N}}_{1}$
and
 ${\mathcal{N}}_{2}$
over a range of Stokes number.
Comparisons of (a) first and (b) second normal-stress differences at
 $St=10$
and
 $\unicode[STIX]{x1D708}=0.01$
: (i) DSMC simulation (filled circles, Sangani et al.
Reference Sangani, Mo, Tsao and Koch1996), (ii) present theory (solid lines), (iii) the standard Grad’s moment expansion (dashed lines, see appendix H). The open diamonds in both panels represent DSMC simulation data for a dilute gas–solid suspension for same parameter values (we sincerely thank Mr R. Gupta for kindly providing these new data; the related DSMC method is discussed in Gupta & Alam (Reference Gupta and Alam2017)). (c) Comparison for shear viscosity.

It may be noted that in GME the quadratic nonlinear terms (proportional to
 $P_{\unicode[STIX]{x1D6FC}\unicode[STIX]{x1D6FD}}^{2}$
) need to be taken into account while evaluating the source term
 $\aleph _{\unicode[STIX]{x1D6FC}\unicode[STIX]{x1D6FD}}$
(2.11) in order to obtain ‘non-zero’ second normal-stress difference as suggested by Herdegen & Hess (Reference Herdegen and Hess1982) for a Boltzmann (dilute) gas. A brief account of the related analysis for a gas–solid suspension of inelastic particles is provided in appendix H – the resulting expressions for
 ${\mathcal{N}}_{1}$
and
 ${\mathcal{N}}_{2}$
reduce to (5.3) for elastically colliding particles. On the other hand, the analysis of Sangani et al. (Reference Sangani, Mo, Tsao and Koch1996) did not include such nonlinear Grad terms, resulting in
 ${\mathcal{N}}_{2}=0$
; the recent work of Chamorro et al. (Reference Chamorro, Reyes and Garzo2015) also confirmed that the nonlinear Grad terms are necessary for
 ${\mathcal{N}}_{2}\neq 0$
. It has been verified that the quadratic nonlinear terms do not noticeably affect the value of
 ${\mathcal{N}}_{1}$
as well as the shear viscosity.
The effect of inelasticity on
 ${\mathcal{N}}_{1}$
and
 ${\mathcal{N}}_{2}$
can be ascertained from figures 12(a) and 12(b), respectively, for a suspension with small Stokes number (
 $St=10$
); other parameters are as in figure 11. It is clear from panel
 $a$
that the present predictions of
 ${\mathcal{N}}_{1}$
(solid line) agree well with simulation data for the whole range of
 $e$
, but the GME predictions (dashed and dot-dashed lines) are slightly lower at
 $e<0.5$
. On the other hand, the GME theory grossly under-predicts (by a factor of 3) the value of
 ${\mathcal{N}}_{2}$
for dissipative particles, see figure 12(b). Moreover, the DSMC simulation data for
 ${\mathcal{N}}_{2}$
(b) and the shear viscosity in figure 12(c) lend unequivocal support for AME theory for highly inelastic particles at small but finite values of
 $St$
.
5.2 From sheared suspension to ‘dry’ (
$St\rightarrow \infty$
) granular gas

To further understand the predictions of normal-stress differences (
 ${\mathcal{N}}_{1}$
and
 ${\mathcal{N}}_{2}$
) from two theories (GME and AME) for dissipative particles (
 $e<1$
), we focus on the uniform shear flow of a dilute granular gas (
 $St\rightarrow \infty$
) – the molecular-dynamics (MD) simulations of inelastic hard spheres with Lees–Edward boundary conditions have been carried out for a range of restitution coefficient at a particle volume fraction of
 $\unicode[STIX]{x1D708}=0.01$
; a relatively small system with
 $N=1000$
particles was simulated – other simulation details can be found in Alam & Luding (Reference Alam, Luding, Garcia-Rojo, Herrmann and McNamara2005) and Gayen & Alam (Reference Gayen and Alam2008). From these simulations, it is easy to extract data on two anisotropy parameters, namely, (i) the shear-plane temperature anisotropy
 $\unicode[STIX]{x1D702}$
(see (2.21)) and (ii) the excess temperature
 $T_{z}^{ex}/T=\unicode[STIX]{x1D706}^{2}$
(see (2.23)), which are marked by filled circles in figures 13(a) and 13(b), respectively. In each panel, the theoretical predictions of Saha & Alam (Reference Saha and Alam2016a
) are shown by solid lines. Overall, there is excellent agreement between AME theory and MD simulation.
Comparisons of (a) shear-plane temperature-anisotropy
 $\unicode[STIX]{x1D702}$
and (b) the excess temperature
 $T_{z}^{ex}/T\equiv 2\unicode[STIX]{x1D706}^{2}$
in uniform shear flow of a granular gas (
 $St=\infty$
): MD simulation (symbols) and theory (solid line, Saha & Alam Reference Saha and Alam2016a
). The particle volume fraction is
 $\unicode[STIX]{x1D708}=0.01$
and the number of particles is
 $N=1000$
in simulations.

Figure 14(a,b) compare the MD simulation data (symbols) for
 ${\mathcal{N}}_{1}$
and
 ${\mathcal{N}}_{2}$
, respectively, with theory; the AME predictions, denoted by solid lines, are calculated from (4.18) and (4.19) by setting
 $St\rightarrow \infty$
(Saha & Alam Reference Saha and Alam2016a
), and the corresponding GME predictions (appendix H) are denoted by dashed lines. In addition, the dot-dashed line in each panel represents the Burnett-order solution of Sela & Goldhirsch (Reference Sela and Goldhirsch1998),
 $$\begin{eqnarray}\left.\begin{array}{@{}rcl@{}}{\mathcal{N}}_{1} & = & {\displaystyle \frac{1.673496(1-e^{2})-0.04315584(1-e^{2})^{2}}{1.2996+0.0966(1-e^{2})}}\\ {\mathcal{N}}_{2} & = & -{\displaystyle \frac{0.14189(1-e^{2})-0.00365904(1-e^{2})^{2}}{1.2996+0.0966(1-e^{2})}}\end{array}\right\}\end{eqnarray}$$
obtained from the Chapman–Enskog expansion of inelastic Boltzmann equation – the related details are given in appendix I (supplementary materials). It is clear that both GME and AME theories predict almost the same value of
 ${\mathcal{N}}_{1}$
for a range of restitution coefficient
 $e\in (0.3,1)$
, but the GME prediction for
 ${\mathcal{N}}_{2}$
is consistently lower than that of AME and can be off by a factor of 3 at
 $e=0.3$
. On the other hand, the AME predictions for both
 ${\mathcal{N}}_{1}$
and
 ${\mathcal{N}}_{2}$
are comparable to those of Chapman–Enskog solution for
 $e\geqslant 0.8$
, but the latter becomes increasingly inaccurate for
 $e<0.8$
. It is clear from figure 14 that, for a granular gas (
 $St\rightarrow \infty$
), the present theory provides excellent quantitative agreement for
 ${\mathcal{N}}_{1}$
and
 ${\mathcal{N}}_{2}$
with simulation data for all
 $e$
.
Comparisons of (a)
 ${\mathcal{N}}_{1}$
and (b)
 ${\mathcal{N}}_{2}$
in uniform shear flow of a granular gas (
 $St=\infty$
): (i) MD simulation (symbols), (ii) present theory (solid lines, Saha & Alam Reference Saha and Alam2016a
) and (iii) standard Grad’s moment theory (dashed line). The dot-dash line in each panel represent the Burnett-order Chapman–Enskog solution of Sela & Goldhirsch (Reference Sela and Goldhirsch1998), see appendix I. Parameter values as in figure 13.

5.3 Superior prediction of AME theory: a ‘non-perturbative’ theory for USF
It must noted that, except for figure 2(a) (for
 $e=1$
), the comparisons between theory and simulation (in figures 2 and 11–14) have been made only for the ‘ignited-state’ solution since the simulation data for the ‘quenched state’ of inelastic particles (
 $e<1$
) are not available. The above comparative analyses among different theories can be summarized as follows and hold for the ignited-state solution over a large range of
 $St$
.
The moment expansion about anisotropic Maxwellian yields accurate transport coefficients (shear viscosity and normal-stress differences) for dissipative particles (
 $e<1$
) in both small and large Stokes number limits, representative of gas–solid and dry granular suspensions, respectively. The standard Grad’s moment expansion significantly under-predicts the value of the second normal-stress difference
 ${\mathcal{N}}_{2}$
, although it is comparable with AME with respect to
 ${\mathcal{N}}_{1}$
up to a restitution coefficient of
 $e=0.5$
. On the other hand, the latter theory also over-predicts the shear viscosity on the ignited state (
 $\unicode[STIX]{x1D707}\propto \sqrt{T}$
, viz. figure 12
c) of small-
 $St$
suspensions even for moderately dissipative (
 $e=0.7$
) particles; the mismatch between GME and simulation increases with decreasing
 $e$
.
For the specific case of the dry granular gas, figure 14 along with our previous work (see Saha & Alam (Reference Saha and Alam2014, figures 10 and 11)) confirm that the predictions of the present AME theory on two normal-stress differences are better than those of Burnett-order Chapman–Enskog solution of Sela & Goldhirsch (Reference Sela and Goldhirsch1998). Therefore we conclude that the superior predictive ability of the AME theory for hydrodynamics and rheology of ‘dry’ (
 $St\rightarrow \infty$
) sheared granular gases (Saha & Alam Reference Saha and Alam2014, Reference Saha and Alam2016a
) carries over to small-
 $St$
gas–solid suspensions of highly inelastic particles.
The success of the anisotropic Maxwellian to predict accurate transport coefficients for highly inelastic system of a sheared suspension can be tied to the fact that no assumption is made about the ‘smallness’ of the shear rate. In fact, for the uniform shear flow, the analysis with anisotropic Maxwellian is ‘exact’ and holds for arbitrary shear rates (Jenkins & Richman Reference Jenkins and Richman1988; Richman Reference Richman1989); therefore, the resulting constitutive relations are expected to be valid at any shear rate as discussed in Saha & Alam (Reference Saha and Alam2014, Reference Saha and Alam2016a ). In contrast, the Grad moment expansion (Grad Reference Grad1949; Jenkins & Richman Reference Jenkins and Richman1985; Tsao & Koch Reference Tsao and Koch1995) around a Maxwellian can be tied to the Chapman–Enskog expansion (Chapman & Cowling Reference Chapman and Cowling1970) where the gradient terms are incorporated perturbatively. For example, Sela & Goldhirsch (Reference Sela and Goldhirsch1998) showed that the constitutive relations obtained from the thirteen-moment theory of Jenkins & Richman (Reference Jenkins and Richman1985) are almost identical with those obtained from the Burnett-order Chapman–Enskog solution.
In conclusion, the ‘anisotropic Maxwellian’ (2.13) provides an exact ‘non-perturbative’ theory for uniform shear flow within the assumptions laid out in § 2.1. Therefore, the equivalence of the present AME theory with the ‘perturbative’ GME theory is expected only if the latter includes further higher-order fields in the perturbed distribution function (2.15).
6 Summary and conclusion
The rheology of a dilute gas–solid suspension, consisting of inelastic spheres suspended in a Newtonian fluid undergoing simple shear flow is analysed, with the effect of the gas phase being modelled via a Stokesian drag force. The pertinent inelastic Boltzmann equation is solved using an anisotropic Maxwellian as the single particle distribution function which is known to be appropriate for a sheared system. The resulting hydrodynamic model for the particle phase consists of a ten-moment system
 $(\unicode[STIX]{x1D70C},\boldsymbol{u},\unicode[STIX]{x1D648})$
of density (
 $\unicode[STIX]{x1D70C}$
), hydrodynamic velocity (
 $\boldsymbol{u}$
) and the second moment (
 $\unicode[STIX]{x1D648}=\langle \boldsymbol{C}\boldsymbol{C}\rangle$
) of fluctuation/peculiar velocity. Unlike in all previous studies on gas–solid suspensions, one focus of the present work has been to analyse the anisotropy of
 $\unicode[STIX]{x1D648}$
in the simple shear flow of a dilute gas–solid suspension and subsequently tie and explain the rheological quantities in terms of them.
The second-moment tensor has been characterized by three parameters (Richman Reference Richman1989; Saha & Alam Reference Saha and Alam2016a
): (i) the non-coaxiality angle (
 $\unicode[STIX]{x1D719}$
, the angle between the principal eigen-direction of
 $\unicode[STIX]{x1D648}$
and the shear tensor
 $\unicode[STIX]{x1D63F}$
), (ii) the shear-plane temperature anisotropy (
 $\unicode[STIX]{x1D702}$
, the difference between the principal eigenvalues of
 $\unicode[STIX]{x1D648}$
on the shear plane,
 $\unicode[STIX]{x1D702}\propto T_{x}-T_{y}$
, where
 $T_{i}$
is the granular temperature along
 $i$
th direction) and (iii) the excess temperature (
 $\unicode[STIX]{x1D706}^{2}\propto T-T_{z}$
) along the vorticity direction; the first two (
 $\unicode[STIX]{x1D719}$
and
 $\unicode[STIX]{x1D702}$
) are dubbed ‘shear-plane’ anisotropies and the last one (
 $\unicode[STIX]{x1D706}^{2}$
) is dubbed vorticity-plane anisotropy. The closed-form expressions for three anisotropy parameters (
 $\unicode[STIX]{x1D719}$
,
 $\unicode[STIX]{x1D702}$
,
 $\unicode[STIX]{x1D706}^{2}$
) and the granular temperature (
 $T$
) have been obtained as functions of the Stokes number (
 $St$
), the mean density (
 $\unicode[STIX]{x1D708}$
) and the restitution coefficient (
 $e$
) by solving the second-moment balance equation; these are used to obtain analytical expressions for the particle-phase viscosity and two normal-stress differences. Scaling relations have been obtained in the limits of small and large
 $St$
as well as small inelasticity
 $(1-e)$
.
Static multiple states of high and low temperatures are found when the Stokes number is small enough, thereby recovering the original ‘ignited’ (
 $I$
) and ‘quenched’ (
 $Q$
) states of Tsao & Koch (Reference Tsao and Koch1995) – the role of inelasticity on these states has been examined. The high-temperature ignited state, in which the randomness of the particle motion is high giving rise to a large value of granular temperature (
 $T$
), exists above some minimum Stokes number
 $(St_{c_{1}})$
whose value increases with decreasing
 $e$
. In contrast, the low-temperature quenched state, in which most of the particles in the system follow the local fluid velocity, appears below a critical value of Stokes number
 $(St_{c_{2}})$
which is a decreasing function of both
 $e$
and
 $\unicode[STIX]{x1D708}$
. Both these Stokes numbers (
 $St_{c_{1}}$
and
 $St_{c_{2}}$
) have been determined analytically as functions of
 $\unicode[STIX]{x1D708}$
and
 $e$
, and the regions of co-existence of two states (quenched and ignited) along with the transition regimes have been identified in a three-dimensional (
 $St,e,\unicode[STIX]{x1D708}$
) phase diagram.
The effect of inelasticity is found to reduce the particle-phase viscosity on both ignited and quenched states, with shear-thickening behaviour (increasing viscosity with increasing shear rate) being found in both states. At any
 $e$
, the shear viscosity undergoes a discontinuous jump with increasing
 $St$
at ‘
 $Q\rightarrow I$
’ transition, which can be interpreted as an analogue of ‘discontinuous shear thickening’. The two normal-stress differences also undergo similar first-order jump transitions: (i)
 ${\mathcal{N}}_{1}$
from large to small positive values and (ii)
 ${\mathcal{N}}_{2}$
from positive to negative values. The sign change of
 ${\mathcal{N}}_{2}$
(figure 10) has been identified with the system being making a ‘
 $Q\leftrightarrow I$
’ transition. The origin of this sign change has been tied to a competition between (i) the excess temperature (
 $T_{z}^{ex}\propto 3\unicode[STIX]{x1D706}^{2}$
) and (ii) the shear-plane anisotropies (
 $\unicode[STIX]{x1D702}\sin 2\unicode[STIX]{x1D719}\equiv {\mathcal{N}}_{1}/2$
) of the second-moment tensor: while the former dominates over the latter in the quenched state, the latter dominates in the ignited state, resulting in the sign change of
 ${\mathcal{N}}_{2}$
at some finite value of
 $St$
. For both granular and gas–solid suspensions, the excess temperature along the vorticity direction is responsible for the origin of
 ${\mathcal{N}}_{2}\neq 0$
, while the temperature anisotropy
 $\unicode[STIX]{x1D702}$
and the non-coaxiality angle
 $\unicode[STIX]{x1D719}$
are responsible for
 ${\mathcal{N}}_{1}\neq 0$
.
From the comparison of different variants of theories (§ 5), we found that the quantitative predictions of the present AME (anisotropic-Maxwellian expansion) theory for two normal-stress differences as well as for the shear viscosity are better than those of GME (Grad moment expansion) and Chapman–Enskog solution – this conclusion holds for both gas–solid and dry granular suspensions of inelastic particles. The anisotropic-Maxwellian distribution function is known to be yield accurate transport coefficients for highly inelastic system of a sheared granular fluid since no assumption is made about the smallness of the shear rate (Saha & Alam Reference Saha and Alam2014, Reference Saha and Alam2016a ) unlike in the standard GME around a Maxwellian (which incorporates only leading-order gradient terms). The success of anisotropic Maxwellian (2.13) for both granular and gas–solid suspensions is tied to the fact that the AME is an exact ‘non-perturbative’ theory for uniform shear flow, valid at arbitrary shear rate, within the assumptions laid out in § 2.1.
It would be interesting to check the applicability of this theory to dense gas–solid suspensions of inelastic particles (with frictional interactions) which can be taken up in future. The present work can also be extended to include a ‘nonlinear’ drag law (dependence on particle Reynolds number) by modifying (2.3) via well-known empirical correlations. Lastly, the anisotropies (
 $\unicode[STIX]{x1D719},\unicode[STIX]{x1D702},\unicode[STIX]{x1D706}^{2}$
) of the second-moment tensor should be measured from simulations of finite-
 $St$
suspensions so that one-to-one comparisons with theory can be made in this regard.
Acknowledgements
S.S. acknowledges the PhD-fellowship (2011–2016) from the ‘Council of Scientific and Industrial Research’ (CSIR), Government of India. The research activity of M.A. on ‘gas–solid suspensions’ is funded by the Department of Science and Technology under ‘India-Netherlands’ project (Ref.: DST/INT/NL/P-03/2016). We sincerely thank the editor (Professor O. Pouliquen) for a swift handling of this paper.
Supplementary materials
Supplementary materials are available at https://doi.org/10.1017/jfm.2017.722.
Appendix A. Maximum entropy principle and the anisotropic-Maxwellian distribution function
Here we show that the anisotropic-Maxwellian distribution function (2.13) follows from the maximum entropy principle (Jaynes Reference Jaynes1957). Let us write down the definitions of the
 $10$
hydrodynamic fields:
 $$\begin{eqnarray}\left.\begin{array}{@{}rcl@{}}\unicode[STIX]{x1D70C}(\boldsymbol{x},t)\, & \equiv \, & mn(\boldsymbol{x},t)=m\displaystyle \int f(\boldsymbol{c},\boldsymbol{x},t)\,\text{d}\boldsymbol{c}\\ \boldsymbol{u}(\boldsymbol{x},t)\, & \equiv \, & \langle \boldsymbol{c}\rangle ={\displaystyle \frac{1}{n(\boldsymbol{x},t)}}\displaystyle \int \boldsymbol{c}f(\boldsymbol{c},\boldsymbol{x},t)\,\text{d}\boldsymbol{c}\\ \unicode[STIX]{x1D648}(\boldsymbol{x},t)\, & \equiv \, & \langle \boldsymbol{C}\boldsymbol{C}\rangle ={\displaystyle \frac{1}{n(\boldsymbol{x},t)}}\displaystyle \int \boldsymbol{C}\boldsymbol{C}f(\boldsymbol{c},\boldsymbol{x},t)\,\text{d}\boldsymbol{c}.\end{array}\right\}\end{eqnarray}$$
The optimum distribution function
 $f$
is such that it maximizes the uncertainty about the velocity, subject to the compatibility conditions of relevant hydrodynamic fields given in (A 1). The entropy is defined as
 $$\begin{eqnarray}S=-\hspace{-4.0pt}\int f(\boldsymbol{c},\boldsymbol{x},t)\ln f(\boldsymbol{c},\boldsymbol{x},t)\,\text{d}\boldsymbol{c},\end{eqnarray}$$
which is the nothing but the negative of Boltzmann’s
 $H$
function (Chapman & Cowling Reference Chapman and Cowling1970). The optimum distribution function is the one which maximizes the entropy (A 2) subject to the constraints (A 1).
The variation of entropy can be written as
 $$\begin{eqnarray}\unicode[STIX]{x1D6FF}S=-\hspace{-4.0pt}\int \unicode[STIX]{x1D6FF}f\underbrace{(\ln f+1-\unicode[STIX]{x1D6FC}-\unicode[STIX]{x1D6FC}_{i}c_{i}-\unicode[STIX]{x1D6FC}_{ij}C_{i}C_{j})}_{}\text{d}\boldsymbol{c},\end{eqnarray}$$
where
 $\unicode[STIX]{x1D6FC}$
,
 $\unicode[STIX]{x1D6FC}_{i}$
and
 $\unicode[STIX]{x1D6FC}_{ij}$
are Lagrange multipliers. For a maximum value of
 $S$
, the variation
 $\unicode[STIX]{x1D6FF}S$
must be equal to zero. The vanishing of
 $\unicode[STIX]{x1D6FF}S$
for an arbitrary choice of
 $\unicode[STIX]{x1D6FF}f$
implies vanishing of the under-braced term in (A 3) as well, which yields
 $$\begin{eqnarray}f=\exp (\unicode[STIX]{x1D6FC}-1+\unicode[STIX]{x1D6FC}_{i}c_{i}+\unicode[STIX]{x1D6FC}_{ij}C_{i}C_{j}).\end{eqnarray}$$
The solutions for the 10 Lagrange multipliers
 $\{\unicode[STIX]{x1D6FC},\unicode[STIX]{x1D6FC}_{i},\unicode[STIX]{x1D6FC}_{ij}\}$
appearing in (A 4) follow from (A 1):
 $$\begin{eqnarray}\unicode[STIX]{x1D6FC}=1+\ln n-{\textstyle \frac{1}{2}}\ln (8\unicode[STIX]{x03C0}^{3}|\unicode[STIX]{x1D648}|),\quad \unicode[STIX]{x1D6FC}_{i}=0,\quad \text{and}\quad \unicode[STIX]{x1D6FC}_{ij}=-{\textstyle \frac{1}{2}}(\unicode[STIX]{x1D648}^{-1})_{ij}.\end{eqnarray}$$
Using this, we obtain the final form of the distribution function
 $$\begin{eqnarray}f(\boldsymbol{C};\boldsymbol{x},t)=\frac{n}{(8\unicode[STIX]{x03C0}^{3}|\unicode[STIX]{x1D648}|)^{1/2}}\exp \left(-\frac{1}{2}\boldsymbol{C}\boldsymbol{\cdot }\unicode[STIX]{x1D648}^{-1}\boldsymbol{\cdot }\boldsymbol{C}\right),\end{eqnarray}$$
which is nothing but the anisotropic-Maxwell distribution function (2.13) chosen in § 2.1. This form (A 6) was originally used by Holway (Reference Holway1966) to rectify certain problems of the BGK (Bhatnagar–Gross–Krook) model in rarefied gas dynamics.
A pertinent question here is whether the distribution function of a sheared system can be approximated by (A 6). In this regard, we note that the molecular dynamics simulations of a sheared dilute granular gas (Gayen & Alam Reference Gayen and Alam2008) suggest that the low-velocity region of the distribution function closely follows a Gaussian if the anisotropic temperature (
 $T_{x}\neq T_{y}\neq T_{z}$
) is used to normalize the fluctuating velocity field. The latter finding points towards a ‘tri-axial’ Maxwellian (Goldreich & Tremaine Reference Goldreich and Tremaine1978) as the leading-order distribution function for a homogeneously sheared system. (A tri-axial Maxwellian is one whose diagonal elements are unequal, which can be obtained from (A 6) via standard diagonalization procedure.) On the other hand, the high-velocity tails of the distribution function were found to follow stretched exponentials (Gayen & Alam Reference Gayen and Alam2008), the degree of its deviation (from the Maxwellian exponent of 2) was found to increase with increasing inelasticity. Possible impact of such ‘low probability’ tails on transport coefficients may appear at large dissipations, or, further higher-order moments of distribution functions may be affected quantitatively – this issue will not be further considered in the present paper.
Appendix B. Source terms in quenched and ignited states
Appendix B is available as supplementary materials.
Appendix C. Analysis in the ignited state for elastic hard spheres
For a gas–solid suspension of elastic hard spheres (
 $e=1$
), the collisional source of the second moment in the ignited state is given by
 $$\begin{eqnarray}\displaystyle \aleph _{\unicode[STIX]{x1D6FC}\unicode[STIX]{x1D6FD}}^{is} & = & \displaystyle \frac{-24\unicode[STIX]{x1D70C}_{p}\unicode[STIX]{x1D708}^{2}}{\unicode[STIX]{x1D70E}\unicode[STIX]{x03C0}^{3/2}}\int (k_{\unicode[STIX]{x1D6FC}}j_{\unicode[STIX]{x1D6FD}}+k_{\unicode[STIX]{x1D6FD}}j_{\unicode[STIX]{x1D6FC}})(\boldsymbol{k}\boldsymbol{\cdot }\unicode[STIX]{x1D648}\boldsymbol{\cdot }\boldsymbol{j})(\boldsymbol{k}\boldsymbol{\cdot }\unicode[STIX]{x1D648}\boldsymbol{\cdot }\boldsymbol{k})^{1/2}\,\text{d}\boldsymbol{k}\nonumber\\ \displaystyle & = & \displaystyle -\frac{32\unicode[STIX]{x1D70C}_{p}\unicode[STIX]{x1D708}^{2}T^{3/2}}{35\unicode[STIX]{x1D70E}\sqrt{\unicode[STIX]{x03C0}}}\nonumber\\ \displaystyle & & \displaystyle \times \left[\begin{array}{@{}ccc@{}}\unicode[STIX]{x1D702}^{2}+21\unicode[STIX]{x1D706}^{2}+21\unicode[STIX]{x1D702}\sin 2\unicode[STIX]{x1D719} & -21\unicode[STIX]{x1D702}\cos 2\unicode[STIX]{x1D719} & 0\\ -21\unicode[STIX]{x1D702}\cos 2\unicode[STIX]{x1D719} & \unicode[STIX]{x1D702}^{2}+21\unicode[STIX]{x1D706}^{2}-21\unicode[STIX]{x1D702}\sin 2\unicode[STIX]{x1D719} & 0\\ 0 & 0 & -2(\unicode[STIX]{x1D702}^{2}+21\unicode[STIX]{x1D706}^{2})\end{array}\right],\qquad\end{eqnarray}$$
which is a function of
 $\unicode[STIX]{x1D708}$
,
 $T$
,
 $\unicode[STIX]{x1D702}$
,
 $\unicode[STIX]{x1D719}$
and
 $\unicode[STIX]{x1D706}^{2}$
.
Four independent equations of second-moment balance,
 $$\begin{eqnarray}P_{\unicode[STIX]{x1D6FF}\unicode[STIX]{x1D6FD}}u_{\unicode[STIX]{x1D6FC},\unicode[STIX]{x1D6FF}}+P_{\unicode[STIX]{x1D6FF}\unicode[STIX]{x1D6FC}}u_{\unicode[STIX]{x1D6FD},\unicode[STIX]{x1D6FF}}+\frac{2\unicode[STIX]{x1D6FE}}{St}P_{\unicode[STIX]{x1D6FC}\unicode[STIX]{x1D6FD}}=\aleph _{\unicode[STIX]{x1D6FC}\unicode[STIX]{x1D6FD}}^{is},\end{eqnarray}$$
can be rearranged to yield a quartic-order equation,
 $$\begin{eqnarray}\unicode[STIX]{x1D714}^{2}[12096St^{2}\unicode[STIX]{x1D714}^{2}+(10260St-420St^{3})\unicode[STIX]{x1D714}+3225-175St^{2}]=0,\end{eqnarray}$$
where
 $\unicode[STIX]{x1D714}$
is the rescaled temperature
 $$\begin{eqnarray}\unicode[STIX]{x1D714}=\frac{\unicode[STIX]{x1D708}}{\sqrt{\unicode[STIX]{x03C0}}}\frac{\sqrt{T}}{(\dot{\unicode[STIX]{x1D6FE}}\unicode[STIX]{x1D70E}/2)}.\end{eqnarray}$$
In the following, the temperature has been made dimensionless by dividing it by
 $(\dot{\unicode[STIX]{x1D6FE}}\unicode[STIX]{x1D70E}/2)^{2}$
. Three distinct solutions of (C 3) are
 $$\begin{eqnarray}\displaystyle & \displaystyle \sqrt{T_{is}}=\frac{5\unicode[STIX]{x03C0}^{1/2}}{144}\frac{St}{\unicode[STIX]{x1D708}}\unicode[STIX]{x1D6FA}(St), & \displaystyle\end{eqnarray}$$
 $$\begin{eqnarray}\displaystyle & \displaystyle \sqrt{T_{us}}=\frac{5\unicode[STIX]{x03C0}^{1/2}}{144}\frac{St}{\unicode[STIX]{x1D708}}\left[\frac{7St^{2}-171-\sqrt{49St^{4}-42St^{2}-14103}}{14St^{2}}\right], & \displaystyle\end{eqnarray}$$
 $$\begin{eqnarray}\displaystyle & \displaystyle T_{qs}=0, & \displaystyle\end{eqnarray}$$
with
 $T_{is}>T_{us}>T_{qs}$
, where
 $$\begin{eqnarray}\unicode[STIX]{x1D6FA}(St)=\left[\frac{7St^{2}-171+\sqrt{49St^{4}-42St^{2}-14103}}{14St^{2}}\right]\equiv \frac{144}{5}\unicode[STIX]{x1D714}_{is}St^{-1}.\end{eqnarray}$$
In the above expressions,
 $T_{qs}$
corresponds to the quenched-state temperature,
 $T_{us}$
corresponds to an unstable temperature and
 $T_{is}$
corresponds to the temperature in the ignited state. It is clear from (C 6) that a positive value for
 $T_{us}$
requires the following condition on the Stokes number:
 $$\begin{eqnarray}7St^{2}-171\geqslant 0,\quad \Rightarrow \quad St\geqslant \sqrt{\frac{171}{7}}\approx 4.9425\equiv St_{c_{1}}.\end{eqnarray}$$
Therefore,
 $St$
must be greater than or equal to
 $St_{c_{1}}$
, and (C 9) provides a lower bound on
 $St$
for the existence of the ignited state in a dilute sheared gas–solid suspension.
The remaining equations of (C 2) can be solved to yield solutions for
 $\unicode[STIX]{x1D702}^{2}$
and
 $\unicode[STIX]{x1D706}^{2}$
in the ignited state:
 $$\begin{eqnarray}\left.\begin{array}{@{}rcl@{}}\unicode[STIX]{x1D702}^{2}\, & =\, & {\displaystyle \frac{(9+\unicode[STIX]{x1D6FA}St^{2})}{4\left(1+{\displaystyle \frac{29}{84}}\unicode[STIX]{x1D6FA}St^{2}+{\displaystyle \frac{1}{36}}\unicode[STIX]{x1D6FA}^{2}St^{4}\right)}}\\ \unicode[STIX]{x1D706}^{2}\, & =\, & {\displaystyle \frac{(7+\unicode[STIX]{x1D6FA}St^{2})}{14\left(1+{\displaystyle \frac{29}{84}}\unicode[STIX]{x1D6FA}St^{2}+{\displaystyle \frac{1}{36}}\unicode[STIX]{x1D6FA}^{2}St^{4}\right)}}\end{array}\right\};\end{eqnarray}$$
the solution for the non-coaxiality angle is
 $$\begin{eqnarray}\sin (2\unicode[STIX]{x1D719})=\frac{\unicode[STIX]{x1D702}}{1+\unicode[STIX]{x1D706}^{2}}.\end{eqnarray}$$
Therefore, the normal-stress differences in the ignited state are given by
 $$\begin{eqnarray}\displaystyle & \displaystyle {\mathcal{N}}_{1}=\frac{15}{5+24St\unicode[STIX]{x1D714}}\equiv \frac{18}{6+\unicode[STIX]{x1D6FA}St^{2}}, & \displaystyle\end{eqnarray}$$
 $$\begin{eqnarray}\displaystyle & \displaystyle -{\mathcal{N}}_{2}=\frac{270St\unicode[STIX]{x1D714}(5+16St\unicode[STIX]{x1D714})}{(5+24St\unicode[STIX]{x1D714})(175+1740St\unicode[STIX]{x1D714}+4032St^{2}\unicode[STIX]{x1D714}^{2})}. & \displaystyle\end{eqnarray}$$
In the ignited state, the expression for the shear viscosity of the particle phase is
 $$\begin{eqnarray}\unicode[STIX]{x1D707}=-P_{xy}/\dot{\unicode[STIX]{x1D6FE}}=\unicode[STIX]{x1D707}_{N}\unicode[STIX]{x1D6FA}(St),\end{eqnarray}$$
where
 $$\begin{eqnarray}\unicode[STIX]{x1D707}_{N}=\frac{5\sqrt{\unicode[STIX]{x03C0}}}{96}\unicode[STIX]{x1D70C}_{p}\unicode[STIX]{x1D70E}\sqrt{T}\end{eqnarray}$$
is the Newtonian viscosity of a dilute gas. Therefore,
 $\unicode[STIX]{x1D6FA}(St)$
(C 8) is a measure of the deviation of particle-phase viscosity from the Newtonian viscosity of a dilute hard sphere gas.
Appendix D. Coefficients
$a_{i}$
in (3.1)

Appendix D is available as supplementary materials.
Appendix E. Ordering analysis to determine three temperatures and the limit of large shear rate
Appendices E.1–E.4 are available as supplementary materials.
Appendix F. Analytical determination of limit points
$St_{c_{1}}$
and
$St_{c_{2}}$


Appendix F is available as supplementary materials.
Appendix G. Suspension viscosity and connection with other works
Appendices G.1 and G.2 are available as supplementary materials.
Appendix H. Grad moment expansion for inelastic gas–solid suspension
The standard Grad moment expansion in terms of a truncated Hermite series around the Maxwellian (Grad Reference Grad1949) has been employed by many researchers (Herdegen & Hess Reference Herdegen and Hess1982; Jenkins & Richman Reference Jenkins and Richman1985; Tsao & Koch Reference Tsao and Koch1995; Sangani et al. Reference Sangani, Mo, Tsao and Koch1996; Chamorro et al. Reference Chamorro, Reyes and Garzo2015) to analyse the Boltzmann equation for a ‘sheared’ hard sphere gas as well as gas–solid suspensions.
-
(i) Herdegen & Hess (Reference Herdegen and Hess1982)
$\Rightarrow e=1$
,
$St=\infty$
(dilute gas of elastic hard spheres) -
(ii) Jenkins & Richman (Reference Jenkins and Richman1985)
$\Rightarrow e\neq 1$
,
$St=\infty$
(dense gas of inelastic hard spheres) -
(iii) Tsao & Koch (Reference Tsao and Koch1995)
$\Rightarrow e=1$
,
$St$
finite (dilute suspension of elastic hard spheres) -
(iv) Sangani et al. (Reference Sangani, Mo, Tsao and Koch1996)
$\Rightarrow e\neq 1$
,
$St$
finite (dense suspension of inelastic hard spheres) -
(v) Chamorro et al. (Reference Chamorro, Reyes and Garzo2015)
$\Rightarrow e\neq 1$
,
$St$
finite (dilute suspension with white noise)


For the case of a dilute gas–solid suspension of ‘inelastic’ hard spheres, the collisional production term of the second moment has been evaluated as:
 $$\begin{eqnarray}\displaystyle \aleph _{\unicode[STIX]{x1D6FC}\unicode[STIX]{x1D6FD}} & = & \displaystyle -\frac{8\unicode[STIX]{x1D70C}_{p}\unicode[STIX]{x1D708}^{2}(1-e^{2})T^{3/2}}{\sqrt{\unicode[STIX]{x03C0}}\unicode[STIX]{x1D70E}}\unicode[STIX]{x1D6FF}_{\unicode[STIX]{x1D6FC}\unicode[STIX]{x1D6FD}}-\frac{24\unicode[STIX]{x1D708}(1+e)(3-e)T^{1/2}}{5\sqrt{\unicode[STIX]{x03C0}}\unicode[STIX]{x1D70E}}P_{\langle \unicode[STIX]{x1D6FC}\unicode[STIX]{x1D6FD}\rangle }\nonumber\\ \displaystyle & & \displaystyle +\,\frac{(1+e)}{35\sqrt{\unicode[STIX]{x03C0}}\unicode[STIX]{x1D70E}\unicode[STIX]{x1D70C}_{p}T^{1/2}}\text{}\underline{\{(5+3e)P_{\langle kl\rangle }P_{\langle kl\rangle }\unicode[STIX]{x1D6FF}_{\unicode[STIX]{x1D6FC}\unicode[STIX]{x1D6FD}}+12(e-3)P_{\langle \unicode[STIX]{x1D6FC}l\rangle }P_{\langle l\unicode[STIX]{x1D6FD}\rangle }\}},\end{eqnarray}$$
where the underlined terms represent the quadratic nonlinearity in the pressure deviator
 $P_{\langle \unicode[STIX]{x1D6FC}\unicode[STIX]{x1D6FD}\rangle }=P_{\unicode[STIX]{x1D6FC}\unicode[STIX]{x1D6FD}}-p\unicode[STIX]{x1D6FF}_{\unicode[STIX]{x1D6FC}\unicode[STIX]{x1D6FD}}$
, with
 $p=P_{\unicode[STIX]{x1D6FC}\unicode[STIX]{x1D6FC}}/3$
;
 $\unicode[STIX]{x1D70C}_{p}=m/(\unicode[STIX]{x03C0}\unicode[STIX]{x1D70E}^{3}/6)$
is the intrinsic/material density of particles,
 $\unicode[STIX]{x1D708}$
is the particle volume fraction and
 $e$
is the restitution coefficient. In fact, the second normal-stress difference is zero (
 ${\mathcal{N}}_{2}=0$
) in the absence of the underlined nonlinear terms in (H 1), see the proof at the end of this appendix.
Defining the non-dimensional quantities as
 $$\begin{eqnarray}\displaystyle P^{\ast }=\frac{P}{\unicode[STIX]{x1D70C}_{p}\unicode[STIX]{x1D708}(\dot{\unicode[STIX]{x1D6FE}}\unicode[STIX]{x1D70E}/2)^{2}},\quad T^{\ast }=\frac{T}{(\dot{\unicode[STIX]{x1D6FE}}\unicode[STIX]{x1D70E}/2)^{2}},\quad \aleph ^{\ast }=\frac{\aleph }{\unicode[STIX]{x1D70C}_{p}\unicode[STIX]{x1D708}\dot{\unicode[STIX]{x1D6FE}}^{3}(\unicode[STIX]{x1D70E}/2)^{2}}, & & \displaystyle\end{eqnarray}$$
and on omitting the
 $\ast$
signs, for convenience, the dimensionless second-moment balance for steady homogeneous shear flow,
 $$\begin{eqnarray}\displaystyle P_{\unicode[STIX]{x1D6FF}\unicode[STIX]{x1D6FD}}u_{\unicode[STIX]{x1D6FC},\unicode[STIX]{x1D6FF}}+P_{\unicode[STIX]{x1D6FF}\unicode[STIX]{x1D6FC}}u_{\unicode[STIX]{x1D6FD},\unicode[STIX]{x1D6FF}}+\frac{2}{St}P_{\unicode[STIX]{x1D6FC}\unicode[STIX]{x1D6FD}}=\aleph _{\unicode[STIX]{x1D6FC}\unicode[STIX]{x1D6FD}}, & & \displaystyle\end{eqnarray}$$
can be written in component form as follows:
 $$\begin{eqnarray}\displaystyle & & \displaystyle (1+e)(5+3e)(P_{\langle xx\rangle }^{2}+P_{\langle yy\rangle }^{2}+P_{\langle zz\rangle }^{2}+2P_{xy}^{2})-12(1+e)(3-e)(P_{\langle xx\rangle }^{2}+P_{xy}^{2})\qquad \nonumber\\ \displaystyle & & \displaystyle \quad -\,280(1-e^{2})T^{2}-168(1+e)(3-e)TP_{\langle xx\rangle }-\frac{140\sqrt{\unicode[STIX]{x03C0}}\sqrt{T}P_{xy}}{\unicode[STIX]{x1D708}}\nonumber\\ \displaystyle & & \displaystyle \quad -\,\frac{140\sqrt{\unicode[STIX]{x03C0}}\sqrt{T}}{\unicode[STIX]{x1D708}St}(T+P_{\langle xx\rangle })=0,\end{eqnarray}$$
 $$\begin{eqnarray}\displaystyle & & \displaystyle (1+e)(5+3e)(P_{\langle xx\rangle }^{2}+P_{\langle yy\rangle }^{2}+P_{\langle zz\rangle }^{2}+2P_{xy}^{2})-12(1+e)(3-e)(P_{\langle yy\rangle }^{2}+P_{xy}^{2})\nonumber\\ \displaystyle & & \displaystyle \quad -\,280(1-e^{2})T^{2}-168(1+e)(3-e)TP_{\langle yy\rangle }-\frac{140\sqrt{\unicode[STIX]{x03C0}}\sqrt{T}}{\unicode[STIX]{x1D708}St}(T+P_{\langle yy\rangle })=0,\qquad\end{eqnarray}$$
 $$\begin{eqnarray}\displaystyle & & \displaystyle (1+e)(5+3e)(P_{\langle xx\rangle }^{2}+P_{\langle yy\rangle }^{2}+P_{\langle zz\rangle }^{2}+2P_{xy}^{2})-12(1+e)(3-e)P_{\langle zz\rangle }^{2}\nonumber\\ \displaystyle & & \displaystyle \quad -\,280(1-e^{2})T^{2}-168(1+e)(3-e)TP_{\langle zz\rangle }-\frac{140\sqrt{\unicode[STIX]{x03C0}}\sqrt{T}}{\unicode[STIX]{x1D708}St}(T+P_{\langle zz\rangle })=0,\qquad\end{eqnarray}$$
 $$\begin{eqnarray}\displaystyle & & \displaystyle 12(1+e)(3-e)P_{xy}P_{\langle zz\rangle }-168(1+e)(3-e)TP_{xy}-\frac{70\sqrt{\unicode[STIX]{x03C0}}\sqrt{T}}{\unicode[STIX]{x1D708}}(T+P_{\langle yy\rangle })\qquad \nonumber\\ \displaystyle & & \displaystyle \quad -\,\frac{140\sqrt{\unicode[STIX]{x03C0}}T^{1/2}}{\unicode[STIX]{x1D708}St}P_{xy}=0,\end{eqnarray}$$
along with constraint
 $\widehat{P}_{\unicode[STIX]{x1D6FC}\unicode[STIX]{x1D6FC}}=0$
. These equations have been solved numerically for specified values of
 $e$
,
 $St$
and
 $\unicode[STIX]{x1D708}$
to yield
 $T$
,
 $P_{\langle \unicode[STIX]{x1D6FC}\unicode[STIX]{x1D6FC}\rangle }$
and
 $P_{xy}$
; two normal-stress differences
 ${\mathcal{N}}_{1}$
and
 ${\mathcal{N}}_{2}$
can be expressed in terms of
 $P_{\langle \unicode[STIX]{x1D6FC}\unicode[STIX]{x1D6FC}\rangle }$
. These are dubbed ‘GME’ solutions and their comparisons with the present theory (§ 4) based on anisotropic-Maxwellian expansion are shown in figures 11, 12 and 14, as discussed in §§ 5.1 and 5.2.
Theorem 1. The source term is uniquely decomposed as
 $\aleph _{\unicode[STIX]{x1D6FC}\unicode[STIX]{x1D6FD}}=(1/3\aleph _{\unicode[STIX]{x1D6FE}\unicode[STIX]{x1D6FE}})\unicode[STIX]{x1D6FF}_{\unicode[STIX]{x1D6FC}\unicode[STIX]{x1D6FD}}+\aleph _{\langle \unicode[STIX]{x1D6FC}\unicode[STIX]{x1D6FD}\rangle }$
. If
 $\aleph _{\langle \unicode[STIX]{x1D6FC}\unicode[STIX]{x1D6FD}\rangle }=BP_{\langle \unicode[STIX]{x1D6FC}\unicode[STIX]{x1D6FD}\rangle }$
, then
 ${\mathcal{N}}_{2}=0$
.
Proof. For the case of homogeneous shear
 $u_{x}=\dot{\unicode[STIX]{x1D6FE}}y$
,
 $u_{y}=0$
,
 $u_{z}=0$
; the balance of second moment for a granular gas is
 $$\begin{eqnarray}P_{\unicode[STIX]{x1D6FF}\unicode[STIX]{x1D6FD}}u_{\unicode[STIX]{x1D6FC},\unicode[STIX]{x1D6FF}}+P_{\unicode[STIX]{x1D6FF}\unicode[STIX]{x1D6FC}}u_{\unicode[STIX]{x1D6FD},\unicode[STIX]{x1D6FF}}=\aleph _{\unicode[STIX]{x1D6FC}\unicode[STIX]{x1D6FD}}.\end{eqnarray}$$
Now, upon substituting
 $\unicode[STIX]{x1D6FC}=2$
,
 $\unicode[STIX]{x1D6FD}=2$
and
 $\unicode[STIX]{x1D6FC}=3$
,
 $\unicode[STIX]{x1D6FD}=3$
we have
 $$\begin{eqnarray}\aleph _{22}=0=\aleph _{33}.\end{eqnarray}$$
From
 $P_{ij}=p\unicode[STIX]{x1D6FF}_{ij}+P_{\langle ij\rangle }$
, we can write
 $$\begin{eqnarray}{\mathcal{N}}_{2}=(P_{\langle 22\rangle }-P_{\langle 33\rangle })=B^{-1}(\aleph _{\langle 22\rangle }-\aleph _{\langle 33\rangle })=0.\end{eqnarray}$$
Of course, equation (H 10) is in contradiction with (i) the nonlinear expression (H 1) obtained from the standard Grad’s moment expansion as well as with (ii) our choice of anisotropic-Maxwellian distribution function, both yielding
 ${\mathcal{N}}_{2}\neq 0$
.
Appendix I. Burnett-order solution of Sela & Goldhirsch (Reference Sela and Goldhirsch1998)
Appendix I is available as supplementary materials.