1. Introduction
The gravity-driven motion of solid particles in a viscous fluid is a relevant process in a wide number of scientific and engineering applications (Guazzelli & Morris Reference Guazzelli and Morris2012). Among these we recall fluvial geomorphology and chemical engineering systems, as well as pollutant transport in underground water and settling of micro-organisms such as plankton.
The general problem of sedimentation is very complex due to the high number of factors on which it depends. Sedimentation involves large numbers of particles settling in different environments. The fluid in which the particles are suspended may be quiescent or turbulent. Particles may differ in size, shape, density and stiffness. The range of spatial and temporal scales involved is wide and the global properties of these suspensions can be substantially different from one case to another. Because of these complexities, our general understanding of the problem is still incomplete.
1.1. Settling in a quiescent fluid
One of the earliest investigations on the subject at hand is Stokes’ analysis of the sedimentation of a single rigid sphere through an unbounded quiescent viscous fluid at zero Reynolds number. This led to the well-known formula that links the settling velocity to the sphere radius, the solid to fluid density ratio and the viscosity of the fluid that bears his name. Later, the problem was studied both theoretically and experimentally. Hasimoto (Reference Hasimoto1959) obtained expressions for the drag force exerted by the fluid on three different cubic arrays of rigid spheres. These relate the drag force only to the solid volume fraction, but were derived under the assumption of very dilute suspensions and Stokes flow. The formulae were later revisited by Sangani & Acrivos (Reference Sangani and Acrivos1982). A different approach was instead pursued by Batchelor (Reference Batchelor1972), who found a relation between the mean settling velocity and the solid volume fraction by using conditional probability arguments. When the Reynolds number of the settling particles (
 $Re_{t}$
) becomes finite, the assumption of Stokes flow is less acceptable (especially for
 $Re_{t}>1$
). The fore–aft symmetry of the fluid flow around the particles is broken, and wakes form behind them. Solutions should be derived using the Navier–Stokes equations, but the nonlinearity of the inertial term makes the analytical treatment of such problems extremely difficult. For this reason, theoretical investigations have progressively given way to experimental and numerical approaches.
The first remarkable experimental results obtained for creeping flow were those by Richardson & Zaki (Reference Richardson and Zaki1954). These authors proposed an empirical formula relating the mean settling velocity of a suspension to its volume fraction and to the settling velocity of an isolated particle. This formula is believed to be accurate also for concentrated suspensions (up to a volume fraction
 ${\it\phi}$
of approximately 25 %) and for low Reynolds numbers. Subsequent investigations improved the formula so that it could also be applied in the intermediate-Reynolds-number regime (Garside & Al-Dibouni Reference Garside and Al-Dibouni1977; Di Felice Reference Di Felice1999).
Efficient algorithms and sufficient computational power have become available only relatively recently, and since then many different numerical methods have been used to improve our understanding of the problem (Prosperetti Reference Prosperetti2015). Among others we recall the dynamical simulations of Ladd (Reference Ladd1993), the finite-element simulations of Johnson & Tezduyar (Reference Johnson and Tezduyar1996), the force-coupling method simulations by Climent & Maxey (Reference Climent and Maxey2003), the lattice-Boltzmann simulations of Yin & Koch (Reference Yin and Koch2007), the Oseenlet simulations of Pignatel, Nicolas & Guazzelli (Reference Pignatel, Nicolas and Guazzelli2011) and the immersed boundary simulations of Kempe & Fröhlich (Reference Kempe and Fröhlich2012) and Uhlmann & Doychev (Reference Uhlmann and Doychev2014). Thanks to the most recent techniques it has become feasible to gain more insight into the interactions among the different phases and the resulting microstructure of the sedimenting suspension (Yin & Koch Reference Yin and Koch2007; Uhlmann & Doychev Reference Uhlmann and Doychev2014). Uhlmann & Doychev (Reference Uhlmann and Doychev2014), most recently, simulated the settling of dilute suspensions with particle Reynolds numbers in the range 140–260 and studied the effect of the Archimedes number (namely the ratio between gravitational and viscous forces) on the microscopic and macroscopic properties of the suspension. These authors observed an increase of the settling velocity at higher Archimedes number, due to particle clustering in a regime where the flow undergoes a steady bifurcation to an asymmetric wake. Settling in stratified environments has also been investigated experimentally, i.e. by Bush, Thurber & Blanchette (Reference Bush, Thurber and Blanchette2003), and numerically, i.e. by Doostmohammadi & Ardekani (Reference Doostmohammadi and Ardekani2015).
1.2. Sedimentation in an already turbulent flow
The investigations reported previously consider the settling of particles in quiescent or uniform flows. There are many situations though where the ambient fluid is in fact non-uniform or turbulent. As in the previous case, the first approach to this problem was analytical. In the late 1940s and 1950s Tchen (Reference Tchen1947) and later Corrsin & Lumley (Reference Corrsin and Lumley1956) proposed an equation for the motion of a small rigid sphere settling in a non-uniform flow. In the derivation, they assumed the particle Reynolds number to be very low so that the viscous Stokes drag for a sphere could be applied. The added mass and the augmented viscous drag due to a Basset history term were also included. Maxey & Riley (Reference Maxey and Riley1983) corrected these equations including also the Faxen forces due to the unsteady Stokes flow.
In a turbulent flow many different spatial and temporal scales are active. Therefore, the behaviour and motion of one single particle does not only depend on its dimensions and characteristic response time, but also on the ratios among these and the characteristic turbulent length and time scales. The turbulent quantities usually considered are the Kolmogorov length and time scales, which are related to the smallest eddies. Alternatively, the integral length scale and the eddy turnover time can also be used. It is clear that a particle smaller than the Kolmogorov length scale will behave differently from a particle of size comparable to the energetic flow structures. A sufficiently large particle with a characteristic time scale larger than the time scale of the velocity fluctuations will definitely be affected by and affect the turbulence. A smaller particle with a shorter relaxation time will more closely follow the turbulent fluctuations. When particle suspensions are considered, the situation becomes even more complicated. If the particles are solid, smaller than the Kolmogorov length scale and dilute, the turbulent flow field is unaltered (i.e. one-way coupling). Interestingly, the turbulent dynamics is instead altered by microbubbles. The presence of these microbubbles leads to relevant drag reduction in boundary layers and shear flows (e.g. Taylor–Couette flow) (Sugiyama, Calzavarini & Lohse Reference Sugiyama, Calzavarini and Lohse2008; Ceccio Reference Ceccio2010). If the mass of the dispersed phase is similar to that of the carrier phase, the influence of the solid phase on the fluid phase cannot be ignored (i.e. two-way coupling). Interactions among particles (such as collisions) must also be considered in concentrated suspensions. This last regime is described as four-way coupling (Elgobashi Reference Elgobashi1991; Balachandar & Eaton Reference Balachandar and Eaton2010).
Because of the difficulty of treating the problem analytically, the investigations of the last three decades have mostly been either experimental or numerical. In most of the numerical studies heavy and small particles were considered. The reader is referred to Toschi & Bodenschatz (Reference Toschi and Bodenschatz2009) for a more detailed review than the short summary reported here. Wang & Maxey (Reference Wang and Maxey1993) studied the settling of dilute heavy particles in homogeneous isotropic turbulence. The particle Reynolds number based on the relative velocity was assumed to be much less than unity so that the Stokes drag force could be used to determine the particle motion. These authors showed that heavy particles smaller than the Kolmogorov length scale tend to move outward from the centre of eddies and are often swept into regions of downdrafts (the so-called preferential sweeping later renamed fast tracking). In doing so, the particle mean settling velocity is increased with respect to that in a quiescent fluid. A series of studies confirmed and extended these results, examining particle clustering (Bec, Homann & Ray Reference Bec, Homann and Ray2014; Gustavsson, Vajedi & Mehlig Reference Gustavsson, Vajedi and Mehlig2014), preferential concentration (Aliseda et al. Reference Aliseda, Cartellier, Hainaux and Lasheras2002), the effects of the particle shape, orientation and collision rates (Siewert, Kunnen & Schröder Reference Siewert, Kunnen and Schröder2014), as well the effects of one- or two-way coupling algorithms (Bosse, Kleiser & Meiburg Reference Bosse, Kleiser and Meiburg2006), to mention a few aspects. Numerous experimental studies were also performed in order to confirm these results and to study the turbulence modulation due to the presence of particles (Hwang & Eaton Reference Hwang and Eaton2006).
The results on the mean settling velocities of particles of the order of or larger than the Kolmogorov scale are not conclusive. Good et al. (Reference Good, Ireland, Bewley, Bodenschatz, Collins and Warhaft2014) studied particles smaller than the Kolmogorov scale and with density ratio
 $O(1000)$
, whereas E. A. Variano (experiments; private communication, 2015) and Byron (Reference Byron2015) studied finite-size particles at density ratios comparable to ours. Good et al. (Reference Good, Ireland, Bewley, Bodenschatz, Collins and Warhaft2014) found that the mean settling velocity is reduced only when nonlinear drag corrections are considered in a one-way coupling approach when particles have a long relaxation time (a linear drag force would always lead to a settling velocity enhancement). For finite-size almost neutrally buoyant particles, Variano (private communication, 2015) and Byron (Reference Byron2015) observed instead that the mean settling velocity is smaller than in a quiescent fluid. In relative terms, the settling velocity decreases more and more as the ratio between the turbulence fluctuations and the terminal velocity of a single particle in a quiescent fluid increases. It is generally believed that the reduction of settling speed is due to the nonlinear relation between the particle drag and the Reynolds number. Nonetheless, unsteady and history effects may also play a key role (Bergougnoux et al.
Reference Bergougnoux, Bouchet, Lopez and Guazzelli2014; Olivieri et al.
Reference Olivieri, Picano, Sardina, Iudicone and Brandt2014). Tunstall & Houghton (Reference Tunstall and Houghton1968) had already demonstrated in 1968 that the average settling velocity is reduced in a flow oscillating about a zero mean, due to the interactions of the particle inertia with a nonlinear drag force. Stout, Arya & Genikhovich (Reference Stout, Arya and Genikhovich1995) tried to motivate these findings in terms of the relative motion between the fluid and the particles. When the period of the fluid velocity fluctuations is smaller than the particle response time, a significant relative motion is generated between the two phases. Due to the drag nonlinearity, appreciable upward forces can be produced on the particles, thereby reducing the mean settling velocity.
Unsteady effects may become important when considering suspensions with moderate particle–fluid density ratios, as suggested by Mordant & Pinton (Reference Mordant and Pinton2000) and Sobral, Oliveira & Cunha (Reference Sobral, Oliveira and Cunha2007). The former studied the motion of a solid sphere settling in a quiescent fluid experimentally and explained the transitory oscillations of the settling velocity found at
 $Re\approx O(100)$
by the presence of a transient vortex shedding in the particle wake. The latter, instead, analysed an equation similar to that proposed by Maxey & Riley (Reference Maxey and Riley1983), and suggested that unsteady hydrodynamic drags might become important when the density ratio approaches unity.
1.3. Fully resolved simulations
As already mentioned, most of the numerical studies of settling in turbulent flows used either one- or two-way coupling algorithms. In order to properly understand the microscopical phenomena at play, it would be ideal to use fully resolved simulations. An algorithm often used to accomplish this is the immersed boundary method with direct forcing for the simulation of particulate flows originally developed by Uhlmann (Reference Uhlmann2005). This code was later used to study the clustering of non-colloidal particles settling in a quiescent environment (Uhlmann & Doychev Reference Uhlmann and Doychev2014). With a similar method, Lucci, Ferrante & Elghobashi (Reference Lucci, Ferrante and Elghobashi2010) studied the modulation of isotropic turbulence by particles of Taylor length scale size. Recently, Homann, Bec & Grauer (Reference Homann, Bec and Grauer2013) used an immersed boundary Fourier-spectral method to study finite-size effects on the dynamics of single particles in turbulent flows. These authors found that the drag force on a particle suspended in a turbulent flow increases as a function of the turbulent intensity and the particle Reynolds number. We recently used a similar algorithm to examine turbulent channel flows of particle suspensions (Picano, Breugem & Brandt Reference Picano, Breugem and Brandt2015).
The aim of the present study is to simulate the sedimentation of a suspension of particles larger than the Kolmogorov length scale in homogeneous isotropic turbulence with a finite-difference immersed boundary method. We focus on particles slightly denser than the suspending fluid (
 ${\it\rho}_{p}/{\it\rho}_{f}=1.02$
) and investigate particle and fluid velocity statistics, nonlinear and unsteady contributions to the overall drag and turbulence modulation. The suspensions considered in this work are dilute (
 ${\it\phi}=0.5{-}1\,\%$
) and monodispersed. The same simulations are also performed in the absence of turbulence to appreciate differences in the particle velocity statistics in the two different environments. Due to the size of the particles considered it has been necessary to consider very long computational domains in the settling direction, especially for the quiescent environment. In the turbulent cases, smaller domains provide converged statistics since the particle wakes are disrupted more rapidly. The parameters of the simulations have been inspired by the experiments by Variano, Byron (Reference Byron2015) and co-workers at UC Berkeley. These authors investigated Taylor-scale particles in turbulent aquatic environments using refractive-index-matched hydrogel particles to measure particle linear and angular velocities.
Our results show that the mean settling velocity is lower in an already turbulent flow than in a quiescent fluid. The reductions are approximately 12 % and 14 % for the two volume fractions investigated. By looking at probability density functions (p.d.f.s) of the settling velocities, we observe that the p.d.f. is well approximated by a Gaussian function centred around the mean in the turbulent cases. In the laminar case, instead, the p.d.f. shows a smaller variance and a larger skewness, indicating that it is more probable to find particles settling more rapidly than the mean value rather than more slowly. These events are associated with particle–particle interactions, in particular with the drafting–kissing–tumbling motion of particle pairs. We also calculate mean relative velocity fields and notice that vortex shedding occurs around each particle in a turbulent environment. Using the concept of mean relative velocity we calculate a local Reynolds number and the mean drag coefficient from empirical formulae to quantify the importance of unsteady and history effects on the overall drag, thereby explaining the reduction in mean settling velocity. In fact, these terms become important only in a turbulent environment.
2. Methodology
2.1. Numerical algorithm
Different methods have been proposed in recent years to perform direct numerical simulations of multiphase flows. The Lagrangian–Eulerian algorithms are believed to be the most appropriate for solid–fluid suspensions (Ladd & Verberg Reference Ladd and Verberg2001; Lucci et al. Reference Lucci, Ferrante and Elghobashi2010; Zhang & Prosperetti Reference Zhang and Prosperetti2010; Uhlmann & Doychev Reference Uhlmann and Doychev2014). In the present study, simulations have been performed using a triperiodic version of the numerical code originally developed by Breugem (Reference Breugem2012) which models the coupling between the solid and fluid phases. The Eulerian fluid phase is evolved according to the incompressible Navier–Stokes equations,
 $$\begin{eqnarray}\displaystyle & \displaystyle \boldsymbol{{\rm\nabla}}\boldsymbol{\cdot }\boldsymbol{u}_{f}=0, & \displaystyle\end{eqnarray}$$
 $$\begin{eqnarray}\displaystyle & \displaystyle \frac{\partial \boldsymbol{u}_{f}}{\partial t}+\boldsymbol{u}_{f}\boldsymbol{\cdot }\boldsymbol{{\rm\nabla}}\boldsymbol{u}_{f}=-\frac{1}{{\it\rho}_{f}}\boldsymbol{{\rm\nabla}}p+{\it\nu}{\rm\nabla}^{2}\boldsymbol{u}_{f}+\boldsymbol{f}, & \displaystyle\end{eqnarray}$$
 $\boldsymbol{u}_{f}$
,
 ${\it\rho}_{f}$
and
 ${\it\nu}={\it\mu}/{\it\rho}_{f}$
are the fluid velocity, density and kinematic viscosity respectively (
 ${\it\mu}$
is the dynamic viscosity), while
 $p$
and
 $\boldsymbol{f}$
are the pressure and the force field used to maintain turbulence and model the presence of particles. The particle centroid linear and angular velocities,
 $\boldsymbol{u}_{p}$
and
 ${\bf\omega}_{p}$
, are instead governed by the Newton–Euler Lagrangian equations,
 $$\begin{eqnarray}\displaystyle & \displaystyle {\it\rho}_{p}V_{p}\frac{\text{d}\boldsymbol{u}_{p}}{\text{d}t}={\it\rho}_{f}\oint _{\partial \mathscr{V}_{p}}{\bf\tau}\boldsymbol{\cdot }\boldsymbol{n}\,\text{d}S+({\it\rho}_{p}-{\it\rho}_{f})V_{p}\boldsymbol{g}, & \displaystyle\end{eqnarray}$$
 $$\begin{eqnarray}\displaystyle & \displaystyle I_{p}\frac{\text{d}{\bf\omega}_{p}}{\text{d}t}={\it\rho}_{f}\oint _{\partial \mathscr{V}_{p}}\boldsymbol{r}\times {\bf\tau}\boldsymbol{\cdot }\boldsymbol{n}\,\text{d}S, & \displaystyle\end{eqnarray}$$
 $V_{p}=4{\rm\pi}a^{3}/3$
and
 $I_{p}=2{\it\rho}_{p}V_{p}a^{2}/5$
are the particle volume and moment of inertia, with
 $a$
the particle radius;
 $\boldsymbol{g}$
is the gravitational acceleration;
 ${\bf\tau}=-p\unicode[STIX]{x1D644}+2{\it\mu}\unicode[STIX]{x1D640}$
is the fluid stress, with
 $\unicode[STIX]{x1D644}$
the identity matrix and
 $\unicode[STIX]{x1D640}=(\boldsymbol{{\rm\nabla}}\boldsymbol{u}_{f}+\boldsymbol{{\rm\nabla}}\boldsymbol{u}_{f}^{T})/2$
the deformation tensor;
 $\boldsymbol{r}$
is the distance vector from the centre of the sphere while
 $\boldsymbol{n}$
is the unit vector normal to the particle surface
 $\partial \mathscr{V}_{p}$
. Dirichlet boundary conditions for the fluid phase are enforced on the particle surfaces as
 $\boldsymbol{u}_{f}|_{\partial \mathscr{V}_{p}}=\boldsymbol{u}_{p}+{\bf\omega}_{p}\times \boldsymbol{r}$
.
In the numerical code, the coupling between the solid and fluid phases is obtained by using an immersed boundary method. The boundary condition at the moving particle surface (i.e.
 $\boldsymbol{u}_{f}|_{\partial \mathscr{V}_{p}}=\boldsymbol{u}_{p}+{\bf\omega}_{p}\times \boldsymbol{r}$
) is modelled by adding a force field on the right-hand side of the Navier–Stokes equations. The problem of remeshing is therefore avoided and the fluid phase is evolved in the whole computational domain using a second-order finite-difference scheme on a staggered mesh. The time integration is performed by a third-order Runge–Kutta scheme combined with a pressure correction method at each substep. The same integration scheme is also used for the Lagrangian evolution of (2.3) and (2.4). The forces exchanged by the fluid and the particles are imposed on
 $N_{L}$
Lagrangian points uniformly distributed on the particle surface. The force
 $\boldsymbol{F}_{l}$
acting on the
 $l$
th Lagrangian point is related to the Eulerian force field
 $\boldsymbol{f}$
by the expression
 $\boldsymbol{f}(\boldsymbol{x})=\sum _{l=1}^{N_{L}}\boldsymbol{F}_{l}{\it\delta}_{d}(\boldsymbol{x}-\boldsymbol{X}_{l}){\rm\Delta}V_{l}$
. In the latter,
 ${\rm\Delta}V_{l}$
represents the volume of the cell containing the
 $l$
th Lagrangian point while
 ${\it\delta}_{d}$
is the Dirac delta. This force field is obtained through an iterative algorithm that maintains second-order global accuracy in space. Using this immersed boundary method force field, (2.3) and (2.4) are rearranged as follows to maintain accuracy:
 $$\begin{eqnarray}\displaystyle & \displaystyle {\it\rho}_{p}V_{p}\frac{\text{d}\boldsymbol{u}_{p}}{\text{d}t}=-{\it\rho}_{f}\mathop{\sum }_{l=1}^{N_{l}}\boldsymbol{F}_{l}{\rm\Delta}V_{l}+{\it\rho}_{f}\frac{\text{d}}{\text{d}t}\int _{\mathscr{V}_{p}}\boldsymbol{u}_{f}\,\text{d}V+({\it\rho}_{p}-{\it\rho}_{f})V_{p}\boldsymbol{g}, & \displaystyle\end{eqnarray}$$
 $$\begin{eqnarray}\displaystyle & \displaystyle I_{p}\frac{\text{d}{\bf\omega}_{p}}{\text{d}t}=-{\it\rho}_{f}\mathop{\sum }_{l=1}^{N_{l}}\boldsymbol{r}_{l}\times \boldsymbol{F}_{l}{\rm\Delta}V_{l}+{\it\rho}_{f}\frac{\text{d}}{\text{d}t}\int _{\mathscr{V}_{p}}^{}\boldsymbol{r}\times \boldsymbol{u}_{f}\,\text{d}V, & \displaystyle\end{eqnarray}$$
 $\boldsymbol{r}_{l}$
is simply the distance from the centre of a particle. Particle–particle interactions are also considered. When the gap distance between two particles is smaller than twice the mesh size, lubrication models based on Brenner’s asymptotic solution (Brenner Reference Brenner1961) are used to correctly reproduce the interaction between the particles. A soft-collision model is used to account for collisions among particles with an almost elastic rebound (the restitution coefficient is 0.97). These lubrication and collision forces are added to the right-hand side of (2.5). More details and validations of the numerical code can be found in Breugem (Reference Breugem2012), Lambert et al. (Reference Lambert, Picano, Breugem and Brandt2013), Lashgari et al. (Reference Lashgari, Picano, Breugem and Brandt2014) and Picano et al. (Reference Picano, Breugem and Brandt2015).
2.2. Parameter setting
Sedimentation of dilute particle suspensions is considered in an unbounded computational domain with periodic boundary conditions in the
 $x$
,
 $y$
and
 $z$
directions. Gravity is chosen to act in the positive
 $z$
direction. A zero mass flux is imposed in the simulations. A cubic mesh is used to discretize the computational domain, with eight points per particle radius,
 $a$
. Non-Brownian rigid spheres are considered with solid to fluid density ratio
 ${\it\rho}_{p}/{\it\rho}_{f}=1.02$
. Hence, we consider particles slightly heavier than the suspending fluid. Two different solid volume fractions,
 ${\it\phi}=0.5\,\%$
and 1 %, are considered. In addition to the solid to fluid density ratio
 ${\it\rho}_{p}/{\it\rho}_{f}$
and the solid volume fraction
 ${\it\phi}$
, it is necessary to introduce another non-dimensional number. This is the Archimedes number (or alternatively the Galileo number
 $Ga=\sqrt{Ar}$
),
 $$\begin{eqnarray}Ar=\frac{\left(\displaystyle \frac{{\it\rho}_{p}}{{\it\rho}_{f}}-1\right)g(2a)^{3}}{{\it\nu}^{2}},\end{eqnarray}$$
a non-dimensional number that quantifies the importance of the gravitational forces acting on the particle with respect to viscous forces. In the present case the Archimedes number
 $Ar=21\,000$
. Using the particle terminal velocity
 $v_{t}$
we define the Reynolds number
 $Re_{t}=2av_{t}/{\it\nu}$
. This can be related by empirical relations to the drag coefficient of an isolated sphere when varying the Archimedes number,
 $Ar$
. Different versions of these empirical relations giving the drag coefficient as a function of
 $Re_{t}$
and
 $Ar$
have been proposed. Like Yin & Koch (Reference Yin and Koch2007) we will use the following relations:
 $$\begin{eqnarray}C_{D}=\left\{\begin{array}{@{}ll@{}}\displaystyle \frac{24}{Re_{t}}[1+0.1315Re_{t}^{(0.82-0.05\log _{10}Re_{t})}], & 0.01<Re_{t}\leqslant 20,\\ \displaystyle \frac{24}{Re_{t}}[1+0.1935Re_{t}^{0.6305}], & 20<Re_{t}<260.\end{array}\right.\end{eqnarray}$$
Since
 $C_{D}=4Ar/(3Re_{t}^{2})$
(Yin & Koch Reference Yin and Koch2007), we finally write
 $$\begin{eqnarray}Ar=\left\{\begin{array}{@{}ll@{}}18Re_{t}[1+0.1315Re_{t}^{(0.82-0.05\log _{10}Re_{t})}], & 0.01<Re_{t}\leqslant 20,\\ 18Re_{t}[1+0.1935Re_{t}^{0.6305}], & 20<Re_{t}<260.\end{array}\right.\end{eqnarray}$$
The Reynolds number calculated from (2.9) is approximately 188 for
 $Ar=21\,000$
.
In order to generate and sustain an isotropic and homogeneous turbulent flow field, a random forcing is applied to the first shell of wavevectors. We consider a
 ${\it\delta}$
-correlated in time forcing of fixed amplitude
 $\hat{f}_{0}$
(Vincent & Meneguzzi Reference Vincent and Meneguzzi1991; Zhan et al.
Reference Zhan, Sardina, Lushi and Brandt2014). The turbulent field, alone, is characterized by a Reynolds number based on the Taylor microscale,
 $Re_{{\it\lambda}}={\it\lambda}u^{\prime }/{\it\nu}$
, where
 $u^{\prime }$
is the fluctuating velocity and
 ${\it\lambda}=\sqrt{15{\it\nu}u^{\prime 2}/{\it\epsilon}}$
is the transverse Taylor length scale. This is approximately 90 in our simulations. The ratio between the grid spacing and the Kolmogorov length scale
 ${\it\eta}=({\it\nu}^{3}/{\it\epsilon})^{1/4}$
(where
 ${\it\epsilon}$
is the energy dissipation) is approximately 1.3 while the particle diameter is circa
 $12{\it\eta}$
. Finally, the ratio between the expected mean settling velocity and the turbulent velocity fluctuations is
 $v_{t}/u^{\prime }=3.4$
. The parameters of the turbulent flow field are summarized in table 1. For the definition of these parameters, the reader is referred to Pope (Reference Pope2000).
2.3. Validation
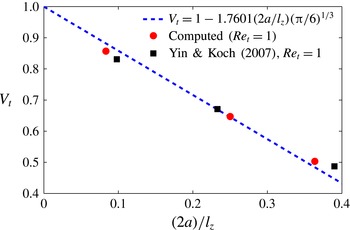
To check the validity of our approach we performed simulations of a single sphere settling in a cubic lattice in boxes of different sizes. Since this is equivalent to changing the solid volume fraction, we compared our results with the analytical formula derived by Hasimoto (Reference Hasimoto1959) and Sangani & Acrivos (Reference Sangani and Acrivos1982),
 $$\begin{eqnarray}|\boldsymbol{V}_{t}|=\frac{|\boldsymbol{v}_{t}|}{|\boldsymbol{V}_{s}|}=1-1.7601{\it\phi}^{1/3},\end{eqnarray}$$
where
 $$\begin{eqnarray}|\boldsymbol{V}_{s}|=\frac{2}{9}\frac{\left(\displaystyle \frac{{\it\rho}_{p}}{{\it\rho}_{f}}-1\right)ga^{2}}{{\it\nu}}\end{eqnarray}$$
is the Stokes settling velocity. In terms of the size of the computational domain,
 $l_{z}$
, (2.10) can also be rewritten as
 $V_{t}=1-1.7601(2a/l_{z})({\rm\pi}/6)^{1/3}$
. In figure 1 we show the results obtained with our code for
 $Re_{t}=1$
together with the data by Yin & Koch (Reference Yin and Koch2007) and the analytical solution. Although the analytical solution was derived with the assumption of vanishing Reynolds number, we find good agreement among the various results.
Turbulent flow parameters in particle units, where
 $k$
is the turbulent kinetic energy,
 ${\it\lambda}$
is the Taylor microscale,
 $T_{e}=k/{\it\epsilon}$
is the eddy turnover time and
 $Re_{L_{0}}$
is the Reynolds number based on the integral length scale
 $L_{0}=k^{3/2}/{\it\epsilon}$
.

The actual problem arises when considering particles settling at relatively high Reynolds numbers. If the computational box is not sufficiently long in the gravity direction, a particle will fall inside its own wake (due to periodic boundary conditions), thereby accelerating unrealistically. Various simulations of a single particle falling in boxes of different size were preliminarily carried out, in particular for
 $48a\times 48a\times 48a$
,
 $32a\times 32a\times 96a$
and
 $32a\times 32a\times 320a$
. The first two boxes turn out to be unsuitable for our purposes. We find a terminal Reynolds number
 $Re_{t}=200$
in the longest domain considered, which corresponds to a difference of approximately 6 % with respect to the value obtained from the empirical relations (2.9). As reference velocity we use the value obtained from simulations performed in the largest box at a solid volume fraction two orders of magnitude smaller than the cases under investigation,
 ${\it\phi}=5\times 10^{-5}$
(as in Uhlmann & Doychev Reference Uhlmann and Doychev2014), corresponding to a terminal velocity such that
 $Re_{t}=195$
, 4 % larger than the value from the empirical relations (2.9). Further increasing the length in the
 $z$
direction would make the simulations prohibitive. It should be noted also that simulations in a turbulent environment turn out to be less demanding, as turbulence disrupts and decorrelates the flow structures induced by the particles. The final choice was therefore a computational box of size
 $32a\times 32a\times 320a$
with
 $256\times 256\times 2560$
grid points, 391 particles for
 ${\it\phi}=0.5\,\%$
and 782 particles for
 ${\it\phi}=1\,\%$
. In all cases, the particles are initially distributed randomly in the computational volume with zero initial velocity and rotation.
Terminal velocity of a periodic array of spheres. The present results for
 $Re_{t}=1$
, denoted by red circles, are compared with the ones obtained by Yin and Koch at the same
 $Re_{t}$
, denoted by black squares, and with the analytical solution for
 $Re_{t}=0$
of (2.10).

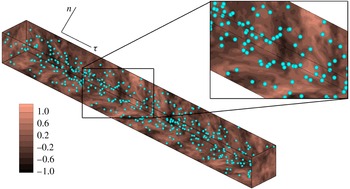
A snapshot of the suspension flow for
 ${\it\phi}=0.5\,\%$
is shown in figure 2. The instantaneous velocity component perpendicular to gravity is shown on different orthogonal planes.
The simulations were run on a Cray XE6 system at the PDC Center for High Performance Computing at the KTH, Royal Institue of Technology. The fluid phase is evolved for approximately six eddy turnover times before adding the solid phase. The simulations for each solid volume fraction are performed for both quiescent fluid and turbulent flow cases in order to compare the results. Statistics are collected after an initial transient phase of approximately four eddy turnover times for the turbulent case and 15 relaxation times (
 $T_{p}=2{\it\rho}_{p}a^{2}/(9{\it\rho}_{f}{\it\nu})$
) for the quiescent case. Defining as reference time the time it takes for an isolated particle to fall over a distance equal to its diameter,
 $2a/v_{t}$
, the initial transient corresponds to approximately 170 units. Statistics are collected over time intervals of 500 and 300 in units of
 $2a/v_{t}$
for the quiescent and turbulent cases respectively. Differences between the statistics presented here and those computed from half of the samples are below 1 % for the first and second moments.
Instantaneous snapshot of the velocity component perpendicular to gravity on different orthogonal planes, together with the corresponding particle position for
 ${\it\phi}=0.005$
. A zoomed view of a particular section is also shown.

3. Results
We investigate and compare the behaviour of a suspension of buoyant particles in quiescent and turbulent environments. The behaviour of a suspension in a turbulent flow depends on both the particle and turbulence characteristic time and length scales: homogeneous and isotropic turbulence is defined by the dissipative, Taylor and integral scales, whereas the particles are characterized by their settling velocity
 $v_{t}$
and by their Stokesian relaxation time
 $T_{p}=2{\it\rho}_{p}a^{2}/(9{\it\rho}_{f}{\it\nu})=11.1$
(time is scaled by
 $(2a/v_{t})$
throughout the paper). A comparison between characteristic time scales is given by the Stokes number, i.e. the ratio between the particle relaxation time and a typical flow time scale
 $St_{f}=T_{p}/T_{f}$
. In the present cases, the Stokes number based on the dissipative scales (time and velocity) is
 $St_{{\it\eta}}=T_{p}/T_{K}=8.1$
, so the particles are inertial on this scale. In addition, because the particles are approximately 12 times larger than the Kolmogorov length and fall approximately 16 times faster than the Kolmogorov velocity scale, we can expect that motions at the smallest scales will weakly affect the particle dynamics.
Considering therefore the large-scale motions, we introduce an integral-scale Stokes number
 $St_{T_{e}}=T_{p}/T_{e}=0.24$
. This value of
 $St_{T_{e}}$
reflects the fact that the particles are approximately 20 times smaller than the integral length scale
 $L_{0}$
. The strong coupling between particle dynamics and turbulent flow field occurs at scales of the order of the Taylor scale for the present cases. Indeed, the Taylor Stokes number is
 $St_{{\it\lambda}}=T_{p}/T_{{\it\lambda}}=2.1$
, with
 $T_{{\it\lambda}}={\it\lambda}/u^{\prime }$
. It should be noted that the Taylor length is slightly larger than the particle size,
 $3.1a$
, while particles fall approximately 3.4 times faster than typical fluid velocity fluctuations,
 $v_{t}/u^{\prime }=3.4$
. Hence, particles are strongly influenced by the fluid fluctuations occurring at scales of the order of
 ${\it\lambda}$
.
3.1. Particle statistics
We start by comparing the single-point flow and particle velocity statistics for the two cases studied, i.e. quiescent and turbulent flow. The results are collected when a statistically steady state is reached. Due to the axial symmetry with respect to the direction of gravity, we consider only two velocity components for both phases, the components parallel and perpendicular to gravity,
 $V_{{\it\alpha},{\it\tau}}$
and
 $V_{{\it\alpha},n}$
respectively, where
 ${\it\alpha}=f,p$
indicates the solid and fluid phases.
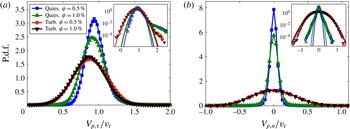
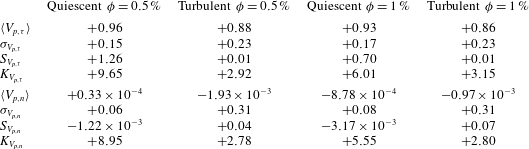
In figure 3 we report the p.d.f.s of the particle velocities for both volume fractions investigated here,
 ${\it\phi}=0.5\,\%$
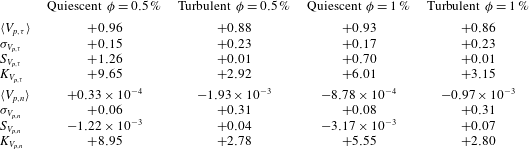
and 1 %; the moments extracted from these distributions are summarized in table 2. The data in figure 3(a) show the p.d.f. for the component of the velocity aligned with gravity,
 $V_{p,{\it\tau}}$
, normalized by the settling velocity for
 ${\it\phi}\rightarrow 0$
in a quiescent environment,
 $v_{t}$
. This is extracted from the simulation of a very dilute suspension discussed in § 2.3.
In the quiescent cases, the mean settling velocity slightly reduces on increasing the volume fraction
 ${\it\phi}$
, in agreement with the findings of Richardson & Zaki (Reference Richardson and Zaki1954) and Di Felice (Reference Di Felice1999), among others. The sedimentation velocity decreases to 0.96 at
 ${\it\phi}=0.5\,\%$
and 0.93 at
 ${\it\phi}=1\,\%$
. Di Felice (Reference Di Felice1999) investigated experimentally the settling velocity of dilute suspensions of spheres (
 ${\it\phi}=0.5\,\%$
) with density ratio 1.2 in quiescent fluid, for a large range of terminal Reynolds numbers (from 0.01 to 1000). Following the empirical fit proposed in Di Felice (Reference Di Felice1999), we obtain
 $\langle V_{f,{\it\tau}}\rangle \simeq 0.98$
at
 ${\it\phi}=0.5\,\%$
, approximately 1 % larger than our result. On the other hand, the formula suggested for the intermediate regime in Di Felice (Reference Di Felice1999) and Yin & Koch (Reference Yin and Koch2007),
 $Re_{t}<150$
, would give an estimated value of 0.88, 6 % lower than our result.
The p.d.f.s of the particle velocities along the directions (a) parallel,
 $V_{p,{\it\tau}}$
, and (b) perpendicular,
 $V_{p,n}$
, to gravity for
 ${\it\phi}=0.5\,\%$
and 1 %. The velocities are normalized by
 $v_{t}$
. Quiescent fluid cases are denoted by a blue curve with squares for
 ${\it\phi}=0.5\,\%$
and a green curve with triangles for
 ${\it\phi}=1\,\%$
, and turbulent flow data by a red curve with circles for
 ${\it\phi}=0.5\,\%$
and a black curve with downward-pointing triangles for
 ${\it\phi}=1\,\%$
. In the insets we show the p.d.f.s in lin–log scale.

First four central moments of the p.d.f.s of
 $V_{p,{\it\tau}}$
and
 $V_{p,n}$
normalized by
 $v_{t}$
. Here,
 $S_{V_{p,{\it\tau}}}$
(
 $S_{V_{p,n}}$
) and
 $K_{V_{p,{\it\tau}}}$
(
 $K_{V_{p,n}}$
) are respectively the skewness and the flatness of the p.d.f.s.
The mean settling velocity for the quiescent case at
 ${\it\phi}=0.5\,\%$
is instead close to the estimated value from (2.9). This is in agreement with what was reported in Uhlmann & Doychev (Reference Uhlmann and Doychev2014). These authors found that the particle mean settling velocity of a dilute suspension increases above the reference value only when the Archimedes number
 $Ar$
is larger than approximately 24 000 and clustering occurs. In our case,
 $Ar\simeq 21\,000$
and no clustering is noticed, according with their findings.
Interestingly, we observe an additional non-negligible reduction when a turbulent background flow is considered, in our opinion the main result of this paper. The reduction of the mean settling velocity
 $\langle V_{p,{\it\tau}}\rangle$
is 12 % at
 ${\it\phi}=0.5\,\%$
and 14 % at
 ${\it\phi}=1\,\%$
, see table 2. This result unequivocally shows that the turbulence reduces the settling velocity of a suspension of finite-size buoyant particles, in agreement with the experimental findings by Variano and co-workers (E. A. Variano, private communication) and Byron (Reference Byron2015). We also note that the reduction of the settling velocity with the volume fraction is less important for the turbulent cases.
Looking more carefully at the p.d.f.s, we note that fluctuations are, as expected, larger in a turbulent environment. In addition, the vertical particle velocity fluctuations are the largest component in a quiescent fluid, whereas in a turbulent flow the fluctuations are largest in the horizontal directions, as summarized in table 2. In the quiescent case, the root mean square (r.m.s.) of the tangential velocity
 ${\it\sigma}_{V_{p,{\it\tau}}}$
is 0.15 and 0.17 for
 ${\it\phi}=0.5\,\%$
and
 ${\it\phi}=1\,\%$
respectively, while it increases up to 0.23 in the corresponding turbulent cases. The difference in the width of the p.d.f. is particularly large in the directions normal to gravity, where the r.m.s. of the variance
 ${\it\sigma}_{V_{p,n}}$
is 0.3 for both turbulent cases, while it is 5 and 4 times smaller for the quiescent flows at
 ${\it\phi}=0.5\,\%$
and
 ${\it\phi}=1\,\%$
. We believe that the interactions among the particle wakes, mainly occurring in the settling direction, promote the higher vertical velocity fluctuations found in the quiescent cases. The shape of the p.d.f. is essentially Gaussian for the turbulent cases, showing vanishing skewness and normal flatness. Interestingly, an intermittent and skewed behaviour is exhibited in the quiescent cases. The flatness
 $K$
is approximately
 $9$
for both components at
 ${\it\phi}=0.5\,\%$
and slightly reduces to 5.5 at
 ${\it\phi}=1\,\%$
. The settling velocity of the quiescent cases is skewed towards intense fluctuations in the direction of the gravity. The skewness
 $S$
is higher for the more dilute case, being 1.26 at
 ${\it\phi}=0.5\,\%$
and 0.7 at
 ${\it\phi}=1\,\%$
.
We interpret the intermittent behaviour suggested by values of
 $K>3$
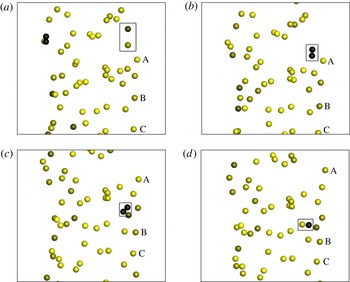
by the collective dynamics of the particle suspension. The significant tails of the p.d.f.s shown in figure 3(a) are indeed associated with a specific behaviour: as particles fall, they tend to be accelerated by the wakes of other particles, before showing drafting–kissing–tumbling behaviour (Fortes, Joseph & Lundgren Reference Fortes, Joseph and Lundgren1987). Snapshots of the drafting–kissing–tumbling behaviour between two spherical particles are shown in figure 4. When this close interaction occurs, particles are found to fall with velocities that can be more than twice the mean settling velocity
 $\langle V_{p,{\it\tau}}\rangle$
. In the quiescent case, the fluid is still, the wakes are the only perturbation present in the field and are long and intense, so their effect can be felt far away from the reference particle. The more dilute the suspension is the more intermittent the particle velocities are. On the contrary, when the flow is turbulent, the wakes are disrupted quickly and therefore fewer particles feel the presence of a wake. The velocity disturbances are now mainly due to turbulent eddies of different size that interact with the particles to increase the variance of the velocity homogeneously along all directions, leading to the almost perfect normal distributions shown above, with variances similar to those of the turbulent fluctuations. The features of the particle wakes will be further discussed in this paper to support the present explanation.
We also note that the sedimenting speed in the quiescent fluid is determined by two opposite contributions: the excluded volume effect, which contributes to a reduction of the mean settling velocity with respect to an isolated sphere, and the pairwise interactions (the drafting–kissing–tumbling), which increase the mean velocity of the two particles involved in the encounter. To try to identify the importance of the drafting–kissing–tumbling effect, we fit the left part (where no intermittent behaviour is found) of the p.d.f. pertaining to the quiescent case at
 ${\it\phi}=0.5\,\%$
with a Gaussian function. The mean of
 $V_{p,{\it\tau}}$
is reduced to approximately 0.93 (value due only to the hindrance effect) instead of 0.96 in the full simulation; thereby the increment in mean settling velocity due to drafting–kissing–tumbling can be estimated to be approximately 3 %.
Drafting–kissing–tumbling behaviour among two spherical particles in the quiescent case with
 ${\it\phi}=0.5\,\%$
, at a)
 $t=1789$
; (b)
 $t=1794$
; (c)
 $t=1799$
; (d)
 $t=1801$
. The particles are coloured with the absolute value of their velocity component in the direction of gravity. Three particles are labelled with ‘A, B, C’ in order to show how accelerated the two interacting particles are compared with the others.

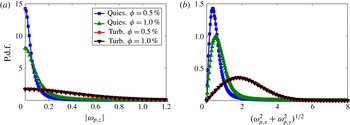
The p.d.f.s of (a)
 $|{\it\omega}_{p,z}|$
and (b)
 $\sqrt{{\it\omega}_{p,x}^{2}+{\it\omega}_{p,y}^{2}}$
for
 ${\it\phi}=0.5\,\%$
and 1 %. The angular velocities are normalized by
 $v_{t}/(2a)$
, the settling velocity of a single particle in a quiescent environment and its diameter. Quiescent fluid cases are denoted by a blue curve with squares for
 ${\it\phi}=0.5\,\%$
and a green curve with triangles for
 ${\it\phi}=1\,\%$
, and turbulent flow data by a red curve with circles for
 ${\it\phi}=0.5\,\%$
and a black curve with downward-pointing triangles for
 ${\it\phi}=1\,\%$
.

The p.d.f.s of the particle angular velocities are also different in quiescent and turbulent flows. These are shown in figure 5(a,b) for rotations about axes parallel to gravity,
 $|{\it\omega}_{p,{\it\tau}}|=|{\it\omega}_{p,z}|$
, and orthogonal to it,
 $\sqrt{{\it\omega}_{x}^{2}+{\it\omega}_{y}^{2}}$
. In the settling direction, the peak of the p.d.f. is always at
 $|{\it\omega}_{p,z}|=0$
. For the translational velocities, the p.d.f.s are broader in the turbulent cases. Due to the interaction with turbulent eddies, particles tend also to spin faster around axes perpendicular to gravity. From figure 5(b) we see that the modal value increases slightly in the quiescent cases on increasing the volume fraction. In the turbulent cases, the modal values are more than three times the values of the quiescent cases and the variance is also increased. Unlike the quiescent cases, the curves almost perfectly overlap for the two different values of
 ${\it\phi}$
, meaning that turbulent fluctuations dominate the particle dynamics. Turbulence hinders particle hydrodynamic interactions.
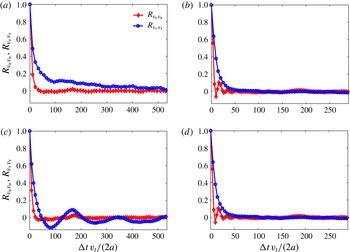
Figure 6 shows the temporal correlations of the particle velocity fluctuations,
 $$\begin{eqnarray}\displaystyle & \displaystyle R_{v_{{\it\tau}}v_{{\it\tau}}}({\rm\Delta}t)=\frac{\langle V_{p,{\it\tau}}^{\prime }(p,t)V_{p,{\it\tau}}^{\prime }(p,t+{\rm\Delta}t)\rangle }{{\it\sigma}_{V_{p,{\it\tau}}}^{2}}, & \displaystyle\end{eqnarray}$$
 $$\begin{eqnarray}\displaystyle & \displaystyle R_{v_{n}v_{n}}({\rm\Delta}t)=\frac{\langle V_{p,n}^{\prime }(p,t)V_{p,n}^{\prime }(p,t+{\rm\Delta}t)\rangle }{{\it\sigma}_{V_{p,n}}^{2}}, & \displaystyle\end{eqnarray}$$
 ${\it\phi}=0.5\,\%$
and
 ${\it\phi}=1\,\%$
. Focusing on the data at the lower volume fraction, we observe that the particle settling velocity decorrelates much faster in the turbulent environment, within
 ${\rm\Delta}t\sim 50$
, while it takes approximately one order of magnitude longer in a quiescent fluid. Falling particles may encounter intense vortical structures that change their settling velocity. The turbulence strongly alters the fluid velocity field seen by the particles, which in the quiescent environment is only constituted by coherent long particle wakes. This results in a faster decorrelation of the velocity fluctuations along the settling direction in the turbulent environment. Moreover,
 $R_{v_{n}v_{n}}$
crosses the null value earlier than for the settling velocity component. This result is not surprising since the particle wakes develop only in the settling direction.
Time correlations of the particle velocity fluctuations. The blue curve with circles represents the correlation of
 $V_{p,{\it\tau}}^{\prime }$
(
 $R_{v_{{\it\tau}}v_{{\it\tau}}}$
), while the red curve with diamonds is used for the correlation of
 $V_{p,n}^{\prime }$
(
 $R_{v_{n}v_{n}}$
). (a) Quiescent case with
 ${\it\phi}=0.5\,\%$
, (b) turbulent case with
 ${\it\phi}=0.5\,\%$
, (c) quiescent case with
 ${\it\phi}=1.0\,\%$
and (d) turbulent case with
 ${\it\phi}=1.0\,\%$
.

The normal velocity correlation
 $R_{v_{n}v_{n}}$
of the turbulent case oscillates around zero before vanishing at longer times. We attribute this to the presence of the large-scale turbulent eddies. As a settling particle encounters sufficiently strong and large eddies, its trajectory is swept on planes normal to gravity in an oscillatory way. To provide an approximate estimate of this effect, we consider as a first approximation the turbulent flow seen by the particles as frozen, since the particles fall at a higher velocity than the turbulent fluctuations (3.4 times). Since the strongest eddies are of the order of the transverse integral scale we can presume that these structures are responsible for this behaviour. In particular, the transverse integral scale
 $L_{T}=L_{0}/2\simeq 8$
and
 $u_{rms}^{\prime }=0.3$
, so we expect a typical period of
 $t=L_{T}/u_{rms}^{\prime }\simeq 26$
, which is of the order of the oscillations found for both turbulent cases, i.e.
 $t\approx 20$
. It should be noted that a similar behaviour has been observed by Wang & Maxey (Reference Wang and Maxey1993) for sufficiently small and heavy particles, termed the preferential sweeping phenomenon.
The same process can be interpreted in terms of crossing trajectories and continuity effects, as described by Csanady (Reference Csanady1963). An inertial particle falling in a turbulent environment changes its fluid–particle neighbourhood continuously. It will fall out from the eddy where it was at an earlier instant and will therefore rapidly decorrelate from the flow. In order to accommodate the back flow necessary to satisfy continuity, the normal correlations must then contain negative loops (like those seen in figure 6
b,d). Following Csanady (Reference Csanady1963), we define the period of oscillation of the fluctuations as the ratio of the typical eddy diameter in the direction of gravity (i.e. the longitudinal integral scale
 $L_{0}$
) and the particle terminal velocity
 $v_{t}$
, obtaining
 $t=L_{0}/v_{t}\simeq 16$
. This value is similar to the period of oscillations in the correlations in figure 6.
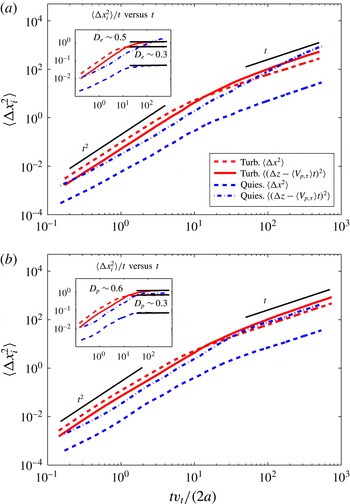
Mean square particle displacement in the directions parallel and perpendicular to gravity for both quiescent and turbulent cases for (a)
 ${\it\phi}=0.5\,\%$
and (b)
 ${\it\phi}=1\,\%$
. The mean particle displacement
 $\langle V_{p,{\it\tau}}\rangle t$
in the settling direction is subtracted from the instantaneous displacement when computing the statistics. In the inset, we show
 $\langle {\rm\Delta}x_{i}^{2}\rangle /t$
as a function of time as well as the diffusion coefficients
 $D_{e}$
for the turbulent cases.

As shown in figure 6(c), the quiescent environment presents a peculiar behaviour of the settling velocity correlation at
 ${\it\phi}=1\,\%$
. In particular, we observe oscillations around zero of long period,
 $T=160{-}180$
. From the analysis of particle snapshots at different times (not shown), we observe that these seem to be correlated to the formation of regions of different density of the particle concentration. Hence, a particle crossing regions with different local particle concentrations may experience a varying settling velocity.
To further understand the particle dynamics, we display in figure 7(a,b) the single-particle dispersion, i.e. the mean square displacement, for both quiescent and turbulent cases at
 ${\it\phi}=0.5\,\%$
and 1.0 %. The mean displacement,
 $\langle V_{p,{\it\tau}}\rangle t$
, is subtracted from the instantaneous displacement in the settling direction,
 ${\rm\Delta}z(t)$
, to highlight the fluctuations with respect to the mean motion. For all cases we found initially a quadratic scaling in time (
 $\langle {\rm\Delta}x_{i}^{2}\rangle \sim t^{2}$
) typical of correlated motions, while the linear diffusive behaviour takes over at longer times (
 $\langle {\rm\Delta}x_{i}^{2}\rangle \sim 2D_{e}t$
, with
 $D_{e}$
the diffusion coefficient).
The turbulent cases show a similar behaviour for both volume fractions. The crossover times when the initial quadratic scaling is lost and linear scaling occurs are approximately
 $t\simeq 10$
and
 $t\simeq 50$
for the normal and tangential components respectively. This difference is consistent with the correlation time scales previously discussed. The dispersion rates are similar in all directions in a turbulent environment. The quiescent cases present different features. First of all, dispersion is much more effective in the settling direction than in the normal one. The dispersion rate is smaller than in the turbulent cases in the horizontal directions, while, surprisingly, the mean square displacement in the settling direction is similar to that of the turbulent cases, being even higher at
 ${\it\phi}=0.5\,\%$
, something we relate to the drafting–kissing–tumbling behaviour discussed above. The crossover time scale is similar to that of turbulent cases, with the exception of the most dilute case which does not reach a fully diffusive behaviour at
 $t\simeq 500$
. This long correlation time makes the mean square displacement of this case higher than for the corresponding turbulent case at long times.
In the insets of figure 7(a,b) we show
 $\langle {\rm\Delta}x_{i}^{2}\rangle /t$
as a function of time. In all cases except the quiescent one at
 ${\it\phi}=0.5\,\%$
, the diffusive regime is reached and it is possible to calculate the diffusion coefficients
 $D_{e}=\langle {\rm\Delta}x_{i}^{2}\rangle /(2t)$
. For the turbulent case with
 ${\it\phi}=0.5\,\%$
we obtain
 $D_{e}=0.52$
and 0.28 in the directions parallel and perpendicular to gravity, while for
 ${\it\phi}=1\,\%$
we obtain
 $D_{e}=0.57$
and 0.32. In the quiescent cases, the diffusion coefficients in the horizontal directions are approximately 0.03, whereas the coefficient in the gravity direction at
 ${\it\phi}=1\,\%$
is approximately 0.40. Csanady (Reference Csanady1963) proposed a theoretical estimate of the diffusion coefficients for pointwise particles. Using these estimates, we obtain approximately
 $D_{e}=1.4$
and 0.7 in the directions parallel and perpendicular to gravity. These are approximately 2.5 times larger than those found here for finite-size particles.
3.2. Fluid statistics
Table 3 reports the fluctuation intensities of the fluid velocities for all cases considered. These are calculated by excluding the volume occupied by the spheres at each time step and averaging over the number of samples associated with the fluid phase volume. As expected, the fluid velocity fluctuations are smaller in the quiescent cases than in the turbulent regime. In the quiescent case, the r.m.s. of the velocity fluctuations is approximately 50 % larger in the settling direction than in the normal direction because of the long-range disturbance induced by the particle wakes. The increase of the volume fraction enhances the fluctuations in both directions. Fluctuations are always larger in the turbulent case, with the most significant differences compared with the quiescent cases in the normal direction, where the presence of the buoyant solid phase breaks the isotropy of the turbulent velocity fluctuations.
Fluctuation r.m.s. of the fluid velocities parallel,
 ${\it\sigma}_{V_{f,{\it\tau}}}$
, and perpendicular,
 ${\it\sigma}_{V_{f,n}}$
, to gravity. The turbulent fluid velocity undisturbed r.m.s. is
 ${\sim}0.3$
.

Hence, the solid phase clearly affects the turbulent flow field. Although the present study focuses on the settling dynamics, it is interesting to briefly discuss how turbulence is modulated. Modulation of isotropic turbulence by neutrally buoyant particles is examined in Lucci et al. (Reference Lucci, Ferrante and Elghobashi2010); however, the results change due to buoyancy, as investigated here. Typical turbulent quantities are reported in table 4, where they are compared with the unladen case at
 ${\it\phi}=0$
. The energy dissipation
 ${\it\epsilon}$
increases with
 ${\it\phi}$
, becoming almost double at
 ${\it\phi}=1\,\%$
. This behaviour is expected since the buoyant particles inject energy into the system which is transformed into kinetic energy of the fluid phase that has to be dissipated. The higher energy flux, i.e. dissipation, is reflected in a reduction of the Kolmogorov length
 ${\it\eta}$
. The particles reduce the velocity fluctuations, decreasing the turbulent kinetic energy level. The combined effect on
 $k$
and
 ${\it\epsilon}$
results in a decrease of the Taylor microscale
 ${\it\lambda}$
and of
 $Re_{{\it\lambda}}$
; likewise, the integral length
 $L_{0}$
and
 $Re_{L_{0}}$
also decrease. The reduction of the large and small turbulence scales is associated with the additional energy injection from the settling particles. Energy injection occurs at the size of the particles, which is below the unperturbed integral scale
 $L_{0}$
, explaining the lowering of the effective integral
 $L_{0}$
and of Taylor
 ${\it\lambda}$
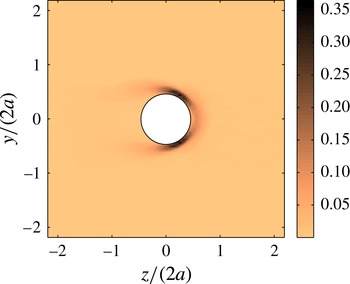
length scales. This additional energy is transferred to the bulk flow in the particle wake. Associated with this energy input there is a new mechanism for dissipation, which is the interaction of the flow with the no-slip surfaces of the particles. The mean energy dissipation field in the particle reference frame for the turbulent case with
 ${\it\phi}=0.5\,\%$
is therefore shown in figure 8. After a statistically steady state is reached, the norm of the symmetric part of the velocity gradient tensor
 $\unicode[STIX]{x1D60C}_{ij}$
and the dissipation
 ${\it\epsilon}=2{\it\nu}\unicode[STIX]{x1D60C}_{ij}\unicode[STIX]{x1D60C}_{ij}$
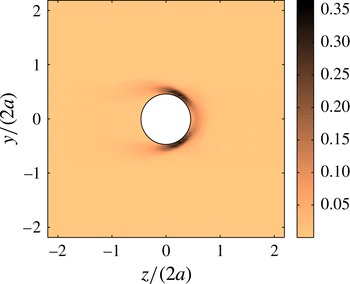
are calculated at each time step on a cubic mesh centred around each particle; the dissipation is calculated on the grid points outside the particle volume. The data presented have been averaged over all particles and time to get the mean dissipation field displayed in the figure. The maximum
 $\langle {\it\varepsilon}\rangle$
is found around the particle surface, with maximum values in the front; the mean dissipation drops down to the values found in the rest of the domain on the particle rear. The overall energy dissipation is therefore made up of two parts, the first associated with the dissipative eddies far from the particle surfaces and the second associated with the mean and fluctuating flow field near the particle surface. To conclude, the settling strongly alters the typical turbulence features via an anisotropic energy injection and dissipation, thus breaking the isotropy of the unladen turbulent flow. The energy is injected by the fluctuations into the particle wake, whereas stronger energy dissipation occurs at the front of each particle. As a consequence, the fluid velocity fluctuations change in the directions parallel and perpendicular to gravity, as shown in table 3.
Contours of the mean fluid dissipation,
 $\langle {\it\varepsilon}\rangle$
(
 $v_{t}^{3}/(2a)$
), averaged in the particle frame of reference.
Turbulent flow parameters in particle units for
 ${\it\phi}=0$
,
 ${\it\phi}=0.5\,\%$
and
 ${\it\phi}=1\,\%$
.

3.3. Relative velocity
An important quantity for understanding and modelling the settling dynamics is the particle to fluid relative motion. Although it is still unclear how to properly calculate the slip velocity between the two phases, we consider spherical shells around each particle, centred on the particle centroids, inspired by the works of Bellani & Variano (Reference Bellani and Variano2012) and Cisse, Homann & Bec (Reference Cisse, Homann and Bec2013). We calculate the mean difference between the particle and fluid velocities in each shell as
 $$\begin{eqnarray}\langle \boldsymbol{U}_{rel}\rangle _{\boldsymbol{x},t,NP}=\left\langle \boldsymbol{u}_{p}-\frac{1}{{\it\Omega}({\it\Delta})}\int _{{\it\Omega}({\it\Delta})}\boldsymbol{u}_{f}\,\text{d}\mathscr{V}\right\rangle _{t,NP},\end{eqnarray}$$
where
 ${\it\Omega}({\it\Delta})$
is the volume of a shell of inner radius
 ${\it\Delta}$
. A parametric study on the slip velocity is performed by changing the inner radii of these spherical shells from
 ${\it\Delta}=0.75$
particle diameters to
 ${\it\Delta}=5.0$
particle diameters, while keeping the shell thickness
 ${\it\delta}$
constant and equal to 0.063 in units of
 $2a$
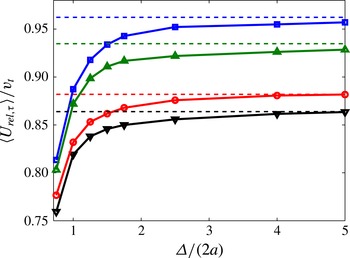
. In figure 9 we report the component of
 $\boldsymbol{U}_{rel}$
parallel to gravity as a function of the inner radii of the shells,
 ${\it\Delta}/(2a)$
. As the inner radii of the shells increase,
 $|U_{rel,{\it\tau}}|$
tends exponentially to an asymptotic value which corresponds to the mean particle velocity in the same direction,
 $\langle V_{p,{\it\tau}}\rangle$
. This is expected since the correlation between the fluid and particle velocities goes to zero at large distances. The quiescent cases still show a 0.5 % difference between
 $|U_{rel,{\it\tau}}|$
and
 $\langle V_{p,{\it\tau}}\rangle$
at
 ${\it\Delta}/(2a)=5$
. This difference is again attributed to the long coherent wakes of the particles.
The component of
 $\boldsymbol{U}_{rel}$
aligned with gravity as a function of the inner radii of the shells,
 ${\it\Delta}/(2a)$
, for the four cases studied. The dashed lines represent instead the mean particle velocities in the direction of gravity,
 $\langle V_{p,{\it\tau}}\rangle$
.

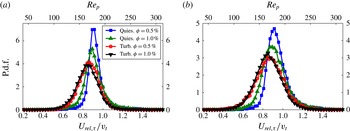
Comparison of the p.d.f.s of tangential relative velocity and corresponding particle Reynolds number
 $Re_{p}$
. The colours and symbols are the same as in the previous figures. In (a) the cases for
 ${\it\Delta}/(2a)=1.5$
are reported, while in (b) we show the results for
 ${\it\Delta}/(2a)=2.5$
.

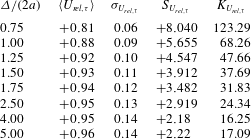
Moments of the
 $\text{p.d.f.}(U_{rel,{\it\tau}})$
for
 ${\it\phi}=0.5\,\%$
in the quiescent case. The thickness of the shell used to compute the slip velocity is
 ${\it\delta}/(2a)=0.063$
.
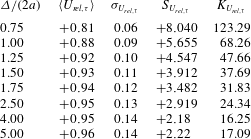
Moments of the
 $\text{p.d.f.}(U_{rel,{\it\tau}})$
for
 ${\it\phi}=0.5\,\%$
in a turbulent environment. The thickness of the shell used to compute the slip velocity is
 ${\it\delta}/(2a)=0.063$
.
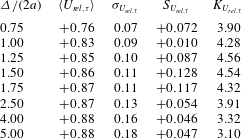
The p.d.f.s of these relative velocities,
 $U_{rel,{\it\tau}}$
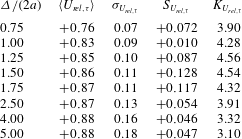
, and their first four central moments are computed and reported in tables 5 and 6 as a function of
 ${\it\Delta}/(2a)$
for the quiescent fluid and turbulent cases at
 ${\it\phi}=0.5\,\%$
. In the turbulent case, the moments approach those of a Gaussian distribution, with vanishing skewness and flatness close to 3, especially at large
 ${\it\Delta}$
. In the quiescent case, the third and fourth moments display higher values that decrease as
 ${\it\Delta}$
is increased, tending to the values of the particle velocities. The p.d.f.s pertaining to the four cases considered, calculated in spherical shells with inner radii of 1.5 and 2.5 particle diameters, are compared in figure 10. A second axis, reporting the particle Reynolds number
 $Re_{p}$
based on
 $U_{rel,{\it\tau}}$
, is also displayed in each figure. In the former case,
 ${\it\Delta}/(2a)=1.5$
, the shell radius is of the order of the Taylor scale to highlight the particle dynamics, while the relative velocity is approaching asymptotic values for the larger shell. The p.d.f.s of the relative velocity appear to be narrower than those of the particle absolute velocity, indicating that the particles tend to be transported by the large-scale motions, filtering the smallest scales.
The distributions pertaining to the simulations in a turbulent environment are nearly Gaussian, with modal values well below one. The quiescent cases show skewed distributions with long tails at high velocities, as observed for the particle velocities in figure 3(a). The particles settle on average with a velocity close to that of a single particle, with occasional events of higher velocity due to the drafting–kissing–tumbling dynamics. The lower the volume fraction is the more intermittent the dynamics is.
Joint probability distributions of
 $V_{f,{\it\tau}}$
and
 $V_{p,{\it\tau}}$
evaluated in spherical shells located at 1.75 particle diameters from each particle. We report in (a,c) the quiescent cases for
 ${\it\phi}=0.5\,\%$
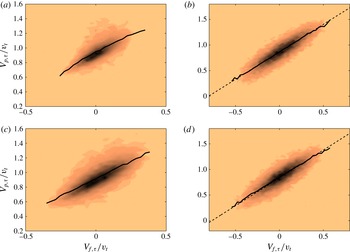
and 1 %, while the respective turbulent cases are reported in (b,d). The continuous lines represent the integrals of the joint probability distributions. In the turbulent cases the dashed lines represent the best fit of these integrals.

Knowing the tangential fluid velocity
 $\langle V_{f,{\it\tau}}\rangle _{\boldsymbol{r}}(p,t)$
, averaged in each shell and at each time step, and the corresponding tangential particle velocities
 $V_{p,{\it\tau}}(p,t)$
, it is then possible to find their joint probability distribution
 $P(V_{f,{\it\tau}},V_{p,{\it\tau}})$
(for the sake of simplicity we write
 $\langle V_{f,{\it\tau}}\rangle _{\boldsymbol{r}}$
as
 $V_{f,{\it\tau}}$
). These are evaluated in shells at
 ${\it\Delta}/(2a)=1.75$
for each case studied and reported in figure 11. In each case, the integral of
 $P(V_{f,{\it\tau}},V_{p,{\it\tau}})$
,
 $$\begin{eqnarray}\langle V_{p,{\it\tau}}|V_{f,{\it\tau}}\rangle =\int _{-\infty }^{\infty }P(V_{f,{\it\tau}},V_{p,{\it\tau}})V_{f,{\it\tau}}\,\text{d}V_{f,{\it\tau}},\end{eqnarray}$$
is also reported (continuous lines). This represents the most probable particle velocity
 $V_{p,{\it\tau}}$
given a certain fluid velocity
 $V_{f,{\it\tau}}$
, or, equivalently, the most probable fluid velocity surrounding a particle settling with velocity
 $V_{p,{\it\tau}}$
. In the turbulent cases, these integrals are well approximated by straight lines (displayed with dashed lines in the figure),
 $$\begin{eqnarray}V_{p,{\it\tau}}=C_{1}V_{f,{\it\tau}}+C_{2}.\end{eqnarray}$$
In both cases,
 $C_{1}$
is approximately 1 while
 $C_{2}$
is approximately 0.86 for
 ${\it\phi}=0.5\,\%$
and 0.84 for
 ${\it\phi}=1\,\%$
. These values are in agreement with the values found for the average relative velocities of shells at
 ${\it\Delta}/(2a)=1.75$
. In a quiescent flow, conversely, the integral in (3.4) gives a curved line and no best fit is therefore reported. In these cases, the joint probability distribution is broader, particularly in the region of higher particle velocities,
 $V_{p,{\it\tau}}$
. This is again due to the intense particle interactions and the drafting–kissing–tumbling behaviour described in figure 4, which confirms the high flatness of the p.d.f.s of the relative particle velocities.
Further insight can be obtained by plotting isocontours of the average particle relative velocities and their fluctuations, in both quiescent and turbulent flows. To this end, we follow the approach of Garcia-Villalba, Kidanemariam & Uhlmann (Reference Garcia-Villalba, Kidanemariam and Uhlmann2012). We place a uniform and structured rectangular mesh around each particle, with origin at the particle centre. By means of trilinear interpolations we find the fluid and relative velocities on this local mesh and average over time and the number of particles to obtain the mean relative velocity field and its fluctuations.
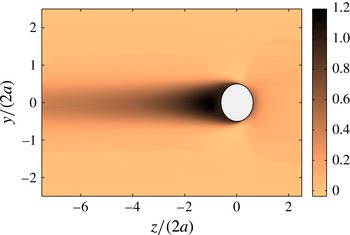
Contour plot of the velocity component in the direction of gravity for a single sphere settling in a quiescent fluid.

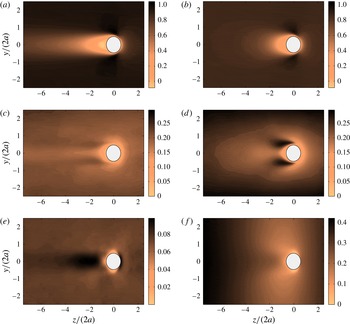
The vertical velocity of a single sphere settling in a quiescent fluid is reported in figure 12. The relative normal and tangential velocities and their fluctuations are displayed in figure 13 for suspensions with
 ${\it\phi}=0.5\,\%$
in both quiescent and turbulent environments. In the quiescent fluid simulations, a long wake forms behind the representative particle and, as seen from the single-point particle velocity correlations, it takes a long time for the velocity fluctuations to decorrelate. In the turbulent case instead, the wakes are disrupted by the background fluctuations.
Interesting observations can be drawn from the relative velocity fluctuation fields. Comparing figures 13(c) and 13(d) we note that intense vortex shedding occurs around the particles in the turbulent case, with important fluctuations of
 $U_{rel,{\it\tau}}$
. From figure 13(e,f) we also see that the relative velocity fluctuations are drastically increased in the horizontal directions in a turbulent environment. It is noteworthy that vortex shedding occurs at particle Reynolds numbers below the critical value above which this is usually observed (Bouchet, Mebarek & Dušek Reference Bouchet, Mebarek and Dušek2006). Vortex shedding is unsteady in nature, and unsteady effects may therefore play an important role in the increase of the overall drag, as further discussed below. Lower fluctuation intensities are found on the front parts of the particles, where the energy dissipation is highest, and in the immediate wake in the recirculating region where the instability is found to develop.
Fields of
 $\langle U_{rel,{\it\tau}}\rangle$
,
 $U_{rel,{\it\tau}}^{\prime }$
and
 $U_{rel,n}^{\prime }$
for the quiescent (a,c,e) and turbulent (b,d,f) cases.

3.4. Drag analysis
As in Maxey & Riley (Reference Maxey and Riley1983), we write the balance of the forces acting on a single sphere settling through a turbulent flow. The equation of motion for a spherical particle reads
 $$\begin{eqnarray}\frac{4}{3}{\rm\pi}a^{3}{\it\rho}_{p}\frac{\text{d}\boldsymbol{V}_{p}}{\text{d}t}=\frac{4}{3}{\rm\pi}a^{3}({\it\rho}_{p}-{\it\rho}_{f})\boldsymbol{g}+\oint _{\partial \mathscr{V}_{p}}{\bf\tau}\boldsymbol{\cdot }\boldsymbol{n}\,\text{d}S,\end{eqnarray}$$
where the integral is over the surface of the sphere
 $\partial \mathscr{V}_{p}$
,
 $\boldsymbol{n}$
is the outward normal and
 ${\bf\tau}=-p\unicode[STIX]{x1D644}+2{\it\mu}\unicode[STIX]{x1D640}$
is the fluid stress. As commonly done in aerodynamics, we replace the last term of (3.6) with a term depending on the relative velocity
 $\boldsymbol{U}_{rel}$
and a drag coefficient
 $C_{D}$
,
 $$\begin{eqnarray}\frac{4}{3}{\rm\pi}a^{3}{\it\rho}_{p}\frac{\text{d}\boldsymbol{V}_{p}}{\text{d}t}=\frac{4}{3}{\rm\pi}a^{3}({\it\rho}_{p}-{\it\rho}_{f})\boldsymbol{g}-\frac{1}{2}{\it\rho}_{f}{\rm\pi}a^{2}|\boldsymbol{U}_{rel}|\boldsymbol{U}_{rel}C_{D},\end{eqnarray}$$
with
 ${\rm\pi}a^{2}$
the reference area. Generally, the drag coefficient
 $C_{D}$
is a function of a Reynolds number and a Strouhal number which accounts for unsteady effects. In the present case, we consider it to be a function of the Reynolds number based on the relative velocity
 $Re_{p}=2a|\boldsymbol{U}_{rel}|/{\it\nu}$
(in a turbulent field it is proper to define
 $Re_{p}$
in terms of the relative velocity between the particle and the fluid) and of the Strouhal number defined as
 $$\begin{eqnarray}St=\frac{\displaystyle \frac{\text{d}\boldsymbol{V}_{p}}{\text{d}t}(2a)}{|\boldsymbol{U}_{rel}|^{2}}.\end{eqnarray}$$
The drag on the particle depends on both nonlinear and unsteady effects (such as the Basset history force and the added-mass contribution) through these two non-dimensional numbers.
Commonly, the unsteady contribution is neglected and
 $C_{D}$
is assumed to depend only on the Reynolds number. Since we want to investigate both nonlinear and unsteady effects, we decide to express the drag coefficient as
 $C_{D}(Re_{p},St)=C_{D_{0}}(Re_{p})[1+{\it\psi}(Re_{p},St)]$
, yielding
 $$\begin{eqnarray}\frac{4}{3}{\rm\pi}a^{3}{\it\rho}_{p}\frac{\text{d}\boldsymbol{V}_{p}}{\text{d}t}=\frac{4}{3}{\rm\pi}a^{3}({\it\rho}_{p}-{\it\rho}_{f})\boldsymbol{g}-\frac{1}{2}{\it\rho}_{f}{\rm\pi}a^{2}|\boldsymbol{U}_{rel}|\boldsymbol{U}_{rel}C_{D_{0}}(Re_{p})[1+{\it\psi}(Re_{p},St)],\end{eqnarray}$$
where
 ${\it\psi}=0\,\forall \,Re_{p}$
if
 $St=0$
(steady motion). We can therefore identify a quasi-steady term and the extra term that accounts for unsteady phenomena.
By ensemble averaging equation (3.9) over time and the number of particles, and assuming the settling process to be at statistically steady state, we can find the most important contributions to the overall drag. The steady-state average equation reads
 $$\begin{eqnarray}0={\textstyle \frac{4}{3}}{\rm\pi}a^{3}({\it\rho}_{p}-{\it\rho}_{f})\boldsymbol{g}-{\textstyle \frac{1}{2}}{\it\rho}_{f}{\rm\pi}a^{2}\langle |\boldsymbol{U}_{rel}|\boldsymbol{U}_{rel}C_{D_{0}}(Re_{p})[1+{\it\psi}(Re_{p},St)]\rangle .\end{eqnarray}$$
Denoting the entire time-dependent term simply as
 ${\it\Psi}(t)$
and rearranging, we obtain the following balance:
 $$\begin{eqnarray}\frac{4}{3}{\rm\pi}a^{3}\left(\frac{{\it\rho}_{p}}{{\it\rho}_{f}}-1\right)\boldsymbol{g}=\frac{1}{2}{\rm\pi}a^{2}\langle |\boldsymbol{U}_{rel}|\boldsymbol{U}_{rel}C_{D_{0}}(Re_{p})\rangle +{\it\Psi}(t).\end{eqnarray}$$
The term on the left-hand side is known, whereas the time-dependent term
 ${\it\Psi}(t)$
is of difficult evaluation. The nonlinear steady term can be calculated using the approach described in § 2.2. At each time step we calculate the relative velocity in the spherical shells surrounding each particle. From these we compute the particle Reynolds number
 $Re_{p}=2a|U_{rel}|/{\it\nu}$
, and using (2.8) (where we replace the terminal Reynolds number with the new particle Reynolds number) we obtain the drag coefficient. The first term on the right-hand side can therefore be evaluated by averaging over the number of particles and time steps considered. Finally, we divide everything by the buoyancy acceleration to estimate the relative importance of each term,
 $$\begin{eqnarray}100\,\%=\mathscr{S}(Re_{p})+{\it\Psi}(t),\end{eqnarray}$$
where
 $\mathscr{S}(Re_{p})$
represents the nonlinear steady term, while the unsteady term has been denoted again as
 ${\it\Psi}(t)$
for simplicity.
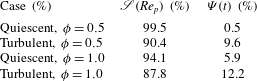
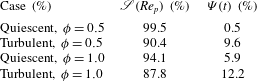
This approach is applied to the results of the simulations of a single sphere and to the quiescent and turbulent cases with
 ${\it\phi}=0.5\,\%$
and 1 %. The inner radius of the sampling shells is chosen to be 5 particle radii, and the results obtained are reported in table 7. The single-sphere simulation provides an estimate of the error of the method. Since our terminal Reynolds number is smaller than the critical Reynolds number above which unsteady effects become important, and our velocity field is indeed steady, the term
 ${\it\Psi}(t)$
should be negligible. The critical Reynolds number
 $Re_{c}$
has been found to be approximately 274 by Bouchet et al. (Reference Bouchet, Mebarek and Dušek2006), while we recall that our terminal Reynolds number for the isolated particle is 200. The nonlinear steady term provides in this case, however, an overestimated value of the drag, with a percentage error of approximately
 $+$
3 % with respect to the buoyancy term. The possible causes of this error are the long wake and the fact that (2.8) is empirical. The data from the single-particle simulations are used to correct the results from the other runs, i.e. the data are normalized with the total drag obtained in this case. In the quiescent case at
 ${\it\phi}=0.5\,\%$
, unsteady effects are negligible (approximately 0.5 % of the total drag), while they increase to approximately 6 % on increasing the particle evolve fraction to 1 %. In a turbulent flow, importantly, we notice that the contribution of
 ${\it\Psi}(t)$
adds up to approximately 10 % of the total at
 ${\it\phi}=0.5\,\%$
and to approximately 12 % of the total at
 ${\it\phi}=1\,\%$
.
Percentage contributions of the nonlinear and unsteady terms for the quiescent and turbulent cases with
 ${\it\phi}=0.5\,\%$
. The data are normalized by the mean drag from the simulation of a single sphere in quiescent fluid.
It should be noted that one can write the steady drag as mean and fluctuating components,
 $$\begin{eqnarray}\mathscr{S}(Re_{p})=\langle |\boldsymbol{U}_{rel}|\boldsymbol{U}_{rel}C_{D_{0}}(Re_{p})\rangle =\langle U_{rel}\rangle ^{2}C_{D_{0}}(\langle Re_{p}\rangle )+\mathscr{S}^{\prime }(\langle Re_{p}\rangle ).\end{eqnarray}$$
The fluctuations
 $\mathscr{S}^{\prime }(\langle Re_{p}\rangle )$
would be responsible for the reduction of the settling velocity if this were to be attributed to nonlinear drag effects only (see also Wang & Maxey Reference Wang and Maxey1993). We verified that for our results the total and mean components differ by approximately 2 %,
 $\langle |\boldsymbol{U}_{rel}|\boldsymbol{U}_{rel}C_{D_{0}}(Re_{p})\rangle \approx \langle U_{rel}\rangle ^{2}C_{D_{0}}(\langle Re_{p}\rangle )$
. This leads us to the conclusion that the main contribution to the overall drag is due to the steady term, but the reduction of the mean settling velocity in a turbulent environment is almost entirely due to the various unsteady effects. These can be related to unsteady vortex shedding, see figure 13, as in the experiments on a single sphere by Mordant & Pinton (Reference Mordant and Pinton2000). These observations are also in agreement with the results of Homann et al. (Reference Homann, Bec and Grauer2013). These authors observed that the enhancement of the drag of a sphere towed in a turbulent environment can be explained by the modification of the mean velocity and pressure profile, and thus of the boundary layer around the sphere, by the turbulent fluctuations.
4. Final remarks
We report numerical simulations of a suspension of rigid spherical slightly heavy particles in a quiescent and turbulent environment using a direct-forcing immersed boundary method to capture the fluid–structure interactions. Two dilute volume fractions,
 ${\it\phi}=0.5\,\%$
and 1 %, are investigated in quiescent fluid and homogeneous isotropic turbulence at
 $Re_{{\it\lambda}}=90$
. The particle diameter is of the order of the Taylor length scale and approximately 12 times the dissipative Kolmogorov scale. The ratio between the sedimentation velocity and the turbulent fluctuations is approximately 3.4, so that the strongest fluid–particle interactions occur at approximately the Taylor scale.
The choice of the parameters is inspired by the reduction in sedimentation velocity observed experimentally in a turbulent flow by Byron (Reference Byron2015) and in the group of Professor Variano at UC Berkeley. In the experiment, the isotropic homogeneous turbulence is generated in a tank with dimensions of several integral length scales by means of two facing randomly actuated synthetic jet arrays (driven stochastically). The Taylor microscale Reynolds number of the experiment is
 $Re_{{\it\lambda}}=260$
. Particle image velocimetry using refractive-index-matched hydrogel particles is used to measure the fluid velocity and the linear and angular velocities of finite-size particles of diameter of approximately 1.4 Taylor microscales and density ratios
 ${\it\rho}_{p}/{\it\rho}_{f}=1.02$
, 1.006 and 1.003. The ratio between the terminal quiescent settling velocity
 $v_{t}$
and the turbulence fluctuating velocity
 $u^{\prime }$
is approximately 1, higher than in our simulations where this ratio is 3.3. Byron (Reference Byron2015) observes reductions of the slip velocity of between 40 % and 60 % on varying the shape and density of the particles. As suggested by Byron (Reference Byron2015), the larger reduction in settling velocity observed in the experiments is most likely explained by the larger turbulence intensity.
The new findings reported here can be summarized as follows. (i) The reduction of settling velocity in a quiescent flow due to the hindering effect is reduced at finite inertia by pair interactions, e.g. drafting–kissing–tumbling. (ii) Due to these particle–particle interactions, sedimentation in a quiescent environment presents significant intermittency. (iii) The particle settling velocity is further reduced in a turbulent environment due to unsteady drag effects. (iv) Vortex shedding and wake disruption are observed also in subcritical conditions in an already turbulent flow.
In a quiescent environment, the mean settling velocity slightly decreases from the reference value pertaining to a few isolated particles when the volume fraction
 ${\it\phi}=0.5\,\%$
and
 ${\it\phi}=1\,\%$
. This limited reduction of the settling velocity with the volume fraction is in agreement with previous experimental findings in inertialess and inertial flows. The Archimedes number of our particles is 21 000, in the steady vertical regime before the occurrence of a first bifurcation to an asymmetric wake. In this regime, Uhlmann & Doychev (Reference Uhlmann and Doychev2014) observe no significant particle clustering, which is is confirmed by the present data.
The skewness and flatness of the particle velocity reveal large positive values in a quiescent fluid, and accordingly the velocity probability distribution functions display evident positive tails. This indicates a highly intermittent behaviour. In particular, it is most likely to see particles sedimenting at a velocity significantly higher than the mean; this is caused by the close interactions between particle pairs (and more seldom triplets). Particles approaching each other draft–kiss–tumble while falling faster than the average.
In a turbulent flow, the mean sedimentation velocity further reduces, to 0.88 and 0.86 at
 ${\it\phi}=0.5\,\%$
and
 ${\it\phi}=1\,\%$
. The variances of both the linear and the angular velocity increase in a turbulent environment, and the single-particle time correlations decay faster due to the turbulence mixing. The velocity p.d.f.s are almost symmetric and tend towards a Gaussian of corresponding variance. The particle lateral dispersion is, as expected, higher in a turbulent flow, whereas the vertical one is, surprisingly, of comparable magnitude in the two regimes; this can be explained by the highly intermittent behaviour observed in the quiescent fluid.
We compute the averaged relative velocity in the particle reference frame and the fluctuations around the mean. We show that the wake behind each particle is on average significantly reduced in the turbulent flow, and large-amplitude unsteady motions appear on the side of the sphere in the regions of minimum pressure where vortex shedding is typically observed. The effect of a turbulent flow on the damping of the wake behind a rigid sphere has been discussed, for example, by Bagchi & Balachandar (Reference Bagchi and Balachandar2003), while the case of a spherical bubble has been investigated by Merle, Legendre & Magnaudet (Reference Merle, Legendre and Magnaudet2005). Using the slip velocity between the particle and the fluid surrounding it, we estimate the nonlinear drag on each particle from empirical formulae and quantify the relevance of non-stationary effects on the particle sedimentation. We show that these become relevant in the turbulent regime, amount to approximately 10–12 % of the total drag, and are responsible for the reduction of settling velocity with the respect to the quiescent flow. This can be compared with the simulations of Good et al. (Reference Good, Ireland, Bewley, Bodenschatz, Collins and Warhaft2014), who attribute the reduction of the sedimentation velocity of small (
 $2a<{\it\eta}$
) heavy (
 ${\it\rho}_{p}/{\it\rho}_{f}\approx 900$
) spherical particles in turbulence to the nonlinear drag. Here, we show that non-stationary effects become relevant for larger particles at lower density ratios.
The present investigation could be extended in a number of interesting directions. Preliminary simulations reveal that variations of the density ratio at constant Archimedes number do not significantly modify the results presented here. It would therefore be interesting to investigate the effect of the Galileo number on the particle dynamics and of the ratio between turbulent fluctuations and sedimentation velocity.
Acknowledgements
This work was supported by the European Research Council grant no. ERC-2013-CoG-616186, TRITOS. The authors acknowledge Professor Variano for fruitful discussions and comments on the paper, computer time provided by SNIC (Swedish National Infrastructure for Computing) and the support from the COST Action MP1305: Flowing matter.