Heat stress in dairy animals entails significant economic costs for regions located in either temperate or tropical climatic zones. The losses arise from decline in milk yield (Choudhary and Sirohi, Reference Choudhary and Sirohi2019), reduced reproductive rates (Wolfenson and Roth, Reference Wolfenson and Roth2018) and worsening of milk composition (Nasr and El-Tarabany, Reference Nasr and El-Tarabany2017) results in a significant financial burden to the dairy industry. For instance, across the United States (US), heat stress costs the US dairy industry $897–1500 M annually (St-Pierre et al., Reference St-Pierre, Cobanov and Schnitkey2003).
The predicted increasing number of heat stress days over the 21st century is now a growing concern for the global dairy industry (Mauger et al., Reference Mauger, Bauman, Nebbich and Salathe2015). In the US, where lactating dairy animals are better housed in covered structures with shade (NAHMS-USDA, 2014), Key et al. (Reference Key, Sneeringer and Marquardt2014) projected milk production loss, for the average dairy farm, from 0.60 to 1.35% in 2030 due to climate change-induced heat stress. Under the forecasted climate change for the A1B climate scenario (Nakicenovic and Swart, Reference Nakicenovic and Swart2000), Mauger et al. (Reference Mauger, Bauman, Nebbich and Salathe2015) projected 4.7 and 6.3% loss in milk production per cow for the time slices 2040–2069 (2050s) and 2079–99 (2080s), respectively, relative to the baseline period (1950–99) that in monetary terms corresponds to $1.66 billion/year and $2.21billion/year, respectively. Under the same climate change scenario, the projected heat stress induced milk production loss in the South–East region of UK by the end of this centuryis £33.8 M (approximately $46 M, Fodor et al., Reference Fodor, Foskolos, Topp, Moorby, Pa´sztor and Foyer2018). We hypothesize that such losses would be even higher in tropical and sub-tropical countries like India where the average annual temperature in most parts is 25°C or higher, that is at or above the thermal-comfort zone for maximum productive performance of the farm animals (Sirohi and Michaleowa, Reference Sirohi and Michaelowa2007).
India is the world's largest milk producer with around 21% share of global milk production (FICCI, 2020). Nonetheless, the country has a small share in global dairy trade; milk production is an integral component of Indian agriculture supporting the livelihood and food security of more than two-thirds of the rural population (Saxena et al., Reference Saxena, Choudhary and Joshi2019). Based on growth estimates of population, income and urbanization for the next decade, the demand for milk and milk products in India for 2030 is estimated to be around 266.5 M metric tonnes. However, given the sensitivity of Indian dairy animals to heat stress (Choudhary Reference Choudhary2017) and anticipated rise in temperature and precipitation across India due to global warming (Choudhary and Sirohi, Reference Choudhary and Sirohi2020), sustaining the milk production growth rate to meet the projected demands is one of the key developmental challenges for the Indian dairy sector.
Currently, information on potential losses due to heat stress is very limited in an Indian context. Quantification of such losses in monetary terms would be imperative in assessing the cost of adaptation measures in heat stress abatement strategies, and could be used as a quantitative platform to issue recommendations for arresting thermal stress in dairy animals. The present study, therefore, aims to project heat-stress induced economic losses in dairy animals due to changing climate in India. This study was conducted in Northern Plains – a region of India well endowed in livestock and feed resources. Two agro-climatic regions, namely Trans and Upper Gangetic Plains (TUGP) from the Northern Plains, comprising of 82 districts from the states of Punjab, Haryana, Uttar Pradesh and 2 districts from Rajasthan (neighbouring Punjab) which together contribute around 30 per cent of the country's milk production (Choudhary and Sirohi, Reference Choudhary and Sirohi2022) formed the study area.
Materials and methods
Milk production data
We collected data on fortnightly milk yield of buffaloes (Murrah breed), indigenous cattle (Sahiwal and Tharparkar breeds) and Holstein crosses locally known as Karan Fries. we also obtained data for calving date, age at first calving and stage of lactation for the period 2001–2010 from the Livestock Research Centre of ICAR-National Dairy Research Institute located in Karnal district (latitude 29° 41′ 0″ N, longitude 76° 59′ 0″ E) of the Indian state Haryana. With mean annual temperature of around 25°C along with two distinct seasons, namely hot summer and cold winter, the weather conditions in the district are typical of those prevalent in India's Northern Plains. Each dairy animal was required to have at least 14 fortnightly milk yield records (minimum of around 210 d in milk) to be part of the analysis for that parity. Further, animals with high order of lactation (more than 8) were removed from the data set as these animals have very low milk yield.
Climatic data
The data on daily maximum, minimum and average temperature as well as relative humidity were sourced for the period 2001–2010 (base period considered in the study) from the nearest located meteorological station (within 5 km radius) of ICAR-Central Soil Salinity Research Institute, Karnal. The relative humidity data were for two time points, 7.22 am and 2.22 pm, representing daily maximum and minimum relative humidity, respectively.
Potential losses in milk production due to changing climate were estimated under Representative Concentration Pathway (RCP) based projections of climatic parameters for the period 2010–2039. During this early century period, further disaggregated analysis has been carried out for two decadal time slices, 2020–2029 and 2030–2039).
Among the alternative RCPs (2.6, 4.5, 6.0 and 8.5), we used the temperature and precipitation projections for RCP 4.5, an intermediate stabilization pathway which is considered to be in good coherence with the climate of the Indian subcontinent (Chaturvedi et al., Reference Chaturvedi, Joshi, Jayaraman, Bala and Ravindranath2012). Daily maximum, minimum and average temperature projections from RCP 4.5 were statistically downscaled at a spatial resolution of 0.5 × 0.5 degree to obtain district wise projections on temperature. Based on this data, the ensemble mean of temperature for the three time slices were estimated.
Effect of temperature on milk productivity of dairy animal
The degree of discomfort for dairy animals has usually been evaluated using the temperature–humidity index (THI) (Gantner et al., Reference Gantner, Mijic, Kuterovac, Barac and Potocnik2015). Though different formulations of THI exist, we followed the common and most widely used approach that includes air temperature and relative humidity (Ranjitkar et al., Reference Ranjitkar, Dengpan, Wijk, Ma, Zhao, Shi, Liu and Xu2020) for calculating THI (see detailed description in online Supplementary File). In Indian condition, a THI of 72 is generally considered as the threshold for dairy animals (Upadhyay et al., Reference Upadhyay, Singh, Kumar, Gupta and Ashutosh2007). Therefore, the animal's discomfort period was defined as maximum, minimum or average THI exceeding 72.
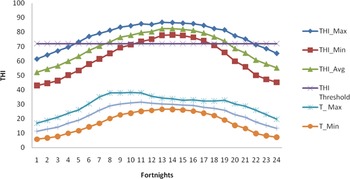
Given the data limitation of relative humidity for future scenarios, we relied on projected temperature for estimating potential impact on milk production. A very high positive correlation coefficient between temperature and THI (r = 0.93) in baseline period signified very similar pattern of fluctuation of temperature over the year as that of the THI (Fig. 1), therefore, we assumed that temperature will have a dominant effect on THI in the future time slices. In explaining the effect of weather parameters on milk production in subtropical climate of China, Ranjitkar et al. (Reference Ranjitkar, Dengpan, Wijk, Ma, Zhao, Shi, Liu and Xu2020) also identified temperature as an important variable explaining milk production throughout the year, while relative humidity only showed up as significant variables during specific times of the year.
Pattern of temperature and THI in baseline period.
Note: T_Max, T_Min and T_Avg indicates maximum, minimum and average temperature respectively; THI max, THI min and THI Avg are maximum THI, minimum THI and average THI, respectively.

Thereafter, rate of fortnightly decline in milk yield of the animals with temperature during discomfort period was estimated by fitting three log-linear models. Model 1 was defined as:
 $${\rm Log\ }( {{\rm FM}{\rm Y}_{{\rm izft}}} ) {\rm} = {\rm \beta }_ 0{\rm} + {\rm \beta }_ 1{\rm AF}{\rm C}_{{\rm iz}}{\rm} + {\rm \beta }_ 2{\rm O}{\rm L}_{{\rm iftz}}{\rm} + {\rm \beta }_ 3{\rm O}{\rm L}^ 2_{{\rm iftz}} {\rm} + {\rm \beta }_ 4{\rm SOL\_E} + {\rm \beta }_ 4{\rm SOL\_M} + {\rm \beta }_ 5{\rm T\_Ma}{\rm x}_{{\rm ft}}{\rm} + {\rm \varepsilon }$$
and
 $${\rm percentage\ decline\ in\ fortnightly\ productivity\;} = { {{\rm exp}( {{\rm \beta }_ 5} ) \hbox{-}{\rm \ 1}} } {\rm \times 100}$$
Where, FMYizft indicates the fortnightly milk yield of ith animal of zth breed type (crossbred, local cows and buffaloes) during the fth fortnights when THI exceeds the threshold level in tth year (t = 2001, 2002,…,2010). AFCi is age of ith animal at first calving. OLift represents the order of lactation of ith animal in fth fortnight in the year t. Similarly, T_Maxft represents the fortnightly maximum temperature in discomfort period in a year t. SOL represents stage of lactation of ith animal in fth fortnight in tth year. Three stages of lactation (early, middle and late) were defined for every 90 d interval after calving, starting from zero and were captured through dummy variables as,
 $$\eqalign{{\rm SO}{\rm L}_{{\rm ift}}{\rm \_E\ }& = {\rm \;\;1, \;\ for\ early\ stage\ }( {{\rm up\ to\ 90\ days\ after\ calving}} ) \cr & = {\rm \;\;0, \;\ otherwise}} $$
 $$\eqalign{{\rm SO}{\rm L}_{{\rm ift}}{\rm \_M\ } & = {\rm \;\;\;1, \;\ for\ middle\ stage\ }( {{\rm 91\} - {\rm 180\ days\ after\ calving}} ) }\cr & = {\rm \;\;0, \;\ otherwise}} $$
The other two models were the same as Model 1, but minimum temperature (T_Min.) and average temperature (T_Avg.) replaced the maximum temperature in Models 2 and 3, respectively.
The age at first calving, order of lactation and stage of lactation influences milk productivity as well as life time productivity of dairy animals (Torshizi et al., Reference Torshizi, Aslamenejad, Nassiri and Farhangfar2011). Therefore, inclusion of these parameters as control variables in the model is important for estimating the effect of thermal stress on milk yield. Since the animals were maintained under same feeding and management practices, the management effect was controlled. The models were estimated using the panel data estimation approach. Both fixed and random effects model were attempted and based on the Hausman test, fixed effect model was selected (Baltagi, Reference Baltagi2005).
Population and productivity projections of dairy animals: scenario planning
We projected district wise in-milk population and daily milk productivity of the dairy animals in TUGP for the three time slices under Business-as-Usual (BAU) scenario and Alternate scenario. The BAU scenario of population and productivity growth was based on the compound annual growth rate estimated from the past 4 livestock census, namely 1997, 2003, 2007 and 2012 (for population) and available Integrated Sample Survey data (for milk yield). Alternate scenario for population was built-up considering that animal population in the future time period will increase at a slower pace owing to land, feed and fodder constraints. Further, the Alternate productivity scenario was worked out by increasing the BAU productivity growth rates by different percentage points considering the technological advancement in coming years.
Projecting future losses
For estimating the impact of climate change (rise in temperature in the present study) on milk production, district wise average annual milk yield under ‘with’ and ‘without’ climate change condition for the future time slices were computed from the projected daily milk productivity, as follows:
Annual milk productivity without climate change:
 $${\rm AM}{\rm Y}_{{\rm qi}}{\rm} = {\rm \;}( {{\rm M}{\rm Y}_{{\rm iq}}{\rm \times 15\ }} ) \times {\rm N}_{\rm F}$$
Annual milk productivity with climate change:
 $${\rm AMY}_{{\rm qi}}^{{\rm CC}} {\rm} = {\rm \;}( {{\rm FM}{\rm Y}_{{\rm qi}}{\rm \times N}_{\rm F}^{\rm n} } ) {\rm} + ( {{\rm FMY}_{{\rm qi}}^{{\rm CC}} {\rm \times N}_{\rm F}^{\rm d} } ) $$
and
 $${\rm FMY}_{{\rm iq}}^{{\rm CC}} \,{\rm = }\,{\rm M}{\rm Y}_{{\rm iq}}{\rm \times 15}\,\left[ {{\rm (1 \ndash (ME\_}{\rm T}_{{\rm avg}}\,{\rm \times }\,{\rm \Delta T}_{{\rm avg}}^{{\rm si}} {\rm )}} \right]$$
Where, MYqi and AMYqi represents projected daily and annual milk yield of q breed (q = crossbred, buffalo, indigenous cattle) without climate change respectively in ith district (i = 1, 2, …., 84); FMYCCqi and AMYCCqi is fortnightly and annual milk yield of qth breed with climate change respectively in ith district. ME_Tavg indicates marginal effect of average temperature in discomfort period and ΔTsiavg is difference between ensemble mean of projected temperature of s time slice (s = 2010–39, 2020–29, 2030–39) to that of ensemble mean baseline temperature (2001–2010) in the i th district. NnF and NdF is number of fortnights during normal and discomfort period, respectively, in a year.
The milk production loss due to climate change was then calculated as:
 $${\rm Loss = AMY}_{{\rm qi}}^{{\rm CC}} {\rm \; - AM}{\rm Y}_{{\rm qi}}$$
Where, is in-milk adult female population of q breed in ith district in s time slice. AMYqi and AMYCCqi are as estimated from equations 3 and 4(a), respectively. The projected loss of milk production worked out by equation 5 was then estimated in monetary terms by multiplying the loss with average milk procurement price in 2015–16, which was INR 33/l.
Results and discussion
Temperature and milk productivity loss
It is evident from Fig. 1 that discomfort period for dairy animals due to rise in maximum THI starts from the 5th fortnight (early March) and lasts up to the 21st fortnight (mid-November). The night time discomfort due to minimum THI going beyond 72 starts in early June (11th fortnight) and continues until mid-September (17th fortnight). The average THI exceeds the threshold level during 14 fortnights stretching from April (7th fortnight) to October (19th fortnight).
The estimated effect of temperature on fortnightly milk productivity of dairy animals during the discomfort period is presented in Table 1. The control and climatic variables were highly significant with expected sign of regression coefficients in all the three models. As per our expectation, the relative magnitude of regression estimates was highest for the maximum temperature (Model 1) for all the dairy animals in comparison to the corresponding coefficients with average temperature (Model 2) and minimum temperature (Model 3). The productivity decline with respect to temperature was highest for crossbred cows (Table 1) indicating higher susceptibility of Bos taurus crosses with rising temperature in comparison to buffaloes and indigenous purebred cows.
Milk response function of dairy animals with temperature

Dependent variable is log(fortnightly milk yield), Estimation method is Panel Estimated Generalized Least Squares (EGLS).
Effect specification is Period Fixed Effect, * P < 0.01 ** P < 0.05, Figures in parentheses are t-ratios.
Studies have indicated that the effect of climatic variables on production performance of dairy animals is not instantaneous, but realised after a 1–3 d lag period due to a time gap between altered feed intake and utilization of consumed nutrients, or changes in the endocrine status of dairy animals (Linvill and Pardue, Reference Linvill and Pardue1992; West et al., Reference West, Mullinix and Bernard2003). However, as the present study models the effect on fortnightly milk yield rather than daily productivity such lag effect of climatic variable would not be discernible.
Projections for temperature changes in TUGP
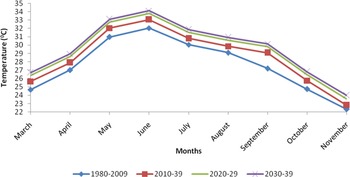
The average temperature during the discomfort months (April to September) was > 25°C in the baseline period. The temperature projections for 2010–39 under RCP 4.5 scenario (Fig. 2) in TUGP region indicate that discomfort months during which average temperature exceeds 25°C will extend for 2 months (March to October) in comparison to baseline. Even in the month of August, the projected temperature reaches around 30°C. The warming will further accentuate during decadal time slices. This indicates that dairy animals will experience more discomfort due to rising temperature in 2010–39 and decadal time slices. Not only the intensity of exposure but also its duration will rise.
Average temperatures of discomfort months in the baseline and across the time slices in TUGP.

Population and productivity of dairy animals in future time slices
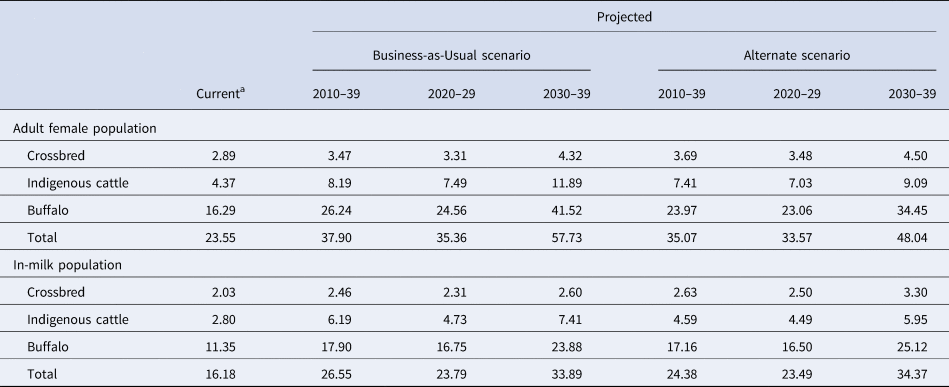
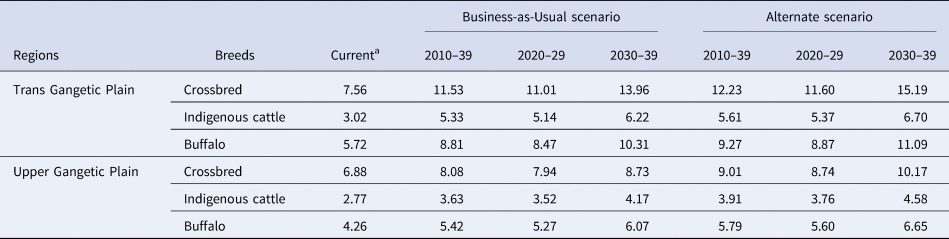
Under BAU scenario, the number of in-milk animals has been forecasted to be 33.9 M in 2030–39 while under the Alternate scenario during this time period the absolute number will be less as the total adult female population is anticipated to be lower (Table 2). The productivity of dairy animals in Trans Gangetic region is slightly higher than that in Upper-Gangetic plain as the dairy farmers in the former region are more progressive in terms of orientation of milk production and resource endowment (Table 3).
Projected average population (in millions) of milk herd in Trans and Upper Gangetic plains under Business-as-Usual and Alternate scenario

a Livestock census, 2012.
Projected average daily milk productivity (litres/day): Business-as-Usual and alternate scenario

a Based on latest ISS report.
Projections of losses in milk production
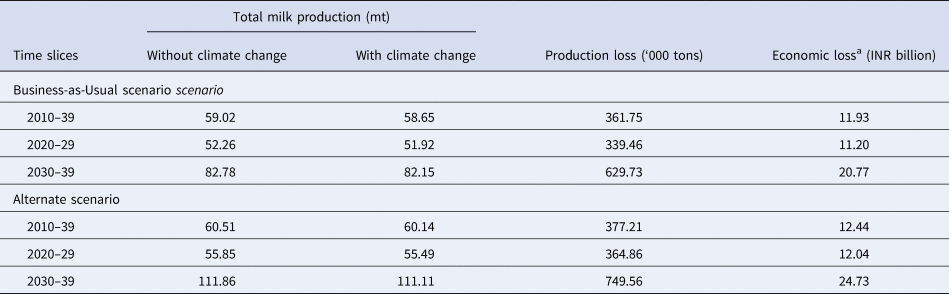
The estimates of milk production with and without climate change, and incremental losses in milk production due to climate warming situation are given in Table 4.The total annual loss in milk production under BAU scenario in TUGP is projected to be around 361 thousand tons in the full period (2010–2039) which will further increase to about 629 thousand tons per annum during the second sub-slice (2030–2039). In economic terms these losses would be of around INR 11.93 billion and 21 billion annually, respectively.
Projected annual losses in milk production in Trans and Upper Gangetic plains

a Based on average milk (cow + buffalo) procurement prices in 2015–16 = INR 33/l.
Even though in the Alternate scenario the livestock population projections were assumed to be lower than that in BAU, the losses are worked out to be more, as the productivity growth was postulated to be higher than in the BAU scenario. The annual regional loss under the Alternate scenario in value term would be around INR 12.44 billion (1902–1929) and is projected to be double that during 2030–2039. The findings clearly indicate that the realization of yield enhancing benefits of technological and genetic improvement would be hampered without research focus on the adaptation measures. Hence, together with increasing the milk yield of dairy animals, interventions are required to mitigate the adverse impact of future climate warming. In other words, an integrated approach to take up adaptation strategies at all levels to arrest this decline would be required to be put in place. It is important to note that since our projections are based on only one climatic parameter (temperature) and we could not model other environmental factors like wind speed and solar radiation affecting the microclimate of dairy animals, the estimated losses may be indicative of minimum financial implications of climate change on dairy industry of the studied regions.
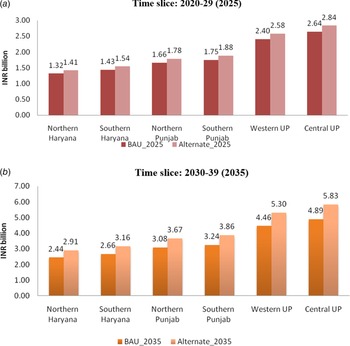
A practical approach in implementation of any adaptation measure in this direction would be to consider clusters of geographically proximate districts. Hence, an effort has also been made to work out the extent of economic losses at sub-regional level taking geographical grouping of districts within the state. The estimates indicate that in the next decade (2020–2029) the annual milk production losses in value terms would be around INR 2.75 to 3 billon with approximately 50:50 per cent accruing in Northern and Southern part of the Haryana (Fig. 3a). In the subsequent decade the annual economic loss will amount to INR 2.4–3.16 billion (Fig. 3b). In Punjab and Uttar Pradesh the magnitude of economic loss is still higher in both decades. Therefore, an even higher break-even investment can be made towards adaptation fund to arrest this economic loss.
Economic losses at sub-regional level. (a) Time slice: 2020–29 (2025), (b) Time slice: 2030–39 (2035).

In conclusion, with the looming threat of climate change, heat stress conditions are likely to increase, causing further losses to dairy farmers unless suitable animal management options are taken to field level. Dairy farmers earning cash income from milk production operate on a small gross margin per litre of milk produced (Sirohi et al., Reference Sirohi, Bardhan and Chand2016), which could be further eroded by heat stress. The estimates of potential economic losses in milk production provided in this study indicate the level of financial break-even investment that can be made in adaptation measures to arrest the loss due to climate change. Standard livestock cooling methods, such as fans, sprinklers, foggers require significant amounts of electricity and water and hence are not economically climate smart options for smallholder livestock producers. Low cost, renewable energy operated evaporative cooling systems need to be fabricated as important adaptive devices catering to the needs of rural India. Other ways for alleviating heat stress in buffalo include management of village ponds to provide clean water for the wallowing buffaloes. Also, innovative insurance products need to be developed for mitigating the increased weather related risk faced by the livestock farmers. Index based livestock insurance may be piloted to tackle the problem of loss of yield due to heat stress and increasing adverse climatic occurrences may also be addressed through this.
Supplementary material
The supplementary material for this article can be found at https://doi.org/10.1017/S0022029922000371
Acknowledgements
We express our sincere thanks to staff of NICRA unit of ICAR-NDRI, Karnal for providing data. Special thanks are due to Dr S. Naresh Kumar, Principal Scientist (Environmental Sciences), Centre for Environment Science and Climate Resilient Agriculture, Indian Agricultural Research Institute, New Delhi for sharing with us the downscaled representative concentration pathway 4.5 (RCP 4.5) climate scenarios for the time slice 2010–2039.