Implications
The proposed SWOT (Strengths, Weaknesses, Opportunities and Threats) analysis methodology is suitable for exploring the conservation and development of local breeds, given the complexity of the system where they exist. It allows analyzing the problem at different levels, generating and prioritizing from general strategies to specific actions. Although it can be used to define and evaluate future options for single breeds, its potential is maximized when using it to define the common strategies across breeds on the basis of analyses at the breed level. It enables one to evaluate the applicability of the common strategies to specific breeds and countries.
Introduction
The causes for the erosion of Farm Animal Genetic Resources (FAnGR) are multiple and stem from economic, technical, genetic, cultural and political grounds (Tisdell, Reference Tisdell2003; Food and Agriculture Organization of the United Nations (FAO), 2007). Farm animal production involves many stakeholders with interrelated and ever-changing elements. The investigations on conservation of FAnGR have usually tackled economic (Drucker et al., Reference Drucker, Gomez and Anderson2001; Alderson, Reference Alderson2003), technical (FAO, 2010), genetic (Groeneveld et al., Reference Groeneveld, Lenstra, Eding, Toro, Scherf, Pilling, Negrini, Finlay, Jianlin, Groeneveld and Weigend2010), social (Tisdell, Reference Tisdell2003), cultural (Gandini and Villa, Reference Gandini and Villa2003) and political (Fimland and Oldenbroek, Reference Fimland and Oldenbroek2007) issues separately. The integration of all these approaches is complex because the effect of many of them is difficult to measure, and the methods have been developed for specific purposes. The evaluation of the impact of factors on FAnGR in a comprehensive manner may help us in the establishment of sound conservation strategies. In this respect, decision-making tools provide some help, as they have been developed to elucidate the process of making choices in complex systems.
One of the most used tools is SWOT (Strengths, Weaknesses, Opportunities and Threats) analysis, which is an exercise of adjusting the internal behavior of an organization with its surrounding environment (Kangas et al., Reference Kangas, Kurttila, Kajanus and Kangas2003). It begins by determining the driving factors of the organization and grouping them into internal and external. Internal factors refer to the organization features that can be exploited (strengths) or have to be minimized (weaknesses) to improve its functioning. External factors are features of the environment, and therefore cannot be controlled by the organization, whose performance they are fostering (opportunities) or hampering (threats; Karppi et al., Reference Karppi, Kokkonen and Lähteenmäki-Smith2001).
SWOT analysis is then used in four ways to develop strategies (Weihrich, Reference Weihrich1989): using strengths to take advantage of opportunities (SO), to reduce the likelihood and impact of threats (ST), using the opportunities to overcome weaknesses (WO) and being aware of limitations that emerge from the combination of weaknesses and threats (WT). The strategies are presented in a matrix called TOWS matrix (Weihrich, Reference Weihrich1989), which allows one to visualize the interactions between internal and external factors.
SWOT analysis has proven to be a useful tool. Its power arises from the simplicity of its use and from the adaptability to wide range of situations (Impoinvil et al., Reference Impoinvil, Ahmad, Troyo, Keating, Githeko, Mbogo, Kibe, Githure, Gad, Hassan, Orshan, Warburg, Calderón-Arguedas, Sánchez-Loria, Velit-Suarez, Chadee, Novak and Beier2007; Vonk et al., Reference Vonk, Geertman and Schot2007; Lee et al., Reference Lee, Huang and Teng2009). This adaptability has led to numerous approaches that depend on the aim of the analysis. Sometimes it has been used as a way of organizing the driving factors without going further in the analysis (Hill and Westbrook, Reference Hill and Westbrook1997). Others have utilized it to select among pre-defined strategies (Kangas et al., Reference Kangas, Kurttila, Kajanus and Kangas2003; Lee et al., Reference Lee, Huang and Teng2009). SWOT analysis has been used to define strategies, sometimes straight from the identified factors without any systematic approach (Vonk et al., Reference Vonk, Geertman and Schot2007), and other times from the TOWS matrix (Yüksel and Dagdeviren, Reference Yüksel and Dagdeviren2007). Many of these studies have not quantified the identified strategies and have ended up listing the potential strategies, with prioritization left to the choice of the user. In this respect, two major weaknesses of the analysis have been identified: the subjective identification of the driving factors and the measurement of their relative importance (Hill and Westbrook, Reference Hill and Westbrook1997). The subjective recognition of factors has been overcome by using a wide range of people in the identification process (Impoinvil et al., Reference Impoinvil, Ahmad, Troyo, Keating, Githeko, Mbogo, Kibe, Githure, Gad, Hassan, Orshan, Warburg, Calderón-Arguedas, Sánchez-Loria, Velit-Suarez, Chadee, Novak and Beier2007; Vonk et al., Reference Vonk, Geertman and Schot2007). Several studies have developed quantitative SWOT analyses to assess the importance of the driving factors. Various studies have weighted driving factors but without quantifying the resulting strategies (Kurttila et al., Reference Kurttila, Pesonen, Kangas and Kajanus2000; Impoinvil et al., Reference Impoinvil, Ahmad, Troyo, Keating, Githeko, Mbogo, Kibe, Githure, Gad, Hassan, Orshan, Warburg, Calderón-Arguedas, Sánchez-Loria, Velit-Suarez, Chadee, Novak and Beier2007), whereas others have used factor weights in evaluating potential strategies (Yüksel and Dagdeviren, Reference Yüksel and Dagdeviren2007). Regarding the quantification method, some studies have developed techniques on the basis of a cardinal scale. The most popular one, the A'WOT method (Kurttila et al., Reference Kurttila, Pesonen, Kangas and Kajanus2000; Kajanus et al., Reference Kajanus, Kangas and Kurttila2004), combines SWOT analysis with Analytical Hierarchical Process (Saaty, Reference Saaty1986). Some others have used an ordinal scale as the base of the weighting of factors arguing that, although the cardinal scale is more accurate, it is difficult to apply when there are many factors to be analyzed, and when persons defining priorities are not able or willing to carry out pairwise comparisons (Kangas et al., Reference Kangas, Kurttila, Kajanus and Kangas2003; Kajanus et al., Reference Kajanus, Kangas and Kurttila2004).
Regarding the problem of conserving and developing local cattle breeds in Europe, there are common causes and breed and country specificities (Gandini et al., Reference Gandini, Martín-Collado, Colinet, Duclos, Hiemstra, Sooini and Díaz2012). Therefore, the importance of a single driving factor may be different across a set of local breeds or countries. SWOT analysis seems to be a proper tool to tackle the problem. It has mainly been used to evaluate single cases, whereas here there is a need to join the analysis over different situations (breeds) to identify common (across breeds) strategies.
The objectives of the paper are twofold. First, we propose a method to develop a SWOT analysis to identify and compare strategies for the conservation and development of local cattle breeds on the basis of breed-specific analyses. The methodology should be developed to tackle the suboptimal properties of SWOT analysis. Second, we use the methodology to identify and compare potential strategies for a set of 13 European local cattle breeds.
Material and methods
Material
We analyzed 13 breed cases from six countries: two breeds from Belgium (Dual Purpose Belgian Blue and Dual Purpose Red and White), Finland (Eastern and Western Finncattle), France (Ferrandaise and Villard de Lans), Italy (Modenese and Reggiana) and Spain (Avileña-Negra Ibérica and Alistana-Sanabresa), and three breeds from The Netherlands (Deep Red, Groningen White Headed and Meuse-Rhine-Yssel). There was a team of researchers in each country responsible for participating in the different phases of SWOT analysis.
A total of 371 farmers, selected following a stratified sampling according to herd size and geographical location, and 122 stakeholders were interviewed. Strengths, weaknesses, opportunities and threats for the conservation of the local breeds were surveyed by open-ended questions. The number of farmers interviewed ranged from 15 in Villard de Lans breed to 31 in both Spanish breeds and in Western Finncattle. The stakeholders were determined by the expert team for each country. The stakeholders covered agricultural and environmental authorities, research institutes, universities, state farms, trade and distribution companies, rural development agencies, slaughterhouses and dairy cooperatives, artificial insemination centers and breeders’ associations. The number of stakeholders interviewed ranged from 61 in Finland to 7 in France (Supplementary Table S1).
Methods
SWOT analysis contained the following steps. First, we set the scope of the analysis. Second, we determined the driving factors for the conservation and development of the breeds. Then, the influence of these factors was evaluated and quantified for each breed. Finally, potential common strategies for the conservation and development of the breeds were identified and compared. On the basis of these steps, we divided the SWOT analysis into four phases: definition of the system, identification and grouping of the driving factors, quantification of the importance of the driving factors and identification and prioritization of the strategies.
Phase 1: Definition of the system
First, the system under study and the boundaries of the analysis were determined. The definition of the system depends on the aim of the analysis. We aimed to analyze the European Local Cattle Breeds’ Farming System (ELCFS) to identify conservation and development strategies.
ELCFS involves many stakeholders (Fimland and Oldenbroek, Reference Fimland and Oldenbroek2007). The definition of the boundaries between internal and external factors depends on the stakeholder who is implementing the strategies derived from the analysis. This study is part of the EU-funded EURECA project, where a previous study (Gandini et al., Reference Gandini, Martín-Collado, Colinet, Duclos, Hiemstra, Sooini and Díaz2012) underlined the central role of farmers in the breed development process. Consequently, it was decided to implement the analysis from the farmer's perspective. The expert teams defined the scope and boundaries between the internal and external driving factors.
Phase 2: Identification and grouping of the driving factors
The driving factors of the ELCFS were identified following a multi-stakeholder approach. The chosen stakeholders were asked through questionnaires to identify strengths, weaknesses, opportunities and threats for the conservation and development of each breed.
In our case, given the complexity of ELCFS, several driving factors of different types were expected to be identified. On the other hand, when making decisions the number of factors considered has to be small enough to be manageable (Saaty, Reference Saaty2008). To tackle this dichotomy, the driving factors were grouped according to their nature in order to keep all the identified factors in the analysis while simplifying the approach to the problem. The teams of experts discussed the grouping of factors. Internal factors (strengths and weaknesses) for a breed were categorized into six groups: ‘Animal’, ‘Breed’, ‘Products’, ‘Farmers’, ‘Marketing system’ and ‘Production system’. The ‘Animal’ group referred to the production and functional features of the animals. The ‘Breed’ group factors were related to the population features such as size and structure of the population. The ‘Products’ group included factors regarding characteristics of the breed products. The ‘Farmers’ group referred to features such as age, but also to their involvement in organizations and collaboration. The ‘Production system’ was related to technical, cultural and environmental characteristics, and the ‘Marketing system’ group gathered the factors related to the marketing of breed products controlled by farmers.
External factors (opportunities and threats) were divided into four groups: ‘Market of current products’, ‘Market of new products and functions’, ‘Other production systems’ and ‘Stakeholders’. The ‘Market of current products’ included aspects related to the demand of breed products and market competition. The ‘Market of new products and functions’ referred to the demand of functions, such as landscape management or touristic activities. The ‘Other production system’ group was related to the competition with mainstream production system. Finally, the ‘Stakeholders’ group referred to the activities of stakeholders.
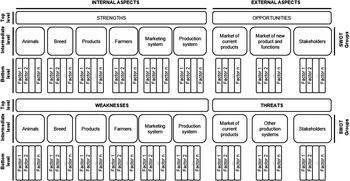
As a result of this grouping, the driving factors were considered in a three-level structure (Figure 1). The bottom level contained the driving factors themselves. They were divided at the intermediate level into factor groups according to a common attribute. At the top level, the factor groups were located under the categories strengths, weaknesses, opportunities or threats.
Organizational structure of driving factors of the European local cattle breeds’ farming system. SWOT = Strengths, Weaknesses, Opportunities and Threats.

Factors were first identified for every single breed and organized in the above-mentioned structure. The number of factors in each of the groups was variable across breeds. For example, five and three factors were determined in the ‘Animal group’ for Avileña-Negra Ibérica and Reggiana, respectively.
Phase 3: Quantification of the importance of the driving factors
Then the importance of the identified driving factors was weighted for each breed at a time. The choice of a quantification method had to cope with two major problems. First, the factors were evaluated for each breed by the respective expert team. Therefore, we had to use techniques that allow comparing weights made by different ‘judges’. Second, a large and unbalanced number of driving factors were expected to be identified across breeds. We needed a technique that accommodates this scenario. To overcome both problems, the weighting of the driving factors was based on an ordinal scale as a ranking. The teams of experts evaluated the factors by breed-specific ranks, and then we derived a weighting of the importance of each factor across breeds, on the basis of order statistics.
First, driving factors were ranked within the factor groups. Thereby, comparisons were made among a small number of factors of the same nature. Second, weighting of factor groups were used to evaluate the overall importance of factors. The highest-ranked driving factor of each group represented the group (Kurttila et al., Reference Kurttila, Pesonen, Kangas and Kajanus2000). Therefore, the comparison of the factor groups was actually a comparison between the highest-ranked driving factors of the groups. In comparing the importance of strengths, weaknesses, opportunities and threats, we followed a similar methodology. The highest-ranked factor group of strengths was compared with the highest-ranked group of weaknesses, opportunities and threats.
Finally, we derived an across-breed weighting of the driving factors on the basis of the rankings made at breed level. First, a value of zero was given to any factor that did not appear in a breed. Then the ranks for every breed were reversed and normalized following formula (1) . The transformed rank was called ‘weight’ to clearly differentiate it from the original rank.
Weight of the fth factor for the breed m:
 $${{w}_{fm}}\: = \:1\: + \:\frac{{1\,{\rm{ - }}\,{{r}_{fm}}}}{{{{n}_{fm}}}}$$
where rfm is the rank of the fth driving factor for a given breed m and nfm is the number of factors in the corresponding group of the fth factor for the breed m.
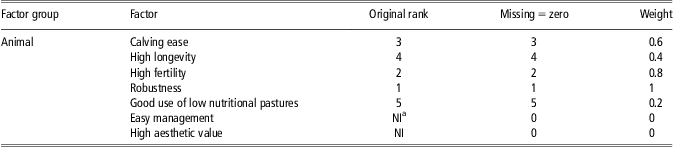
An example of the derivation of factor weights is shown in Table 1.
Derivation of the weights of the factors from the original ranks following formula (1)
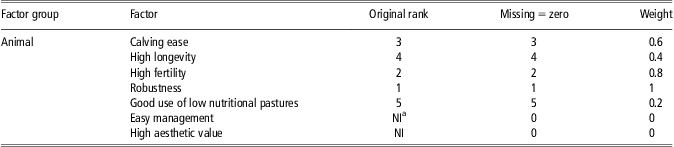
aNI refers to factors that were identified in many other breeds but did not have any score in Avileña-Negra Ibérica (ANI) – only two such factors are shown here as examples. Therefore, the number of factors (nfm) of the ‘Animal group’ in ANI breed to use in formula (1) is five.
Example for the factors within the ‘Animal group’ in Avileña-Negra Ibérica breed.
Similarly, the weight of the gth factor group for the breed m was calculated as follows:
 $${{w}_{gm}}\: = \:1\: + \:\frac{{1\,{\rm{ - }}\,{{r}_{gm}}}}{{{{n}_{gm}}}}$$
where rgm is the rank of the gth factor group for a given breed m and ngm is the number of the factor groups under a category strengths, weaknesses, opportunities or threats for the breed m.
The calculation of factor group weights is shown in Supplementary Table S2 continuing the example.
Finally, we derived the weights for the categories strengths, weaknesses, opportunities and threats from the ranks by the following formula:
 $${{w}_{im}}\: = \:1\: + \:\frac{{1\,{\rm{ - }}\,{{r}_{im}}}}{4}$$
where i refers to strengths, weaknesses, opportunities or threats and rim is the corresponding rank in the breed m.
Once the weights were calculated for each breed, across-breed weights (designated with capital W) were obtained by averaging the breed weights. Thus, we estimated Wf, Wg and Wi being, respectively, the across-breed weight of the fth factor, the gth factor group and ith category, that is, strengths, weaknesses, opportunities or threats.
Finally, we calculated the overall across-breed weight for fth factor of the gth factor group of the ith category as the product of the respective weights:
 $$O{{W}_f}\: = \:{{W}_f}\:\times \:{{W}_g}\:\times \:{{W}_i},\; \; i\: = \:\left\{ {S,W,O,T} \right\}$$
Similar to a study by Kurttila et al. (Reference Kurttila, Pesonen, Kangas and Kajanus2000), given the organizational structure (Figure 1), we assessed the overall importance of the factor groups. We calculated the overall across-breed weight of the gth factor group as
 $$O{{W}_g}\: = \:{{W}_g}\:\times \:{{W}_i},\; \; i\: = \:\left\{ {S,W,O,T} \right\}$$
Wi is an overall across-breed weight, therefore,
 $$O{{W}_i}\: = \:{{W}_i},\; \; i\: = \:\left\{ {S,W,O,T} \right\}$$
We developed a Consistency Index (CI) to evaluate the applicability of the across-breed weights by comparing them with the weights given for the individual breeds. We first ranked the weights and then standardized them. The standardized ranks of the across-breed weights were designated as Ra and the ones of individual breeds, Rb.
CI of the fth driving factor:
 $$C{{I}_f}\, = \,1\,{\rm{ - }}\,\frac{{\mathop{\sum}\limits_{m\, = \,1}^n | R{{a}_f}\,{\rm{ - }}\,R{{b}_{fm}}|}}{n}$$
where n is the number of breeds, Raf the standardized rank of Wf and Rbfm the standardized rank of wfm.
The CI of the gth factor group (CIg) is calculated by formula (4) substituting Raf and Rbfm by Rag and Rbgm, respectively, with Rag being the standardized rank of Wg and Rbgm being the standardized rank of wgm.
The CI for strengths, weaknesses, opportunities and threats were calculated in the same way.
Phase 4: Identification and prioritization of the strategies
Strategies were derived using the TOWS matrix (Weihrich, Reference Weihrich1989). They were identified at the three levels of the organization structure (Figure 1). At the bottom level, the specific actions fitting concrete factors were identified. At the intermediate level, we defined the strategies focusing on different aspects of the local breeds (farmers, animals, etc.). At the top level, we compared the four general strategies (SO, WO, ST and WT).
The potential utility (U) of the strategies derived from the interaction of driving factors, factor groups and categories were calculated with the formulas (5), (6) and (7), respectively.
 $${{U}_{fi,e}}\, = \,O{{W}_{fi}}\,\times \,O{{W}_{fe}}$$
where fi refers to the factors related to S and W and fe to O and T.
 $${{U}_{gi,e}}\, = \,O{{W}_{gi}}\,\times \,O{{W}_{ge}}$$
where gi and ge refer to the factor groups related to S and W and O and T, respectively.
 $${{U}_{I,E}}\, = \,O{{W}_I}\,\times \,O{{W}_E}$$
where I = {S,W} and E = {S,W}. Therefore, we estimated U SO, U ST, U WO and U WT.
We used CIs to compare the overall utility across breeds with that computed for individual breeds. The procedure was equal to the one described for driving factors. First, the strategies were ranked according to their utility value, then the ranks were standardized and finally indices were calculated as described in the formula (4).
Results
Phase 1: Definition of the system
The decision of implementing the SWOT analysis from the farmers’ perspective defined the boundary between internal and external driving factors. As internal factors, we considered the features of the animals and their products, production systems, farmers and their organizations and the aspects of the marketing of breed products (e.g. branding) that could be controlled by the farmers. However, other market aspects, such as the product demand, were out of farmers’ control and thus considered external factors. These consisted of features of farming area, infrastructures, market, policies and legislation that influence the local breeds’ dynamics.
Phase 2: Identification and grouping of the driving factors
Across the countries and the breeds, 99 driving factors were identified: 38 strengths, 27 weaknesses, 20 opportunities and 14 threats. A detailed list of all factors, including the frequency of occurrence, is given in Supplementary Table S3. Regarding factor groups, strengths contained six groups, whereas Weaknesses lacked the ‘Products group’. The ‘Other production systems’ group was not present in opportunities, and the ‘Market of new products and functions’ did not appear in threats. Therefore, strengths had six factor groups, weaknesses had five and opportunities and threats had three factor groups each. Groups were formed by a varying number of driving factors, ranging from 2 to 12.
Phase 3: Quantification of the importance of the driving factors
The ‘Results’ and ‘Discussion’ sections were organized from the top to the bottom level following the logic of presenting general outcomes before specific ones.
At the top level, strengths (OWS = 0.67) and opportunities (OWO = 0.67) had the highest overall weight, followed closely by weaknesses (OWW = 0.65). Threats (OWT = 0.52) had the lowest weight.
With regard to the factor groups, the most important were ‘Farmers’ (OWg = 0.41) and ‘Animal’ (OWg = 0.41) and ‘Farmers’ (OWg = 0.45) and ‘Breed’ (OWg = 0.43) for strengths and weaknesses, respectively. Factor groups within strength and opportunities related to ‘marketing system’ (OWg = 0.12) and the ‘market of current products’ (OWg = 0.39), respectively, were considered the least important. The highest weighted group of threats was the ‘market of current products’ (OWg = 0.29). However, ‘Marketing of new products’ (OWg = 0.49) was weighted at the top in opportunities. ‘Stakeholder’ seemed to positively influence ELCFS because its weight was close to the best in opportunities (OWg = 0.48) and the last in threats (OWg = 0.20).
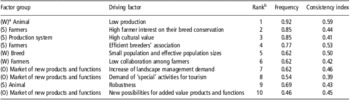
At the bottom level, we obtained the ranks of all 99 identified driving factors on the basis of OWf. The frequency of their appearance across breeds ranged from 0.92 to 0.08. The 10 most important factors across breeds, their frequency and CIs are presented in Table 2. Three were weaknesses, four strengths and the rest opportunities. The most important factor was the weakness ‘Low production’, followed by three strengths: ‘High farmers’ interest on their breed conservation’, ‘High cultural value’ and ‘Presence of efficient breeders’ association’. Two more weaknesses, ‘Small population size’ and ‘Low collaboration among farmers’ appeared the fifth and sixth in ranking. None of the factors appeared in all the breeds. Their frequency of appearance across breeds ranged from 0.92 for ‘Low production’ to 0.54 for the ‘Demand of special activities for tourism’.
Description of important driving factors ranked according to overall across-breed weight, with their frequency of appearance across breeds and the consistency index

aCapital letter refers to Strengths (S), Weaknesses (W), Opportunities (O) or Threats (T) where the factor group belongs.
bRanks are based on overall across-breed weight for each factor (OWf).
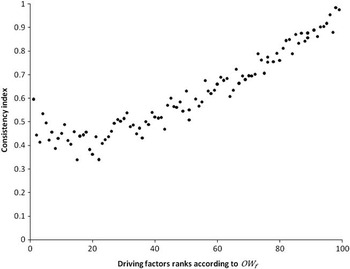
The distribution of the CIs is given in Figure 2. There were two different slopes. For the subset of the higher-ranked factors (ranks between 1 and 20), the CI increased with the rank. For the rest of the factors, the lowest-ranked factors tended to show higher CIs.
Distribution of the consistency indices of the 99 driving factors ranked according to overall across-breed weight.

Phase 4: Identification and prioritization of the strategies
We assessed strategies using the three-level structure (Figure 1), gaining specificity when going from the top level to the intermediate and finally down to the level of driving factors.
At the top level, the SO strategy had the highest utility value (USO = 0.45), followed by WO (UWO = 0.44), ST (UST = 0.35) and WT (UWT = 0.34). The CI of these values was 0.73, 0.81, 0.81 and 0.73, respectively.
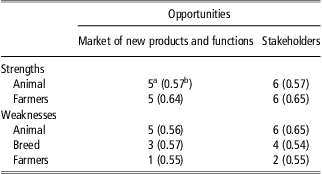
At the intermediate level, the 10 top-rated potential strategies related to the factor groups (Table 3) could be divided into two different types: those that use strengths to take advantage of opportunities, and those utilizing opportunities to overcome weaknesses. These strategies are specifically related to the factor groups of ‘Animals’ and ‘Farmers’ of strengths and ‘Animals’, ‘Farmers’ and ‘Breed’ of weaknesses and ‘Market of new products and functions’ and ‘Stakeholders’ of the opportunities. CIs ranged from 0.64 to 0.54.
10 top-rated strategies for the conservation and development of the studied breeds related to factor groups
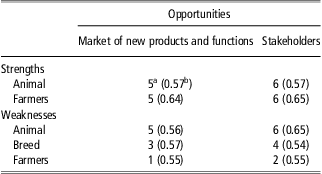
aNumbers refer to ranks based on utility values of strategies. Items with the same rank have the same utility value.
bConsistency indices.
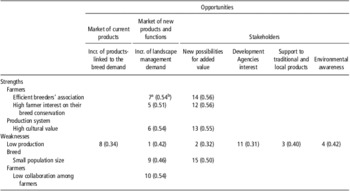
Regarding the factors themselves, we included in Table 4 the 15 highest-rated strategies. The first four should be oriented to overcome the ‘low production’ of animals. To do so, the ‘increasing demand of landscape management’, the ‘new possibilities for added value to breeds products’, the ‘support to traditional and local products’ and the ‘environmental awareness’ will provide the opportunities. The next three strategies involved strengths related to ‘farmers’ and ‘production system’. ‘High farmers’ interest on their breed conservation’, ‘presence of efficient breeders’ association’ and ‘high cultural value of the production systems’ may benefit from the ‘new possibilities to add value’ to the breeds. CIs were rather low compared with the strategies of the intermediate and top levels.
15 top-rated strategies derived from the interaction between internal (Strengths and Weaknesses) and external (Opportunities and Threats) driving factors

aRanks based on utility values of strategies (Uf).
bConsistency indices.
Discussion
Scope of analysis
We used SWOT analysis to find strategies for the conservation and development of FAnGR in a situation full of complexities. We adapted the analysis to a decision-making tool that allows us to analyze in a systematic and structured way the problem of identifying and prioritizing strategies, and applied it to analyzing the case of 13 European local cattle breeds kept in six countries. The proposed methodology permits comparison of breed cases across countries and helps policymakers, authorities, breeders’ associations and other stakeholders in defining and choosing the strategies to further develop and/or conserve local breeds. It starts from the investigations at the breed level and ends at performing a joint overall analysis.
We overcame the most relevant weaknesses typical to the SWOT analysis (Hill and Westbrook, Reference Hill and Westbrook1997): the risk of oversimplifying the problem, the subjectivity in determining the driving factors and the lack of quantification for establishing priorities.
Tackling complexity with simplicity and flexibility
The power of SWOT analysis is its simplicity. When it is used to analyze complex systems, it should be kept simple to avoid the risk of clouding the decision-making process. To do so, some authors have limited the number of factors in the analysis (Gable et al., Reference Gable, Lee, Kwahk and Green2007), taking a risk of ignoring significant ones. Here, we propose to structure the analysis in three levels (Figure 1). This approach increases flexibility in two ways. First, it allows analyzing the problem at different levels from general strategies to detailed actions. Second, the structure can be used to focus on different areas of the problem (factor groups). We used the analysis to find the most important factor groups from which the strategies should be developed. However, we could have focused on other factor groups.
We applied the SWOT methodology developed to a specific case leaving other options out. We calculated the utility of strategies across breeds, although the same methodology could have been applied to evaluate strategies for each specific breed. Another perspective would be related to the main stakeholder in the system. We analyzed the conservation problem from the farmers’ perspective, but the results might be useful for other stakeholders. The stakeholders, such as politicians devoted to agriculture, with the capacity to modify the factors that are external to farmers, can use the outcome of our analysis to design conservation and development measures from their own perspective.
Overcoming subjectivity with a multi-stakeholder approach
To avoid subjectivity in the definition of the system and in the identification of the driving factors, we used a multi-stakeholder approach, similar to a study by Impoinvil et al. (Reference Impoinvil, Ahmad, Troyo, Keating, Githeko, Mbogo, Kibe, Githure, Gad, Hassan, Orshan, Warburg, Calderón-Arguedas, Sánchez-Loria, Velit-Suarez, Chadee, Novak and Beier2007). Many times the number of internal and external factors in SWOT analysis is unbalanced (Karppi et al., Reference Karppi, Kokkonen and Lähteenmäki-Smith2001), biased toward the perspective of the stakeholder implementing the analysis. The multi-stakeholder approach permits to incorporate different perspectives ensuring that all relevant factors are included in the analysis and therefore avoiding the problem of subjectivity. We observed that the more stakeholders are included in the process, the more factors are identified.
The quantification method: development of weighting factors
The quantification method proposed aimed to create user-friendly decision-making tools to assess conservation strategies. It is based on the measurement of the relative importance of the driving factors, as dividing a problem into smaller constituents allows the development of accurate priorities (Saaty and Takizawa, Reference Saaty and Takizawa1986). However, we have to be aware of the complexity of comparing strategies. It is difficult to weight the influence of factors where the impact is not always quantitative by nature (Yüksel and Dagdeviren, Reference Yüksel and Dagdeviren2007). Nevertheless, if one knows in depth the system, it might be possible to derive tangible judgments even when intangible factors are involved (Saaty, Reference Saaty2008). We used ordinal scales in our analysis as they would reflect the way the mind works (Saaty, Reference Saaty2008). The use of cardinal weighting would derive more accurate comparisons than ordinal weighting. Although the information relative to the distance between two factors consecutive in importance is lost, there are some situations – when many factors are involved or people are not able to carry out cardinal comparisons (Kajanus et al., Reference Kajanus, Kangas and Kurttila2004) – when ordinal weighting is more suitable. In addition, ‘priority comparison in cardinal scales could lead to more biased estimates of true preferences than when applying ordinal inquiries’ (Kangas et al., Reference Kangas, Kurttila, Kajanus and Kangas2003). Moreover, owing to the complexity of our analysis, it is doubtful whether one could develop accurate cardinal weights for the influence of the factors.
We used weights determined by an expert team to rank the factors for each breed. A similar approach has been applied in other studies (Kangas et al., Reference Kangas, Kurttila, Kajanus and Kangas2003; Impoinvil et al., Reference Impoinvil, Ahmad, Troyo, Keating, Githeko, Mbogo, Kibe, Githure, Gad, Hassan, Orshan, Warburg, Calderón-Arguedas, Sánchez-Loria, Velit-Suarez, Chadee, Novak and Beier2007). The use of ordinal scales enables the comparison of judgments across breeds. However, it would have been desirable to use several values per breed in the ranking process to evaluate the consistency. This would have introduced a large degree of complexity in the process. The results of the analysis may vary because of the subjective view of the experts; however, this is not a reason for rejecting the results, as the nature on decision-making problems is anyway rather subjective (Yüksel and Dagdeviren, Reference Yüksel and Dagdeviren2007). Nevertheless, with a meticulous selection of experts, one could reduce subjectivity. It would be interesting to conduct further research on this aspect to be able to develop a risk analysis that provides a confidence interval for the value of each specific factor.
Considerations for the application of the SWOT analysis results
The use of ordinal weights has some interesting properties, described above, but also important implications in applying the results. Ranks do not measure distances between consecutively weighted factors or strategies. When taking decisions on the basis of the outcome of the analysis, one has to reckon this limitation. The definitive choice of strategies also depends on the costs, the difficulties and the probability of success in their implementation.
The strategies derived from the analysis are not necessarily mutually exclusive. The final decision could be a combination of several strategies. Nevertheless, when using the TOWS matrix, it is necessary to reckon that all the interactions of factors cannot be converted into strategies.
When using SWOT analysis, we have to accept the time and space dependency of the results. The applicability of the strategies derived from the analysis depends on the environment (opportunities and threats), and may vanish if conditions change (Yüksel and Dagdeviren, Reference Yüksel and Dagdeviren2007).
The case of the 13 European cattle breeds
The SWOT analysis performed for the 13 European breeds confirmed the heterogeneity of the situation observed in the previous study (Gandini et al., Reference Gandini, Martín-Collado, Colinet, Duclos, Hiemstra, Sooini and Díaz2012). The importance of the identified driving factors was variable across breeds. The CIs showed this heterogeneity. The interpretation about high CI with high frequency across breeds is straightforward, but the interpretation of indices with low frequency is somehow trickier (Table 2). These factors do not appear very often, but when they do they are so overwhelming that they raise the overall value. This implies that these factors should be carefully explored when analyzing their incorporation in policies and programs. In addition, the CIs of the most important factors were lower than those of the less important ones (Figure 2), meaning that although the main factors may vary across breeds, less relevant factors exhibit less variation.
Although the situation is heterogeneous, it can be stated that the future of these particular breeds can be promising. At the top level of analysis, threats received the lowest weights, whereas opportunities and strengths had the highest, closely followed by weaknesses. However, this may not be a problem, because by definition weaknesses are modifiable by farmers.
The CIs of the utility values of overall strategies across breeds decreased as they gained specificity (Tables 3 and 4). Hence, the European strategies should be based on general aspects, and be flexible to enable their adaptation to the country and breed requirements. The low consistency of specific strategies at factor level implies that when implementing them jointly for several breeds, it has to be confirmed that the specific driving factors are relevant for every single breed.
The conservation of local breeds has usually focused on either strengths or weaknesses related to the animal features, mainly robustness, adaptation to specific environments, high product quality and low input requirements. This study has determined that farmer and production system features are also key aspects to be considered (Table 2).
Local breeds can have high cultural (Gandini and Villa, Reference Gandini and Villa2003) and environmental value (Rege and Gibson, Reference Rege and Gibson2003). The results of our analysis confirmed the higher relevance of the cultural value of these breeds (Table 2). There is a parallel social support to traditional and local products. This potential has to be explored. However, environmental value did not appear among the top-ranked factors (‘High environmental value’ is ranked in the 41th position).
Opportunities coming from the ‘market of new products and new functions’ and from ‘stakeholder’ support were rated at the top. The increase of the income from new products and functions is seen as an important potential opportunity to be taken into account. In strategic terms, it is not only necessary to promote traditional products but also to develop new ones. However, accepting the time- and space-dependent nature of external driving factors, we have to assess whether the social support is going to last until the development of new options is a reality.
The most important strengths were related to ‘Animals’ and ‘Farmers’. It might be worth working on farmers’ motivation, collaboration and capacity building (Gandini et al., Reference Gandini, Martín-Collado, Colinet, Duclos, Hiemstra, Sooini and Díaz2012). Once this is achieved, the product development would be easier.
Regarding the strategies at the level of the driving factors, the development of breed-specific products could utilize the high cultural value that the breed has, given that there is an increasing social interest on rural culture. Marketing could also be designed to reach the social sectors that are supporting traditional and local products. It might be worth developing synergies with rural development agencies and involve them in the strategies to find added values and to overcome the losses because of low production. These strategies should consider utilizing breeders’ associations and the farmers’ high interest in the conservation by involving them in pilot projects and new farming experiences. The involvement of farmers could also be a way of fostering farmer collaboration that has been seen as a major weakness in maintaining local breeds.
Conclusions
The proposed SWOT analysis helps to get a deep insight into the conservation and development of FAnGR. The analysis can be performed at different levels. The level structure allows analyzing the conservation problem from general down to specific perspectives. An essential part of the process is the quantification of the driving factors and the deduced strategies. The across-breed analysis of the 13 European local cattle breeds highlights the consistency of irrelevant factors. There is high heterogeneity among the most relevant factors and strategies. However, the strategies increase eligibility as they lose specificity. Thus, the strategies embracing many breeds should refer to general issues, whereas the specific strategies and actions should be identified at breed level. Moreover, the most promising factors and strategies emphasize the importance of positive aspects (strengths and opportunities) of the current situation of European local cattle breeds.
Acknowledgments
The authors thank farmers and stakeholders participating in the survey. They also thank the breeders’ association of the 13 local breeds, and all scientists involved in the EURECA Consortium for their support to the study. They acknowledge the EU (012 AGRIGENRES 870/2004) and the Institutions of the EURECA Consortium for their support and funding.
Supplementary materials
For supplementary materials referred to in this article, please visit http://dx.doi.org/doi:10.1017/S175173111200242X