


Background
Understanding what the thirteenth-century agricultural landscape of Buchan may have looked like is fraught with many uncertainties caused by a scarcity of evidence. Nearly forty years ago, Whyte (Reference Whyte1981) suggested that the views of Scottish rural settlement were oversimplified (4) and suggested that a multidisciplinary approach, including the excavation of deserted settlements, was required to address this shortcoming (15). The Murrays work at Rattray (1992) has demonstrated the importance of such work but, sadly, general economic constraints and the reliance on developer-led funding militates against such work. Occasional chance finds through development, such as at Kintore (Kilpatrick, Reference Kilpatrick2017), are welcome but necessarily lacking in wider contextual data. Whyte, reviewing progress in rural settlement studies in Reference Whyte1998 notes some noteworthy advances in the Highlands and Borders and the important work at Rattray. However, the concluding remarks (83) still lament the lack of study in lowland areas as well as the need to use documentary data more resourcefully. Macinnes (Reference Macinnes2003), in assessing recent work, drew attention to recent projects undertaken across Scotland. North of the Central belt, none of them considered lowland land-use and settlement. In the same volume, Dixon (Reference Dixon and Govan2003) lauds Whyte’s documentary approach and suggests twelfth- and thirteenth-century settlement patterns may have been truncated (55). He goes on to note the difficulties involved in understanding Scottish settlement evidence where the archaeological and documentary evidence are largely frequently mutually exclusive in their survival: good archaeology in the uplands; good documentary evidence for the lowlands (57). This may well have helped to foster the upland-lowland dichotomy frequently encountered in settlement studies in Scotland. In his conclusion (63), Dixon falls back on this dichotomy and suggests low-lying ‘champion’ country juxtaposed to upland dispersed patterns. The discussion here will consider the possibility of a greater degree of overlap between pastoral and arable systems within a topographically diverse zone of north-east Scotland.
However, this discursus may be considered something approaching a voyage of faith and optimism as an attempt to weave a credible narrative from the few remaining shreds of historical and archaeological evidence available. Even charters surviving from the powerful earls of Buchan account for little more than two dozen examples spanning the entire twelfth and thirteenth centuries. Fortunately, ecclesiastical taxations of the parishes in the thirteenth century are available from three separate manuscripts: the Registrum Epicopatus Aberdonensis (hereafter REA, I, II), the Liber Cartarum Prioratus Sancti Andree in Scotia (hereafter Liber St Andr.) and the Liber St Thome de Aberbrothoc, I (hereafter Arb. Lib., I, II). Little bits of suggestive material can also be gleaned from the slight charter data, while the landscape and place-name evidence adds to the picture. Later in date but also useful are the more detailed lists of obligations found in the ‘Illustrations of the Topography and Antiquities of the Shires of Aberdeen and Banff’ (Ill. A&B: i–iv). These comprise a rental of the lands of Deer Abbey and tithe rentals for the parishes of Deer and Peter Ugie. Later still is a rental pertaining to the lands of Fedderate of c. 1690, the seventeenth-century Land Tax Rolls for Banffshire and Aberdeenshire and the Aberdeenshire Poll Tax returns of 1696. The last mentioned represents an incomplete coverage of the area as the tax obligations of Banffshire fail to survive to the same extent as the Aberdeenshire records. Trading records pertaining to the burghs of Aberdeen and Banff at the turn of the thirteenth century have been used by Ditchburn (Reference Ditchburn1990), Campbell (Reference Campbell2008), and Rorke (Reference Rorke2006) to provide a glimpse of the extent of the exports from the area. Clearly, these cannot be directly related to sites of product-origin as defined on a map but are useful for demonstrating overall sheep productivity from the areas of Aberdeenshire and Banffshire. McNeill and MacQueen (Reference McNeill and MacQueen1996) graphically demonstrate the importance of Aberdeen’s role in the Scottish export trade during the fourteenth century. One legal case in particular from the ‘Acts of the Lords of Council in Civil Causes, Volume 1’ has been particularly insightful with respect to pastoral activities in the area in the later fifteenth century.
Further to the economic detail provided by these documents, the place-name evidence can be used to suggest a rough chronology based upon changing linguistic roots and as indicators of possible types of land use. This may suggest areas of predominant pasture and areas of greater arable production. This evidence can be used in conjunction with other place-name elements that indicate political and ecclesiastical centres. Finally, the topography and landscape themselves contain their own sets of identifying markers relating to soils, geology and altitude. All these impacted upon different agricultural strategies and socioeconomic potentials. In the unlikely expectation that more financial records of the period will miraculously appear, it seems prudent to attempt to work with what is available in order to try to understand how the land was managed in the late Middle Ages.
Introduction
The evidential strands noted above will be ordered in three sections. Firstly, documentary evidence for the productive capacity of the North East between the Rivers Don and Deveron will be considered in order to give an overview of its economic potential during the thirteenth century. The Urie has been included, although not lying within the later Earldom of Buchan, as it contains complementary evidence that is useful to the enquiry.Footnote 1 Secondly, the geological background and land-use potential of the North East will be assessed in relation to changing economic outputs and possible population densities during the thirteenth and seventeenth centuries. The third part will look at how these developments may be perceived with regard to changes in landholding and land-use strategies. Finally, these strands of evidence will be considered with a view to understanding the socioeconomic relationship of the Central Uplands of Buchan to the surrounding lower-lying lands during these periods.
Late medieval agricultural strategies in Buchan as evidenced by documentary and landscape evidence
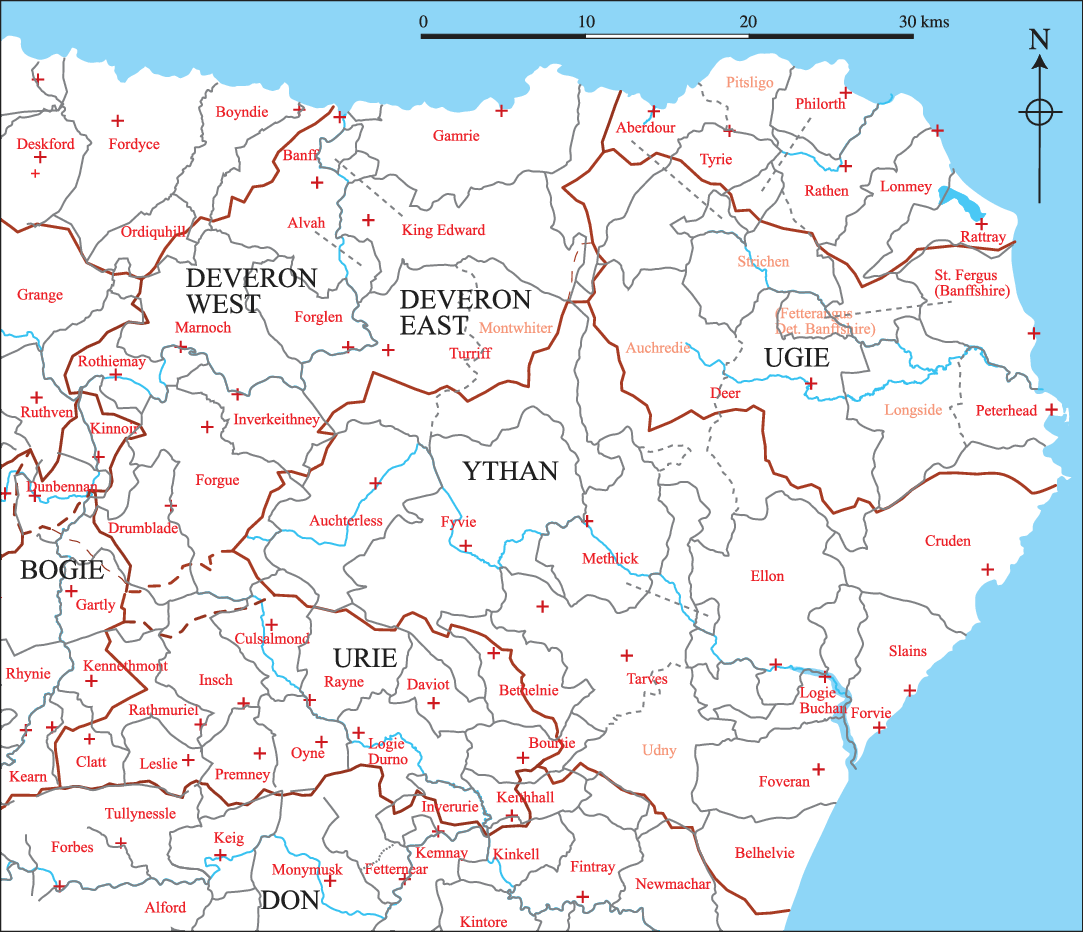
Figure 1 shows a generalised view of the parishes of the North East. The boundaries of some were altered between the thirteenth and seventeenth centuries: some parishes disappeared and new ones were introduced. The Aberdeenshire parishes of the 1690s can be fairly well identified with reference to place-name data within the 1696 Poll Tax records. But, the lack of that evidence for most of Banffshire means that the boundaries of many of the seventeenth-century parishes of that county have to be guessed. The names in orange on the figure indicate parishes that were introduced after the Reformation. Dotted boundary lines indicate those later subdivisions. Dotted straight lines link isolated parts of parent parishes and are useful in suggesting former religious or political ties between those areas of land. The two isolated parts of Philorth and Aberdour parishes in the Ugie catchment suggest that the parish of Tyrie, though present in thirteenth-century records, may have been created out of parts of those other two parishes at some earlier time. The parish of St Fergus and its isolated chapel of Fetterangus may suggest a further engrossment, in this case of Lonmey. The isolated portion of Methlick may also be indicative of political rearrangements. It may be that Methlick had been carved from Fyvie and Tarves, as some of the eccentric boundaries of those parishes appear to suggest.
River catchments, defined by dark lines indicating watersheds, in relation to the medieval and post-medieval parishes of the North East. Names in orange (light grey) denote later additions and are demarcated from their parent parishes by dotted lines. Original parish churches shown by red crosses. Sources: Compiled from various sources referred to in the text.

The dark red lines in Figure 1 show the watersheds between the major river systems of the study area: the Deveron, Ugie, Ythan and Urie. The Ugie is separated from a smaller area to the north of it where rivers flow into the sea rather than into the Ugie and are considered here as Ugie North and Ugie South. Owing to the problem of surviving evidence from Banffshire, only the Deveron East catchment zone is referred to. The Deveron provided a sociopolitical boundary for more recent periods between Aberdeenshire and Banffshire, though this dividing line may not always have been as dominant as it later became. The parish of Alvah, straddling the river, suggests a period when the river was less politically divisive.
Immediately obvious from Figure 1 is the disparity in size between the parishes across the river catchment zones. The Urie catchment comprises a great many small parishes while the Ythan is dominated by the large parishes of Auchterless, Fyvie, Tarves, Ellon and Cruden. Tarves had formerly included most of Udny as well. Further north were the two large and subsequently subdivided parishes of Deer and Turriff. King Edward and Gamrie were also very sizeable. However, along the North East coast, the parishes were slightly smaller. Whyte notes such disparity with regard to South East Scotland (1981: 5–9) and goes on to utilise seventeenth-century population data to consider population and variations in agricultural regimes. That approach is extended here.
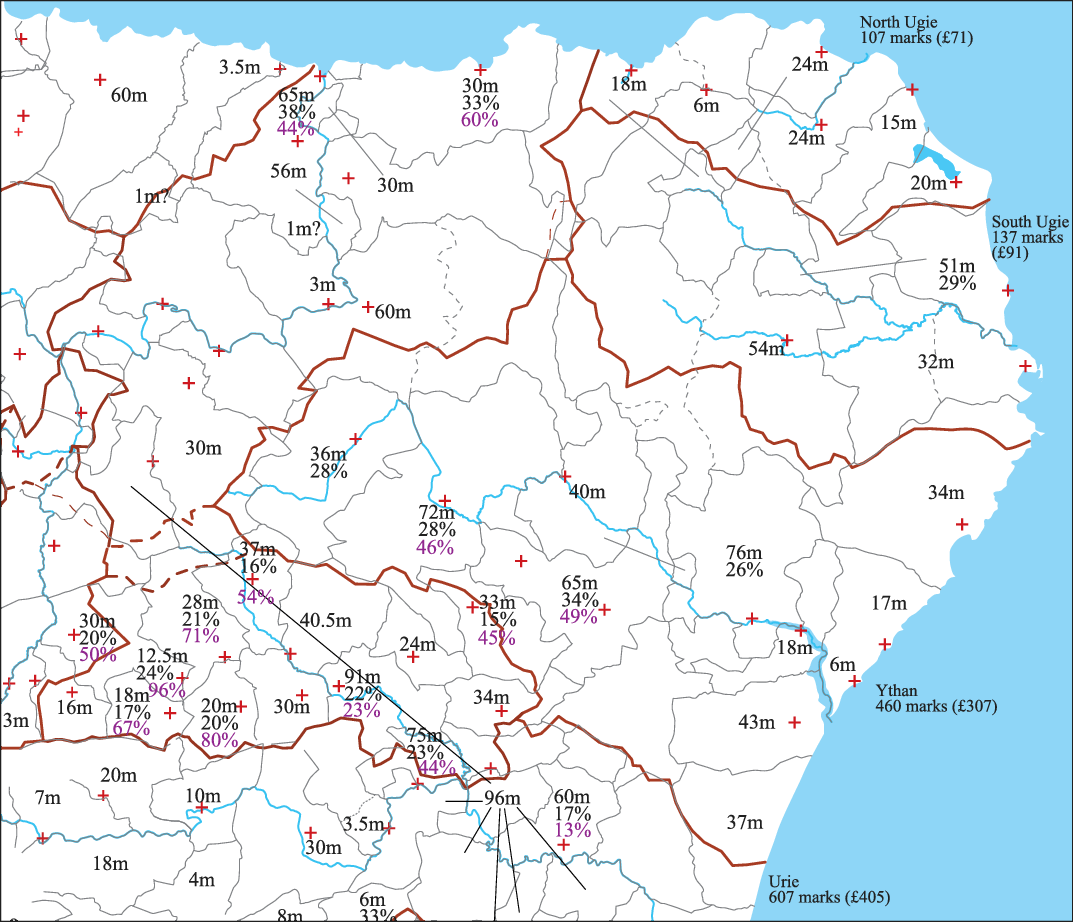
Figure 2 shows the values of the parishes as indicated by church ‘taxations’ recorded in the ecclesiastical records of Aberdeen, St Andrews and Arbroath (REA, I, II; Liber St Andr.; Liber Aberb., I). A supposedly early thirteenth-century taxation record for Scotland is discussed by Gemmill and Mayhew (Reference Gemmill and Mayhew2006) and referred to as the Antiqua Taxatio. The figures contained within the three sources referenced here appear to replicate the totals shown by Gemmill and Mayhew (363) with only minor variations. For example, the figure quoted for St Andrews in the REA is £8,023, while, in the others, it is £8,018. The figures for the individual parishes for Aberdeenshire recorded in the REA also appear to correspond to the totals shown in all four sources, that is, £1,610, once the taxes pertaining to houses outwith the diocese are added in (for example, Arbroath Abbey). The 1257 document in REA is dated internally and there appears to be no contention that it is original. It also appears to predate the later Taxaciones (REA, II: 51–4). This is not the place to debate the dating of these various sources and, regrettably, I feel ill equipped to do so. But, a consideration of the supposed dates of the sources used here does appear to pose a question concerning the accepted early thirteenth-century date of the Antiqua Taxatio. For the purposes of the present article, the dates generally accepted for the three main sources referred to here will continue to be used.
Values of tithes (Scots ‘teinds’) in marks from the later thirteenth-century records with the ‘lesser tithes’ shown as percentages of the total values. Those relating to the later thirteenth-century records shown in black, those from the 1257 record in purple (lower, grey). Sources: Compiled from Registrum Epicopatus Aberdonensis, i & ii (hereafter REA), Liber Cartarum Prioratus Sancti Andree in Scotia (hereafter Liber St Andr.) and Liber St Thome de Aberbrothoc, I (hereafter Liber Aberb).

Those sources present assessments of tithes (Scots ‘teinds’) owed by each parish. Clearly, as teinds were originally paid as a tenth of the produce, these monetary values reflect a commutation at some point in time. However, as the taxes appear to have been recorded during the second half of the thirteenth century (c. 1275), it is unlikely that the conversion from kind to money occurred very much earlier. Oram suggests the formation of parishes across the North East to have occurred as an ongoing development throughout much of the twelfth and thirteenth centuries (Reference Oram2016: 5). Therefore, they may well present a fairly accurate picture of the productivity of each parish at that time. For some parishes, the sources break down the payments into ‘greater’ and ‘lesser’ teinds. The ‘greater’ (or ‘garbal’) teinds provided the income for a canon, while the ‘lesser’ teinds paid for the local vicar (Dowden, Reference Dowden1910: 162–3). The ‘greater’ teinds covered crops that were grown, such as oats and barley, while the ‘lesser’ teinds were constituted by the livestock and livestock products (ibid.). If the figures represent a reasonable reflection of the productive capacity of the individual parishes, the breakdown between greater and lesser teinds may suggest the relative importance of arable and livestock husbandry at that time.
However, such a neat interpretation comes into doubt when an earlier record, of 1257, concerning the teinds (REA, I: 18–26) appears to contradict the slightly later records noted above. The earlier record does not include a monetary cost for the garbal teinds and the ‘lesser’ teinds (referred to in the text as ‘alteragium’ – see below) is, with the exception of one minor instance, significantly higher than in the later record. The differences are shown in Table 1. Furthermore, the 1257 alteragium sometimes consisted of a small portion of the garbal teinds from a specified part of the parish. In other instances, a portion of the alteragium – lambs or wool – were reserved to the respective abbeys along with their garbal teinds. This occurred in the cases of Fyvie, Tarves and Kennethmont (see Table 1). Dowden argues convincingly (Reference Dowden1910: 137–8) from these instances of reserved teinds, along with similar instances from the churches of Turneberie and Rutherglen pertaining to the monastery of Paisley, that the term alteragium was used to define certain allowances of small teinds made to the vicar. As offerings made at the altar could be seen as providing sustenance to the incumbent, presumably this idea led to an association between both sets of income for the vicar. A similar conflation may be visible with respect to the payments of ‘elementemoney’ recorded in the mid eighteenth-century rental for Banff and Down (MS 3175/M/B100). This term presumably relates to the notion of ‘alms’ and is a corruption from a range of terms associated with ‘communion elements’, presumably originally related to offerings made at the altar for the benefit of the vicar. (See, for example, New Statistical Accounts of Scotland: Forgue, Aberdeenshire: 605–06.) The fermtouns noted in the Banff and Down rental that were liable for these payments were those lying in the upland areas of the parishes involved. In other words, just those that in other rentals in the area retained a higher rate of livestock render. These, as in the case of Deer discussed below, probably contain residual memories of small teind payments.
Showing relative values placed upon lesser teinds in 1257 and c. 1275

|
Sources: Compiled from REA, I, II; Liber St Andr.; Liber Aberb, I.
It is suggested that the earlier 1257 record more faithfully reflects the value of the livestock portion as commuted to a monetary equivalent. Stocking levels may have been considered to be more predictable than the grain harvest. However, the later figures may well reflect the actual amount that was paid back from the teinds by the respective abbeys to pay for wages of the local vicar or priest along with other running costs of the local churches. These would have been considerably lower than the full value of the alteragium as received by the abbeys. As the later figures are considered to reflect an assessment carried out at the time of the papal taxation undertaken by Bagimond (more correctly, Boemundo di Vezza [Watt, Reference Watt2001: 1]), such creative accountancy may have helped limit the level of assessment made by the papal tax appointee. As Watt wryly notes (9–10), this attempt at ‘tax dodging’ was certainly recorded in England and it might be assumed that the Scottish bishops are likely to have ‘erred’ in the same fashion. Perhaps, also, it was easier to hide livestock than it was fields of oats and barley. Admittedly, this is only one suggestion for the discrepancies between the two sets of figures. On the other hand, the papal appointees were perhaps not so easily hoodwinked. Most of the assessments (Scot. Hist. Soc. Misc., 1939: 40–4) are above the supposed 10 per cent of total value. The obvious exceptions are in cases where church teinds were owed to ecclesiastical authorities outwith the area: Arbroath, Lindores and St Andrews. These places were assessed separately and the figures lumped together as a total.
As an indication that the teind figures had been almost completely fixed as a monetary amount as opposed to an annually fluctuating teind drawn as 10 per cent of the actual productivity of the parish, the examples of Inverurie, Fintray and Durno may be cited. These three parishes were still paying part, at least, of their garbal teind in kind. But, even then it had been fixed at a specific quantity rather than as an annually fluctuating 10 per cent render. This does not seem to have been the case a few years earlier in 1257, except with regard to the lesser teinds. In other words, it does seem likely that this period was witnessing the change from renders in kind to a fixed tax based upon the productive capacity of the parish. With regard to this discussion, the important question is how accurately the figures reflect the productive capacity of the parishes and whether assumptions concerning the ways that the land was managed may be drawn from those figures.
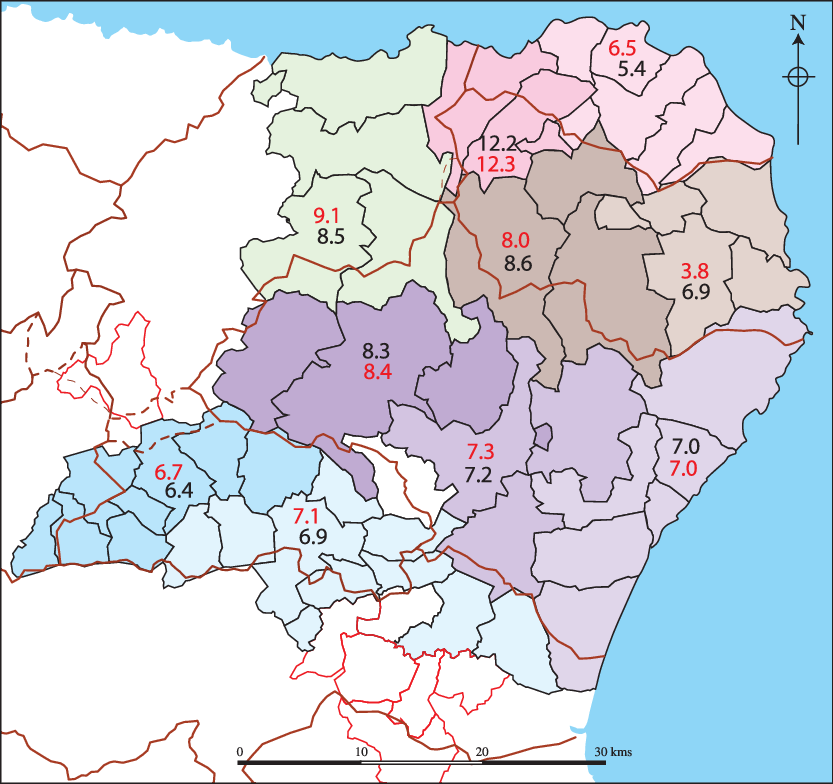
Figure 2 shows the c. 1275 total taxation figure along with two sets of percentages as drawn from Table 1. The upper figures (in black) express the lesser teinds of c. 1275 shown as a percentage of the total figure. The lower figures (in purple) express the lesser teinds recorded in 1257 as a percentage of the total figure. The differences, as noted above, are quite extreme. Some observations are worth considering.
Firstly, the two lowest proportions of lesser teinds from the 1257 assessment coincide with two of the three parishes paying the highest rates of garbal teinds in kind in c. 1275. These lie along the river gravels and floodplain of the Rivers Don and its tributary, the Urie and are still highly productive arable lands. The lands that appear to show the greatest decline in the value of the lesser teinds lie further west along the Urie within the Garioch. The value in Insch appears to have tumbled from 96 per cent to 24 per cent and, in Premnay, from 80 per cent to 20 per cent. Do these reflect genuine changes in value or do other factors account for the change?Footnote 2 Further north, in the Deveron and Ythan catchments, the differences appear not to be as extreme.
The Urie is also the area that contains a much higher proportion of smaller parishes and, arguably, a greater density of population. (This will be returned to below in discussions concerning densities of church and chapel sites as possible population proxies.) It may be argued that the Urie catchment did witness a greater intensification of arable farming than other areas during the mid-thirteenth century. These lands largely coincided with the Lordship of the Garioch, carved out for Earl David of Huntingdon at the end of the twelfth century by his brother William the Lion. Eighteenth-century estate plan evidence shows a pattern of planned open fields and villages that would not be out of place in other topographically similar places elsewhere in Britain. Excavated evidence from Druminnor Castle at the extreme west end of the Garioch suggests a ramping up of arable production there during the second half of the twelfth century (Shepherd, Reference Shepherd2018). Though Stringer suggests that this may have been simply the tail end of a process leading to full exploitation (Reference Stringer1985: 62), the rentals, perhaps, suggest a change in type of exploitation.
If the record can be taken to indicate a genuine decline in livestock production at the expense of an increase in arable production in the Garioch (Urie catchment), it would follow that the area was formerly richer in pastoral output. Also, that the areas to the north were maintaining their previous level of livestock to a greater extent. At this point, it may be worth considering the much later teind record from Deer Abbey. This dates to 1544 (Ill. A&B: iv, 19–29).
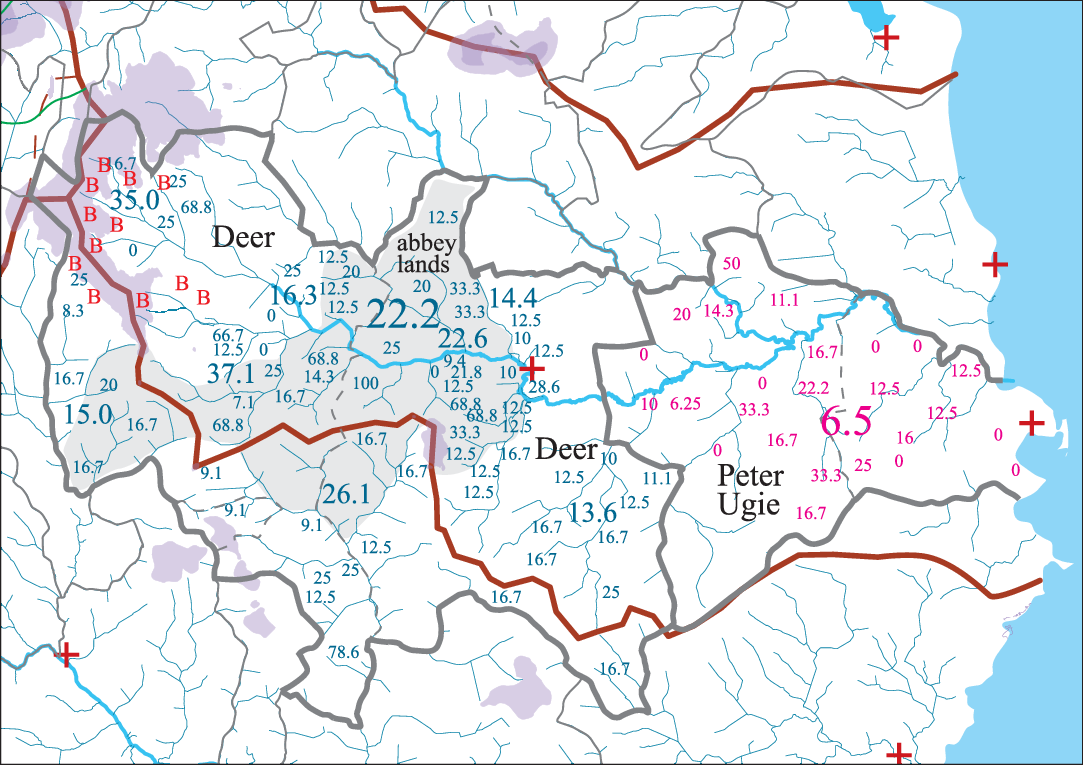
While the lands pertaining to the abbeys of Arbroath and Lindores and the priory lands of St Andrews were remote from their foundations, the teinds from the parish of Deer in the Ugie and Ythan catchments lay around and about their parent Abbey. This is presumably the reason why those teinds were still being paid in kind in the mid-sixteenth century.Footnote 3 Deer Abbey appears to have been granted the teinds of the parishes of both Deer and Peter Ugie, the latter lying between Deer and the North Sea.Footnote 4 The relative proportions of sheep to grain can be calculated for each of the individual fermtouns in both parishes. Figure 3 shows the sheep contribution to the teinds as a percentage of the total teind. The lower-lying lands contain a lower proportion of livestock renders compared to the higher lands to the west. This pattern can be replicated for a later date in the parish of King Edward (MS 3175/M/B100) on the west side of these uplands as demonstrated in a rental of the late eighteenth century and within the estate of Banff and Down in 1741. It is comforting to note that the least livestock-oriented renders occur towards the coast and the most towards the uplands. This suggests that the rents do, in fact, reflect actual productive capacities. Areas marked with a red ‘B’ are taken from the Fedderate rental of 1690 (Ill. A&B: ii, 442–4) and show those fermtouns liable to rents that contained all of: sheep, lambs, butter and peats. Clearly, these were upland farms engaged to some extent in animal husbandry.
Sixteenth-century parishes of Deer and Peter Ugie showing relative percentages of livestock (sheep) to grain based upon numbers of sheep compared to bolls of ‘victual’ – in this case, oats. Purple (light grey) depicts land over 150 m and mid-grey indicates Deer Abbey lands. Small numbers show individual fermtoun renders, middling numbers are localised groupings of the fermtouns while large numbers denote the overall parish totals of percentage of sheep to bolls of grain as taken from the Deer Tithe Rental of 1544 (Ill. A&B: iv, 19–29). Letters ‘B’ denote those areas rendering sheep, lambs, butter and peats in the later Fedderate rental of 1690 (Ill. A&B: ii, 442–4).

Figure 3, therefore, appears to demonstrate a gradual change in farm management the further the fermtouns are sited from the coast and the further inland and upland they are. The Abbey’s lands contain only two areas of highly productive arable land with quite a number of livestock-oriented fermtouns. It may well be that this is a reflection of the Cistercian zeal for sheep husbandry (Ill. A&B: ii, 419). The Fedderate lands to the west of the Abbey comprised the highest land in the parish and show the highest percentage of livestock teinds. These lands were granted by Fergus earl of Buchan to John son of Uhtred in 1204–17 in exchange for the lands of Cruden and Slains (Coll. A&B: 407–09).Footnote 5 The former lands are likely to have provided far greater arable potential than the uplands received in their stead. This might suggest a different way of viewing agricultural potential at that time compared with later perceptions skewed towards grain production. Intensive arable production need not have lead to greater profit margins at this time.
The evidence from the taxations and rentals appear to suggest developmental changes and ecological targeting across the North East. In 1257, the most intensive arable appears to have lain in the parishes of Logie Durno, Inverurie and Fintray in the lower reaches of the Urie and Don. At this time, the west end of the Garioch (and the original ‘Garioch’ – ‘place of roughness’, according to Stringer, Reference Stringer1985: 66) paid a higher proportion of teinds in animal produce. This appears to have changed dramatically between then and c. 1275 when it appears also to have become an area of high-yielding arable production (see below). Meanwhile, the areas to the north in the Deveron and Ythan catchments may have remained important livestock-producing areas. This situation continued well into the 1600s. With this hypothesis in mind, it is now worth considering other aspects of the social and political landscape to see whether they bear out this picture.
Landscape, land-use and economic change in late medieval Buchan
One of the more interesting facets of the North East landscape is the extreme difference in the sizes of the parishes. As noted above, the parishes of the Garioch (Urie catchment) are very small compared to the Deveron and Ythan areas with the North Ugie providing parishes of an intermediate size. A further strand of evidence that may be used to interrogate this apparent ecclesiastical imbalance is provided by place names that contain elements associated with sites of political assemblies and judgment along with lesser ecclesiastical sites. Scots assembly and judicial toponyms considered include the words ‘law’ and ‘gallows’, while the Gaelic/Pictish assembly toponyms ‘maud’ and ‘conval’ (see O’Grady, Reference O’Grady2014) have also been used.
It is suggested that it is possible to assess this evidence by considering the occurrence of named elements of this social landscape in relation to the actual square area of land they are presumed associated with. When the number of places of worship per square kilometre (sq km) is compared with how many places of assembly occur, the results suggest that ecclesiastical and socio-political focii may not have been so disparate as the differing sizes of the parishes themselves might indicate. Table 2 shows their distribution across the area per sq km. With the exception of Upper South Ugie, the densities fall within ten and twenty-five sq km per ecclesiastical and assembly site. Upper South Ugie may have been treated differently as this area was associated with the large Cistercian Abbey of Deer. As might be expected, the uplands appear to demonstrate a greater dispersal of assembly sites than the lower-lying parishes. It is suggested that this may well reflect population densities in the thirteenth century. Oram considers the interior of Buchan to have been a thinly populated zone of ‘poor and stony or boggy land’ (Reference Oram2016: 2).
Showing densities of ecclesiastical and socio-political sites

|
Source: Data compiled by author from sources referenced. See Appendix for digest of data generated.
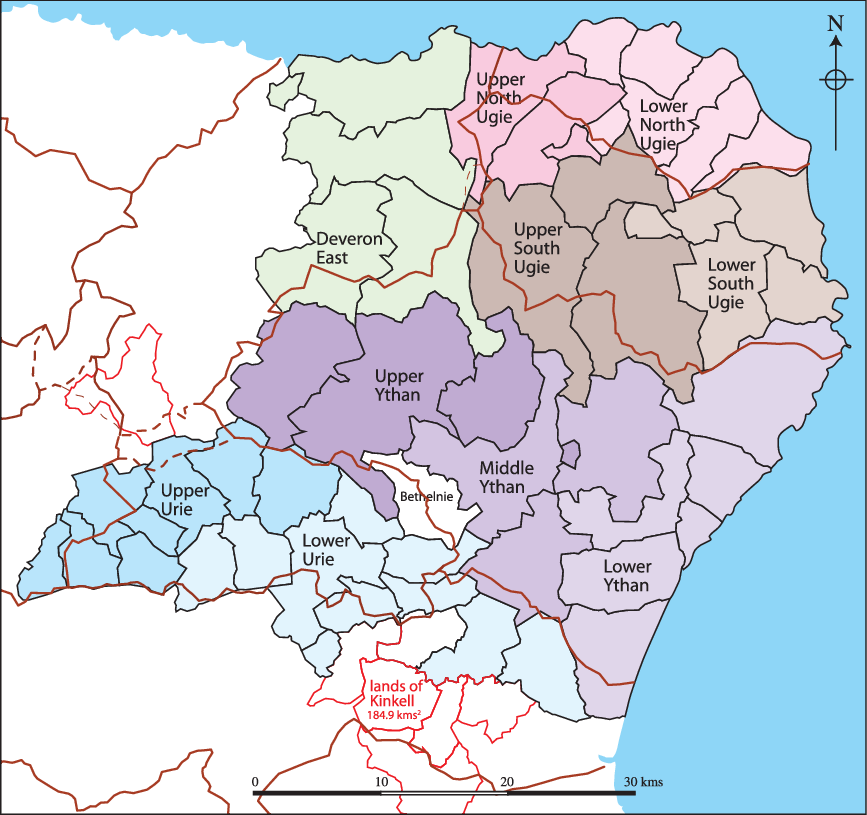
In this study all data collection and assessments have been carried out at the scale of the parish, with each parish being assigned to a river sub-catchment zone (as defined in Figure 4). Not all parishes finish neatly on a watershed and so there is a degree of overlap. For the purposes of this study, this overlap has been ignored and parish boundaries have been used as the defining bounds rather than the watersheds. The latter provide a convenient way to describe parish groupings. All official government and ecclesiastical data used are ordered according to parish boundaries, which, conveniently for this article, appear to have remained fairly stable between the thirteenth and late seventeenth centuries.
Map of study area showing river ‘sub-catchment’ zones.

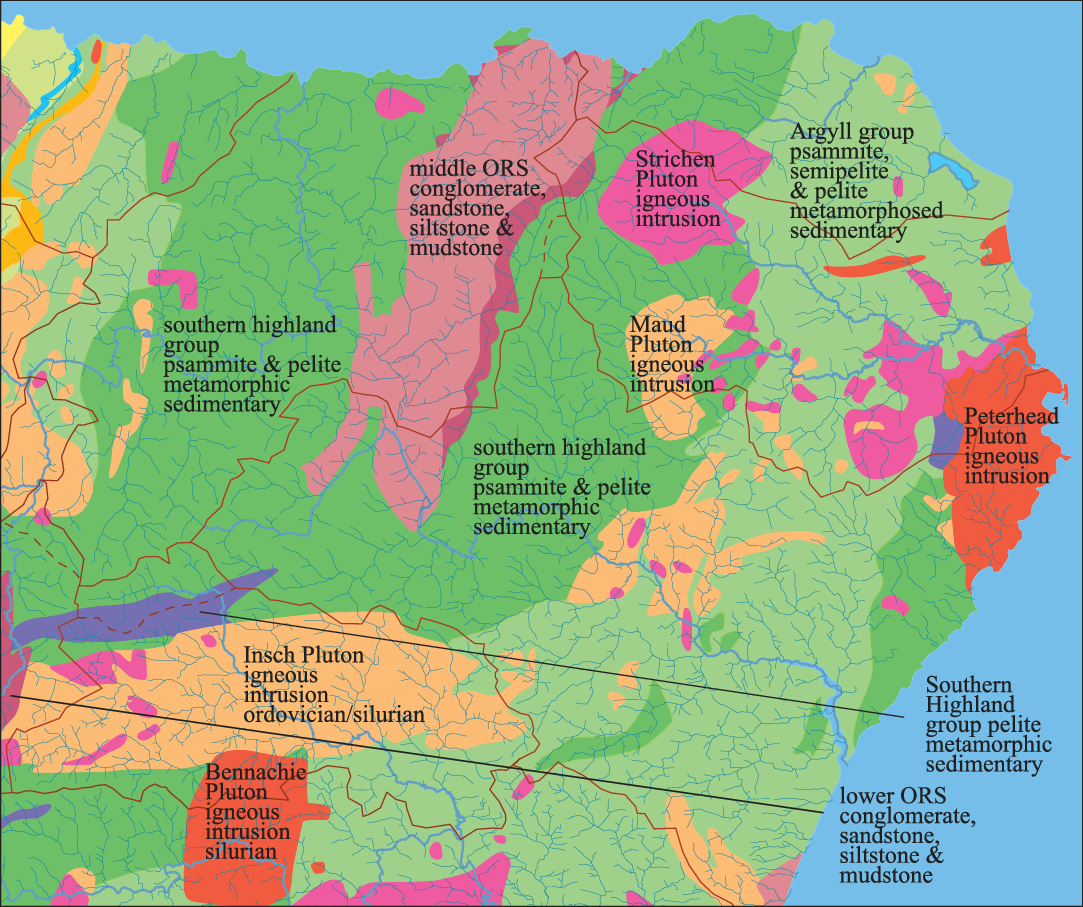
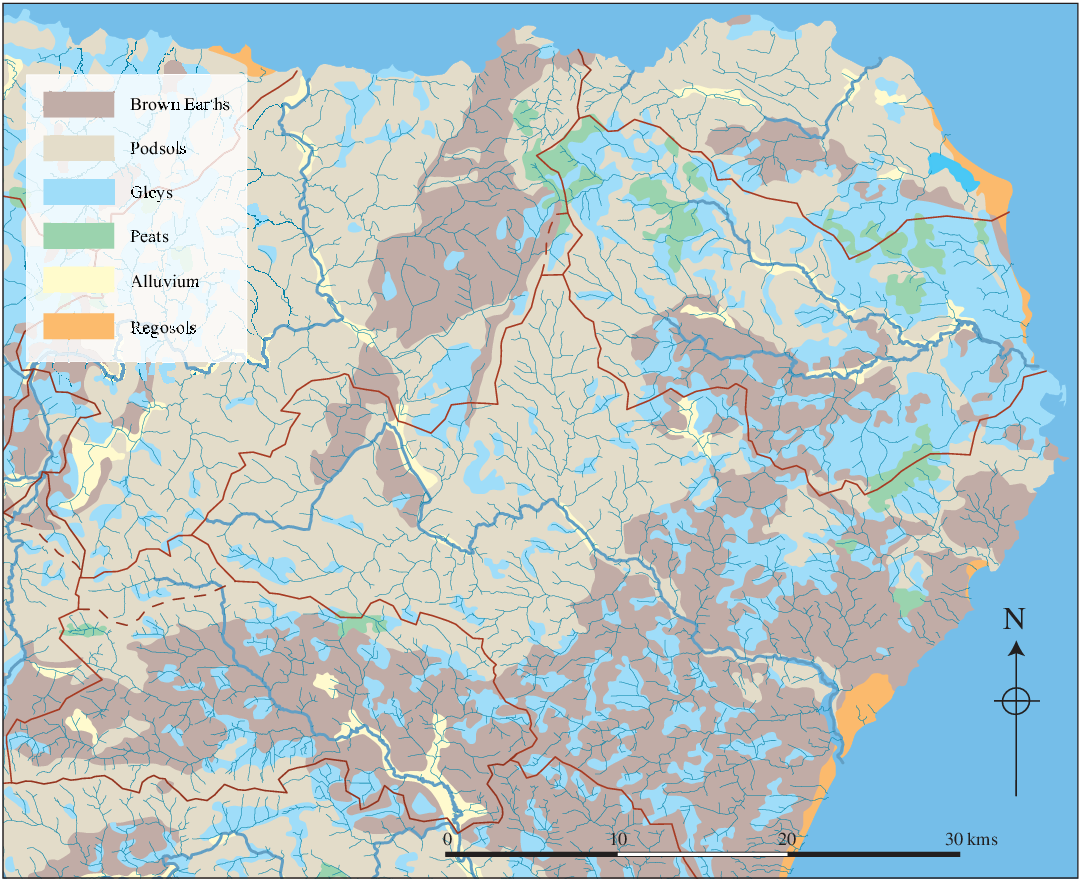
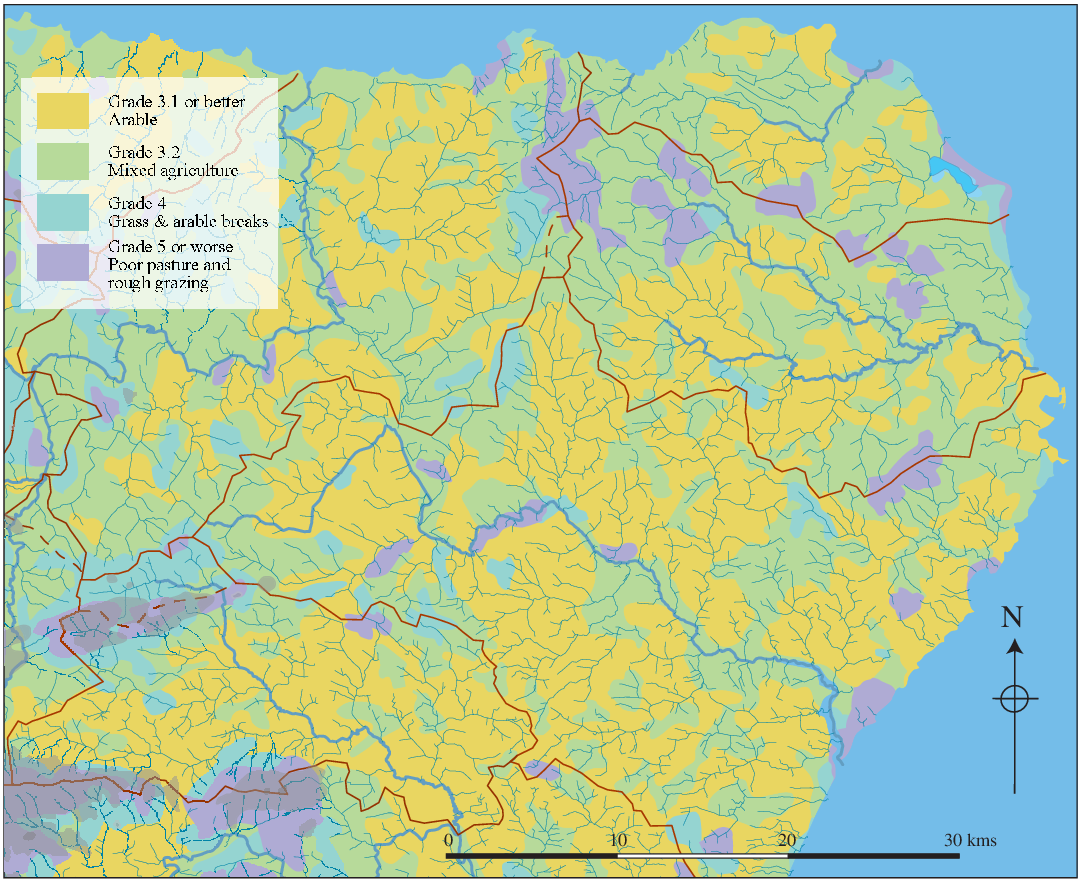
Within each sub-catchment there are tremendous variations in geology, topography and soils. However, across the region, the same general mix is found in all river catchments. Figures 5, 6 and 7 show simplified maps of the geology (British Geological Surveys, 2018), soils (Macaulay Institute, 1984) and land capability for agriculture (Macaulay Institute, 1983). In general terms, the North East comprises metamorphosed sedimentary rocks pierced by various igneous intrusions. Only one substantial area of Old Red Sandstone exists, mainly within the East Deveron catchment but creeping over into parts of the Ugie and Ythan catchments. A second smaller portion survives at the extreme west end of the Garioch in Strathbogie, penetrating into Kearn parish.
Simplified geology of the North East.
Source: Contains British Geological Survey materials © NERC 2018.

Simplified soil coverage of the North East. The major watersheds are shown by the brown lines.
Source: Based upon data taken from the Macaulay Institute Soil Survey, 1984.

Simplified Land Capability for Agriculture for the North East. The major watersheds are shown by the brown lines and the high ground in the south-west quadrant is shown in grey.
Source: Based upon The Macaulay Institute for Soil Research, Land Capability for Agriculture maps of Scotland, 1983.

With respect to soils, the brown earths and gleys conform to the Old Red Sandstone, Insch Pluton and Argyll groups of metamorphosed sedimentary rocks. The Southern Highland group of metamorphosed sedimentary rocks are generally capped by podsols. The Urie catchment, therefore, comprises a greater proportion of brown earths than any of the other catchments. The Ugie appears to have the most limited amount of brown earths, though the South Ugie zone is much better served than the North Ugie zone, which contains almost no brown earths at all. The watershed – if it may be called that – between the North and South Ugie zones is largely an area of gleys and peats. The Ythan catchment may be seen as a catchment of two halves: the Lower Ythan comprising brown earths and gleys and the upper Ythan composed almost entirely of podsols. It should be noted, however, that some of these podsols may well have originally had a thin covering of Brown Earths that may have eroded or been eroded by former agricultural practices. In other words, what we see today may not accurately reflect the land as experienced in the past.
In terms of the Land Capability for Agriculture as assessed for modern day farming protocols, there is probably not too much to chose between the different catchments, except that the Ugie probably fares least well. However, this assessment makes a presumption that arable land is of greater worth than other land. In the High Middle Ages, in southern Britain, meadowland was considered to possess a much greater worth than arable land (Bailey, Reference Bailey2002: 67–9). This last point may be of considerable importance for this study. As can be seen by Table 3, by the middle of the seventeenth century, the Lower Ugies had been transformed from very poor into very valuable, arable landscapes. The parish valuations of c. 1275 and the land tax assessments of 1674 permit a view of the productive capacity of the area at two separate dates. The thirteenth-century assessments were based upon the productive capacity of the land to furnish the ecclesiastical teinds. The 1674 assessment was a valuation of the rental value of the land and was also based upon the presumed productive capacity of the land.
Productive capacity per sq km

|
Sources: Data taken from thirteenth-century ecclesiastical rentals and Land Tax Rolls of 1674. See Appendix for digest of data generated.
Table 3 shows the productive capacities of the 10 subzones per sq km c. 1275 and 1674. During the thirteenth century the Lower Urie was by far the most valuable area per sq km with the Upper Urie in second place. In contrast, the Upper North and South Ugies were the least valuable. By 1674, the situation had changed dramatically across the board with the Middle Ythan and Lower South and Lower North Ugies having knocked the Upper Urie off its former high second place. Next most valuable were the Lower Ythan, Lower Urie and Lower South Ugie. In other words, the lower-lying lands that are still today the most grain-productive were the most valuable during the seventeenth century. The Upper North Ugie and other uplands remained the least valuable lands and were similarly valued less than the lower lands. It appears, therefore, that the lower-lying lands had increased in value while the uplands had not. Both Upper and Lower Uries were valued about the same as they had been in the thirteenth century with the Lower Ugies becoming quite similarly valued to other lower-lying lands.
Table 4 considers the land values with respect to ecclesiastical sites in the subzones. It has been suggested above that the density of ecclesiastical and assembly sites may indicate relative population density for a period during which we have no population figures. The relative thirteenth-century values shown in Table 4 do, in fact, appear to track the thirteenth-century values shown in Table 3 though with a couple of inconsistencies. The depressed values of the Urie zones is occasioned by the small sizes of the parishes, as commented on above. Although value per sq km is high, when this is divided by a large number of ecclesiastical sites – parish churches and chapels – the value per ecclesiastical unit appears much lower. A similar situation pertains to the Lower Ugie rivers where an apparent increase in chapel sites over time led to a reduction in relative value compared with the value per sq km. Upper South Ugie shows the opposite movement occasioned by the continuing very low incidence of ecclesiastical sites there. This remains a bit of a conundrum owing to the presence of the Abbey of Deer in this area. One possibility is that the presence of a relatively large number of priests within a fairly large dispersed local population (see Table 5) meant that discrete chapels were considered costly and impractical. Individual priests visiting their flock in their homes or at localised meeting places may have been considered a more efficient use of resources.
Value of subzones compared with numbers of ecclesiastical sites

|
Sources: Data taken from thirteenth-century ecclesiastical rentals and Land Tax Rolls of 1674. See Appendix for digest of data generated.
1696 Population per sq km compared with population per ecclesiastical site

|
Source: Population data from 1696 Poll Tax record. See Appendix for digest of data generated.
Table 5 considers the 1696Footnote 6 population per sq km and compares that with the population per known ecclesiastical site. It should be remembered that these sites include parish churches and chapels and that, by the late seventeenth century, many of the latter would have been abandoned after the social onslaught of the Reformation. The ‘View of the Diocese of Aberdeen’ (Coll, A&B) provides a record of pre-Reformation chapels as remembered at the beginning of the eighteenth century. Although incomplete, it gives a good idea of the large number of chapels that had been in existence and has been used in the compilation of data for this article. With the exception of the Upper South Ugie, there appears to be a fairly reasonable correlation between population per sq km and population per ecclesiastical site.
The four tables considered so far do seem to suggest a degree of correlation between pre-Reformation ecclesiastical sites, land valuations and population densities. Only the case of the Upper South Ugie is anomalous and this may be due to exceptional circumstances pertaining to the Abbey. As suggested, it may be that other methods of bringing the sacrament to the surrounding population may have reduced the need for local chapels.
Moving into slightly more speculative realms, Table 6 shows the late seventeenth-century land values per person and suggested figures for c. 1275 based upon the 1696 population. The Land Tax figures for 1674 cannot be doubted and give a good indication of perceived land values across the North East at that time. It is noteworthy that the most valuable lands are again the lower reaches of the Ythan, Urie and South Ugie, but with the Middle Ythan being the most valuable.
Productive capacity per person per parish

|
Sources: Based upon the thirteenth-century ecclesiastical sources, the 1674 Land Tax Rolls and the 1696 Poll Tax population record. See Appendix for digest of data generated.
It has been suggested that the population of Scotland varied little between the fourteenth century and the eighteenth century (Campbell, Reference Campbell2008: 925–36). Gemmill and Mayhew (Reference Gemmill and Mayhew2006: 369–70) note that the plague is likely to have hit Scotland fairly hard and, it might be presumed, population growth through the thirteenth century will have been knocked back during the fourteenth. Neville notes (Reference Neville2010: 148) that there had been a general economic transformation amongst the servile classes by c. 1350. It is hard not to consider that reduced population numbers and an improved bargaining position had effected that change. Clearly, attempts to estimate population figures between the thirteenth and seventeenth centuries may be largely a case of optimistically applied guesswork. But, suggestions for England, based upon a study of twenty-one communities (Clark, Reference Clark2006) propose a national population of 2.38 million in 1200 achieving a peak of just under six million at the start of the fourteenth century, reducing to about three million by the mid-century and returning to its 1200 figure by the end of the fifteenth century. Allen (Reference Allen2004: 40) shows the recovery not complete until the mid-sixteenth century and, by the end of the seventeenth, having increased to 6.5 million. In other words, an increase of around 8 per cent over the c. 1300 figure by 1700.
Assuming Gemmill and Mayhew are correct (Reference Gemmill and Mayhew2006: 369–70), there seems no reason to think that population trends in North East Scotland were radically different from those across England. The presumption will, therefore, be made that population figures near the end of the thirteenth century are likely to have been of a similar order to those in 1696. Bearing this in mind, the pattern of ‘value per kilometre square’ results from Table 3 are fairly consistent with the ‘value per person per parish’ pattern shown in Table 6. This may help to further support the view regarding population similarities between the thirteenth and seventeenth centuries.
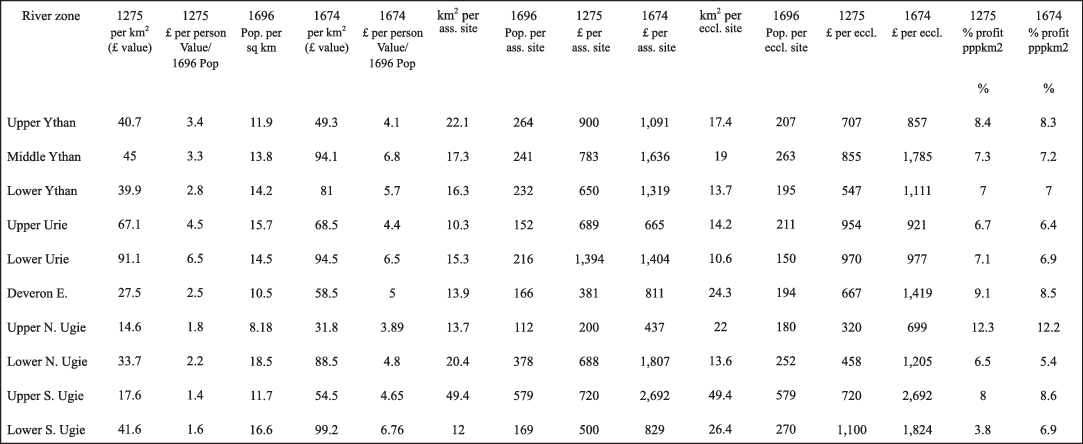
From these bases, Table 7 attempts to create a more precise comparison of the productive capacity per capita of these zones during the two periods by expressing the per person value as a percentage of the value per sq km in order to arrive at a ‘profitability index’ for the two periods. In other words, to show how the inclusion of population figures can alter the value from a calculation based simply on a value per sq km. For example, Kearn at the extreme west end of the Upper Urie zone (more correctly it should probably be in a ‘River Bogie’ zone), had a 1674 value of £34 per sq km against Kennethmont’s £66.6 per sq km. But, when the population was considered (120 against 441), the value profitability index works out at 4.2 for Kearn as against 4.1 for Kennethmont (see Appendix for further data).
Productivity index

|
Sources: Based upon thirteenth-century ecclesiastical taxations, the 1674 Land Tax Rolls and population data taken from the 1696 poll tax returns. See Appendix for digest of data generated.
This appears to suggest that the most profitable zone was the Upper North Ugie. In all other counts, this seemed to be the least profitable zone. A similar situation applies to the Deveron East zone. The two Urie zones that frequently led the parade might be seen to be of middling profitability in this assessment. Only the Upper and Lower South Ugie zones showed any increase in profitability between the thirteenth and seventeenth centuries with all other zones showing a slight decrease.
The tables indicate that the surviving data may be considered in a number of ways. They suggest a means whereby the meagre information surviving from the thirteenth century may be handled in such a way as to generate new forms of data to answer a wide range of questions. These questions include population numbers and densities, associations between official assembly sites and ecclesiastical sites and issues surrounding land use, agro-economics and agricultural strategies. They suggest a range of options concerning how we perceive the success of land management regimes between the ten zones during the thirteenth and seventeenth centuries. A synopsis of the data compiled is shown in Figure 8 and the conclusions reached might be summarised as follows.

Table 2 shows that there are great similarities in the number of ecclesiastical sites and assembly/legal sites across all ten zones and that, with the exception of the aberrant Upper South Ugie zone, the density falls between one every ten to one every twenty-two sq km. The density of assembly/legal sites is slightly greater than for ecclesiastical sites (one per ten to one per twenty-six sq kms sq). Table 5 shows that in 1696 population density (between eleven and eighteen per sq km) corresponded fairly well with ecclesiastical provisioning for that population (between 150 and 270 per ecclesiastical site) Again, with respect to ecclesiastical provisioning, the Upper South Ugie was aberrant, but not with regard to population density. Possible reasons associated with Deer Abbey have been noted above. In other words, population, assembly/legal sites and ecclesiastical sites show a reasonable congruence with population levels in 1696. Clearly, topographical variety in each zone will have led to variations within those zones but the figures indicate an evening out across the separate zones.
When the economics of the different zones are considered, the picture becomes very different. Table 3 shows the tax assessments per sq km and there are wide variations between the zones (between £14 and £91 per sq km for 1275 and between £32 and £99 for 1674). Clearly, this variation cannot be accounted for by population densities, as these have been suggested as having been fairly even in both time periods. (Such population similarities between the thirteenth and seventeenth centuries have been recognised more widely across Britain, as noted above.) But, it is interesting that the differences were less pronounced in the later period. Table 4 considered the value of the zones compared with the number of ecclesiastical sites as another means of considering relative values across the zones. In this instance the differences were less marked for the earlier period but more marked for the later. In 1275 the values varied between £320 and £1,100 per ecclesiastical site and in 1674 between £699 and £2,692. This may indicate that parishes were originally laid out with regard to the productive capacity of the area they were covering as well as population density. This linkage seems to have disappeared through time.
Subsequent analysis was predicated on the assumption that population figures for 1275 were not very different from those of 1696. With this caveat, Table 6 shows the productive capability of each zone in 1275 and 1674. Whereas, in 1275, the value appears to have been fairly distributed in comparison with ecclesiastical sites, when compared to the population density and acreage, the zones appear inequitable. For 1674, a certain evenness returns to the picture. But, by this time, it is known that a very similar agricultural strategy applied fairly uniformly across the North East. It suggests that this may not have been the case in earlier times. Table 7 shows the values and population figures compressed as an ‘index of profitability’.Footnote 7 The similarity between the 1275 and 1674 figures are partly a result of the use of the same population figures for both dates. But, what is most significant is the way that it alters the apparent profitability of the different zones.Footnote 8 It suggests that the data considered here may be used to comprehend different land management strategies between the zones. For example, The Lower Urie clearly produced a greater income per sq km and per person than any other zone during the thirteenth century. The Upper Ugies (South and North) produced least. However, when the value per person is presented as a percentage of the value per sq km in order to give an idea of productivity, the Upper Ugies, along with Deveron East and the Upper Ythan come out above those of the Urie zones. It may be that the upper reaches of these rivers supported a pastoral economy that was less intensive but of higher per capita value. The Lower reaches of the rivers were more densely settled and, presumably, geared towards intensive arable production. The Upper North Ugie carried a population density of 8.2 per sq km in 1696, while the Lower North Ugie supported 18.5 per sq km. As discussed below, Roy’s map of the mid-seventeenth century shows how the ‘Central Uplands’ were, even then, still fairly deficient in open fields and, presumably, population.
It is hoped that this discussion has presented economic figures to support the notion that, while intensive arable production of the lower reaches of the river catchments may have given a high return from land, the uplands could produce greater profit per capita at, perhaps, less risk. Inclement weather generally has a more regular effect on crops than on livestock and, in a premodern, extensive pastoral husbandry, disease is likely to have been less of a problem than under intensive practices. However, as Newfield has shown (Reference Newfield2009: 155–90), an early fourteenth-century cattle ‘panzootic’ caused the loss of innumerable beasts. It also had a knock-on effect for arable agriculture by reducing available dung and oxen for traction. The effects of this plague on Scotland were recorded by John of Fordun (169). Sheep also appear to have been badly affected in England in the 1270s, 1315–20 and the 1360s (Stephenson, Reference Stephenson1988: 381). If these outbreaks affected the whole of Britain, the effects on Scottish arable production is likely to have been as considerable as the effects on its pastoral economy. So, perhaps pastoral farming was still inherently less risky.
Documentary detail and topographic place names as evidence for tenurial and land-use change in late medieval Buchan
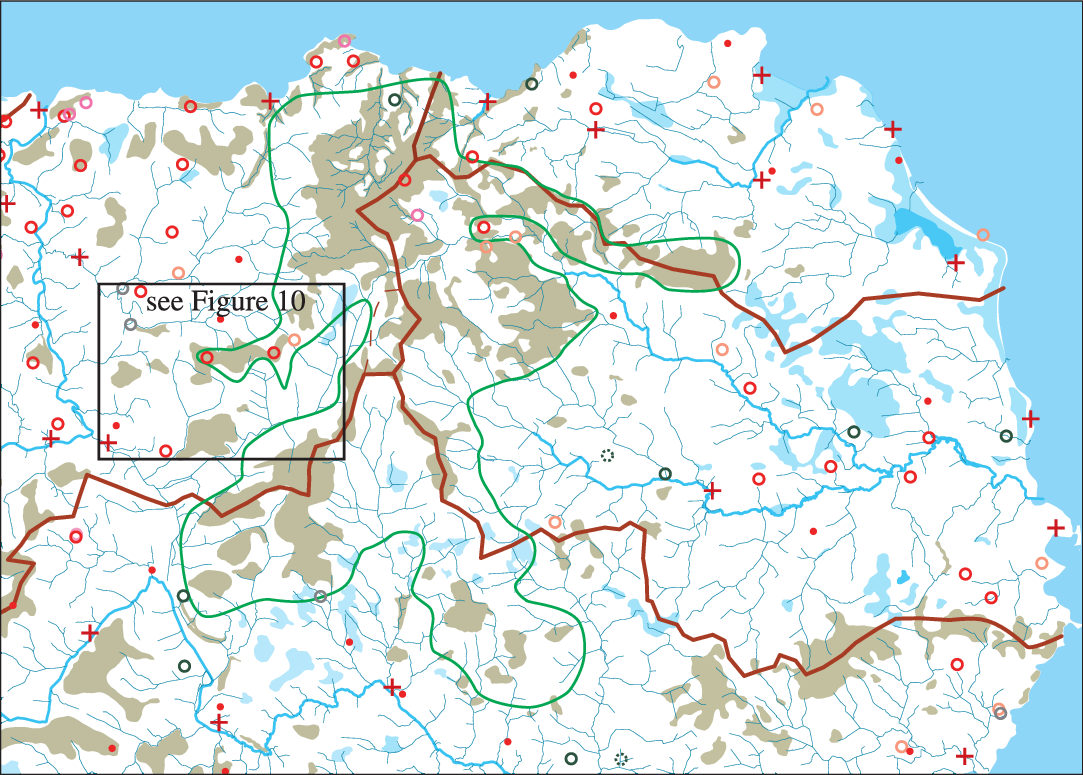
This section will consider the argument made above from topographical and place-name evidence. Figure 9 shows the Central Buchan Uplands in relation to nineteenth-century boggy ground. Clearly, this does not indicate the state of the ground in the thirteenth century but does suggest what was perceived as ‘improvable’ at the end of the eighteenth century. It is presumed that the thirteenth century was milder in the North East and resulted in easier access to subsequently wetter environments. This assumption seems to be underpinned by recent tree ring analysis undertaken in the Cairngorms (Rydval et al., Reference Rydval, Loader, Gunnarson, Druckenbrod, Linderholm, Moreton, Wood and Wilson2017). Although hedged by caveats, the results do appear to show a period of warmer climate centred on 1300, another shorter one c. 1500 and a long, colder period between the mid-sixteenth and the early eighteenth centuries.
Showing some aspects of the topography and social landscape of upland Buchan. Brown shading (darker tint) shows uplands recently drained at the time of the 1st edition OS and light blue (lighter tine) shows lowland areas recently drained at that time. Crosses mark thirteenth-century parish churches and circles mark place names indicative of assembly sites. The Green (dark) line indicates the area here referred to as the ‘Central Buchan Uplands’.

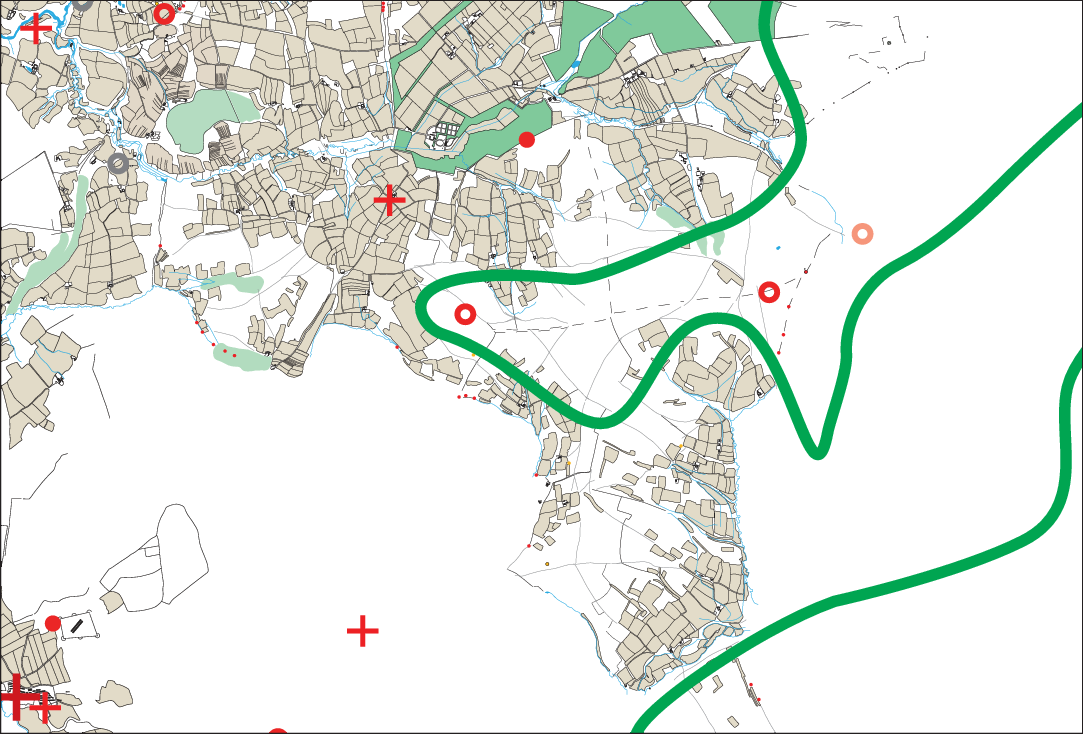
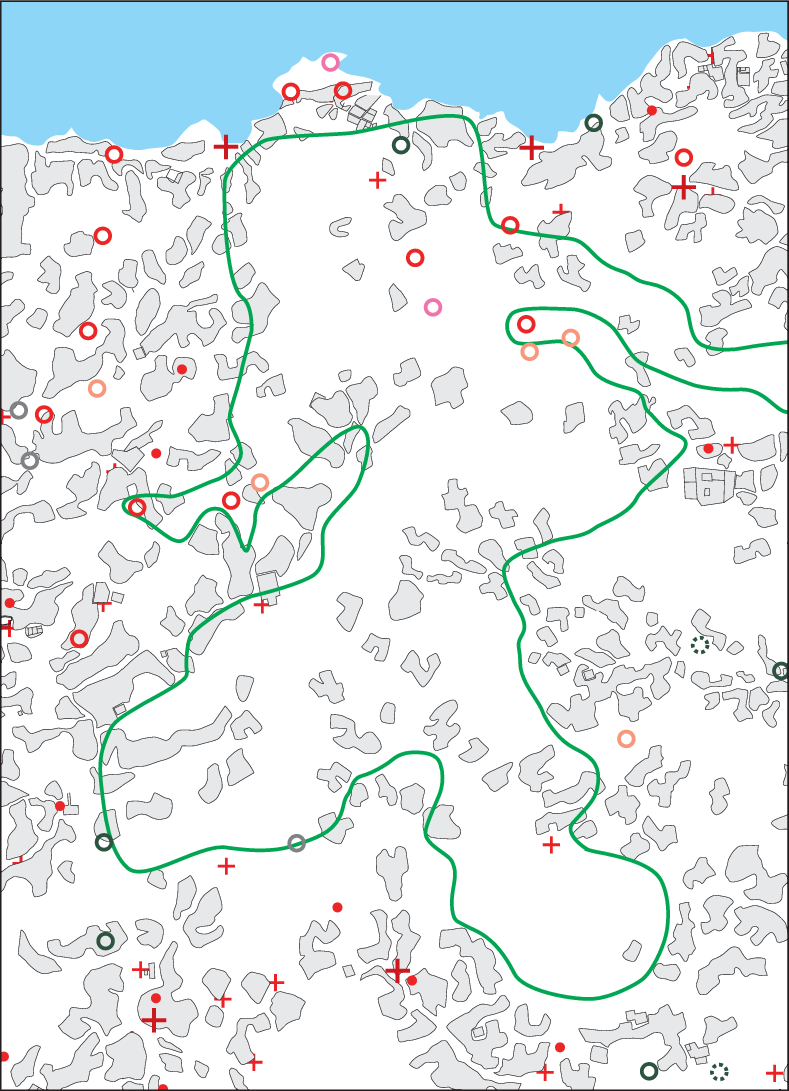
Figure 10 shows an example, taken from the study area, of how the arable fields depicted on eighteenth-century estate plans ran up against the uplands. It might be noted that much of this land carries annotations such as ‘heathery rigs’ or ‘ground formerly laboured’. Consequently, our present perception of distinct (often fenced) boundaries between ‘upland’ and ‘farmed lands’ must be suspended when envisaging historic situations that possessed a much greater degree of flexibility and transience. No hard and fast border between the ‘Central Buchan Uplands’ and the surrounding farmland would have been recognised prior to the late eighteenth or early nineteenth centuries when, at that time, it was undergoing enclosure and drainage. Figure 9 also demonstrates how the upland zone was largely devoid of ecclesiastical sites and assembly sites, while Figure 11 shows the arable areas of the mid-eighteenth century as depicted on Roy’s Military map. It is hard to doubt that this area remained, even in the seventeenth century, a less densely settled landscape and that this had also been the case in the thirteenth century.
Extant eighteenth-century estate plans showing fields in relation to the Central Buchan Uplands and to churches (crosses) and assembly sites (circles). Chapels included in this figure as smaller crosses. Area shown indicated on Figure 9.
Sources: Taken from estate plans of Gairnieston, MS3175/RHP/31467, 1768–9 and Craigston RHP 89375, 1780–2, courtesy of the owners of the Urquhart papers of Craigston.

Showing the disposition of arable areas as depicted on William Roy’s Military Map of the 1740s in relation to the ‘Central Buchan Uplands’.

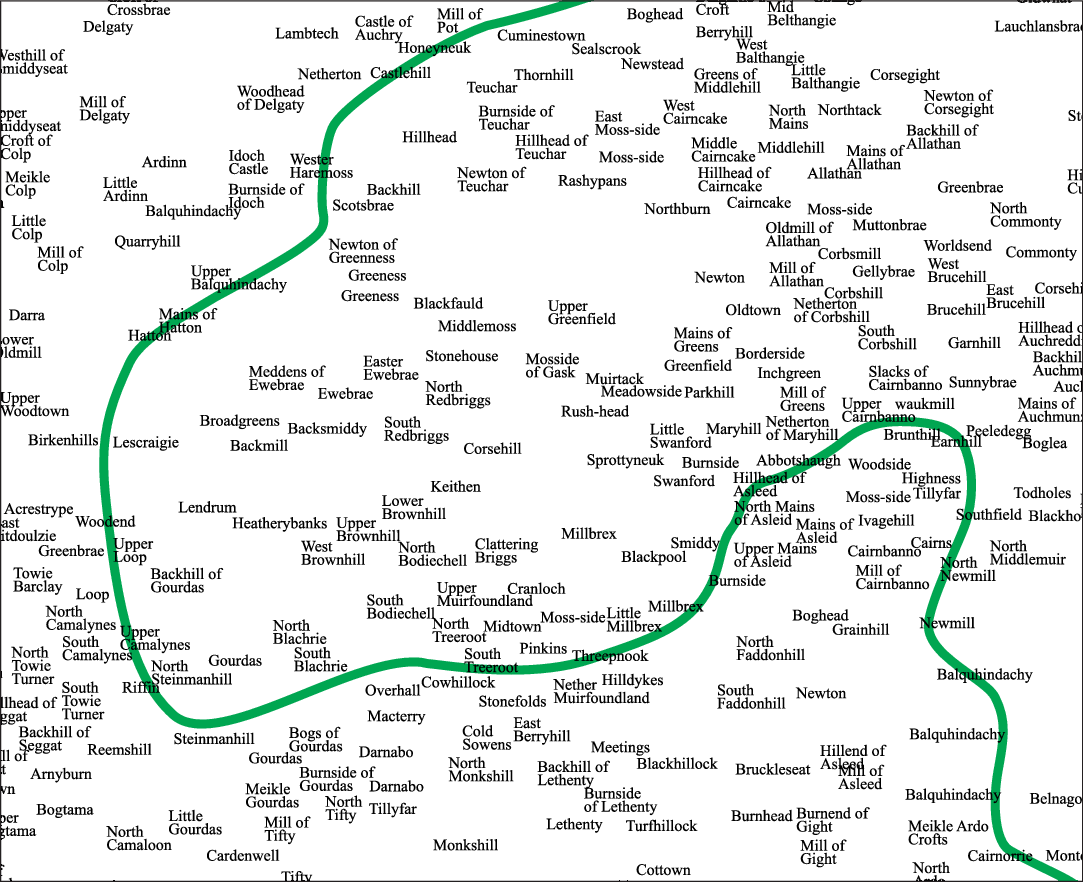
A consideration of some of the place-name elements within the upland zone (Figure 12) is indicative of late and recent settlement, often associated with the early modern enclosure of those uplands. An emphasis on the former importance of a pastoral regime is also apparent, though it should be noted that this area is now highly productive barley-growing land. Clearly, settlement was not dense in this upland zone even by the mid-eighteenth century, though parts may have been more widely ploughed at an earlier time, contrary to what might have been anticipated from the nineteenth-century map evidence of the Ordnance Survey. The absence of a substantial strata of Gaelic/Pictish names also suggests that this area did not see widespread settlement before the high middle ages. A scattering of such names up the tributaries of ‘Glen Geight’ may, however, suggest sporadic settlement on the better south-facing slopes.Footnote 9 Referring back to Figure 3, these lands saw a lower than usual livestock render for an upland area and Figure 9 shows them to have contained less boggy ground in the early nineteenth-century than did most of this upland zone.
Showing mid-ninteenth-century fermtoun and croft names in a western upland salient. Far fewer within the green line have Gaelic or Pictish roots and have a tendency to be later Scots terms relating to topographic features or related to pastoral activities. Note particularly those containing a ‘green’ suffix or prefix.Source: Compiled from the 1st edition OS at www.maps.nls.uk/os.

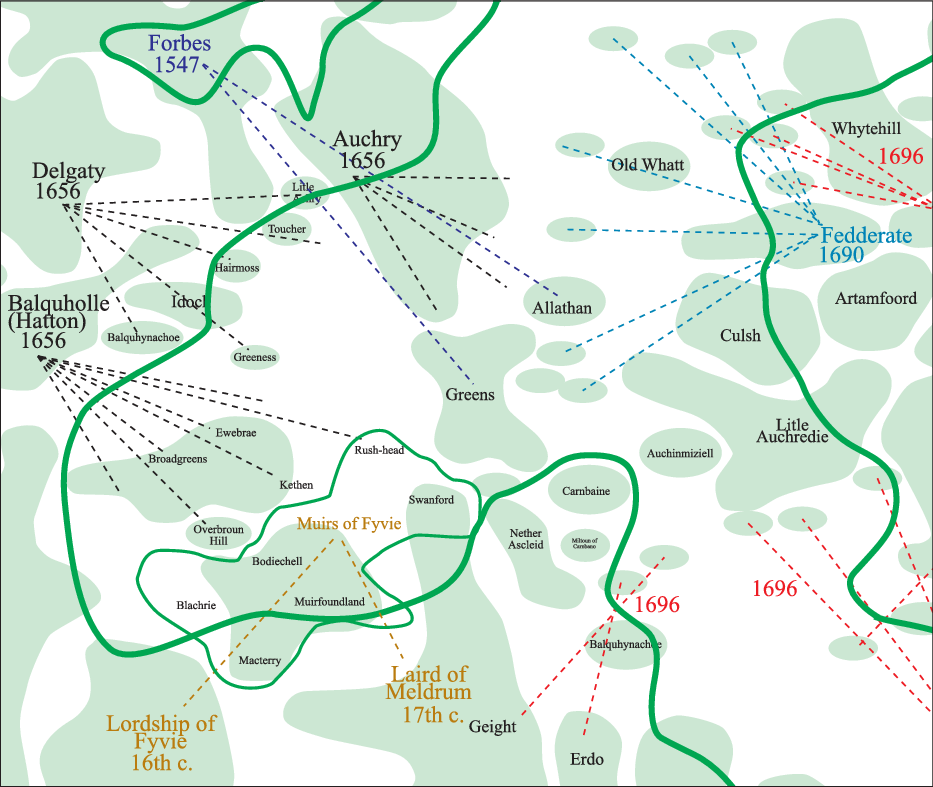
Little Allathan enters the record in 1423, suggesting that it may already have become a subdivided toun by this time (Ill. A&B: iv, 382) though the ‘Greens of Allathan’ appear not to be recorded prior to 1632 (ASCB, II, 471).Footnote 10 There are difficulties associated with the lands of Allathan as they appear to have been split between the parishes of Deer and Turriff while also partly sitting within the Barony of Kingedward. In other words, the holding appears to have predated the imposition of these later boundaries.Footnote 11 One reference from 1610 may also be instructive in its wording. It notes that Badentier, Tillymaud and Allathan were viewed simply as pendicles of the lands and barony of Fintray (RMS: vii, 239). The later sixteenth and seventeenth centuries, therefore, appear to have witnessed a period of development in this small area that saw former pendicles becoming engrossed and turned into larger holdings. By 1632 the ‘Grein of Allathan’ had become a separate tenantry held by David Gordoune (ASCB, II, 471) (Figure 13).
Landholdings taken from 1696 Poll Tax, charter and rental evidence. (Note the proximity of the holdings of the ‘Muirs of Fyvie’ to Delgaty’s lands to the north. Possibly the area of contention reflected in the court case of 1492 discussed in the text.).

Returning to the names within the upland zone shown on Figure 12, as well as being largely of later Scots derivation, they are frequently topographically descriptive or related to pastoral activities. Names including a ‘green’ element (usually associated with grazing lands in the North East) are fairly common alongside other references to mosses, rushes and other descriptors of wetland. Clearly, this was a land fit for pasture rather than the plough and the occasional references to cattle or sheep underscore that point.
Further north, the lands of Fedderate are of interest. As noted above, these were granted to John son of Uhtred by Fergus Earl of Buchan in exchange for lands in Cruden and Slains in 1203–11 (Coll. A&B: 407–09; Ill. A&B: iii, 5). The core of the new estate (running to three davachs) lay in the lower lands of Atherb, Aucheoch and Auhethas but clearly extended across the upland zone. In the 1690 rental (Ill. A&B: ii, 442–4) the lands included the tounships of Bonnykelly, Corsegight with the Mills of Corsegight and Corbshill, among other holdings. These appear to have lain within the bounds described in the charter, though many other names noted there have been subsequently lost. It is clear that the River Gight formed a western boundary along with the Allathan lands of one Ruthri Mac Oan (but, see above). In other words, John son of Uhtred exchanged extensive lowlands for an extensive amount of hill country. Clearly, modern perceptions of relative land values based upon arable production appear not to have influenced his decision.
Fedderate appears to have comprised that part of the parish of Deer lying to the west of the abbey lands. This was the portion held by John son of Uhtred at the beginning of the thirteenth century and still formed the main holdings of the estate at the time of the 1696 Poll Tax although, by then, having been sold on. As well as lands outwith the immediate area, Deer Abbey appears to have been granted the teinds of the parishes of Deer and Peter Ugie – at least by 1406 (Ill. A&B: ii, 419) – as well as holding lands around the Abbey itself. As John son of Uhtred’s grant had already been made prior to the foundation of the Abbey, this may suggest that those lands, along with the rest of Deer and Peter Ugie had formed a large, pre-parish, estate of the earldom of Buchan and that the parish bounds were simply made to coincide with that earlier estate.
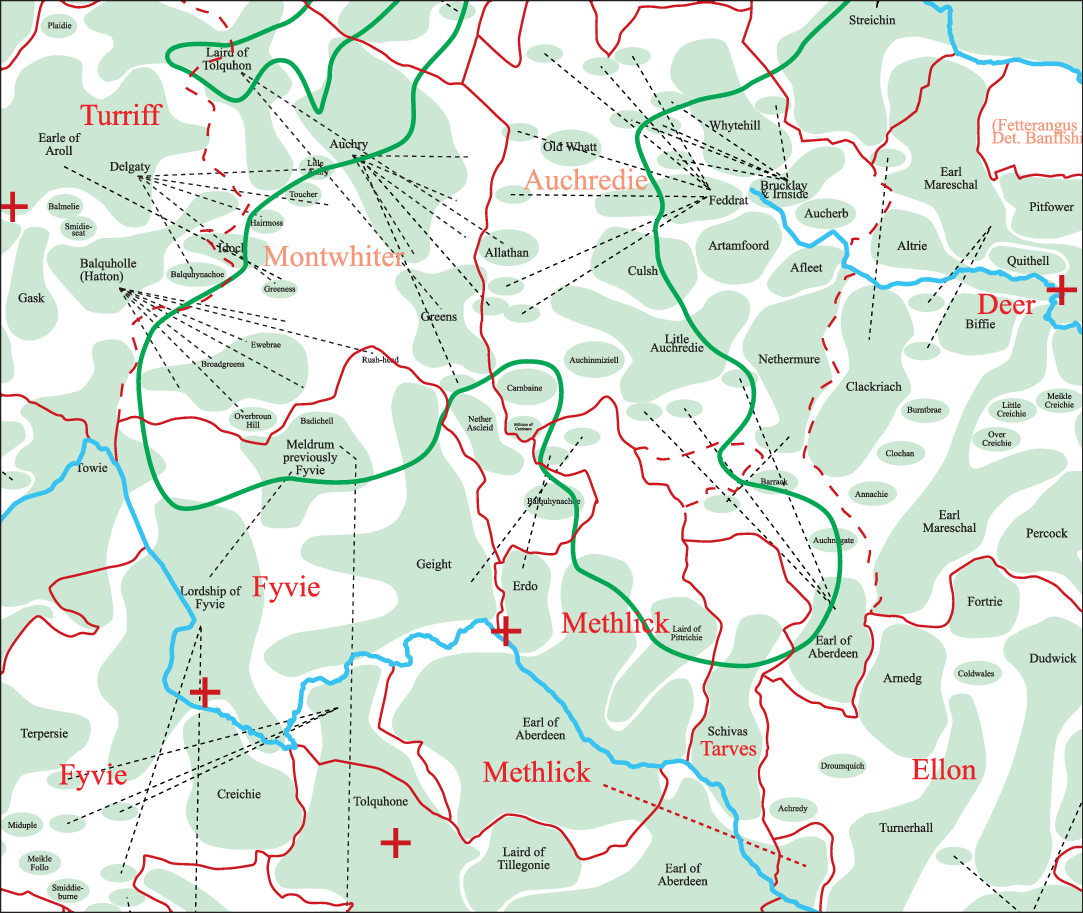
The persistence of these bounds of Fedderate appear reminiscent of other similarly conservative approaches to boundaries in the area. A consideration of the extent of major landholdings as revealed by the 1696 Poll Tax returns suggests that many such groupings may not have changed since the drawing of the parish marches in the twelfth and thirteenth centuries (Oram, Reference Oram2016: 5). This is not to say that the families holding the lands had not changed, simply that the boundaries may have been fossilised at that early date. Figure 14 shows the major holdings of the southern portion of the Central Uplands in 1696. Dashed lines show isolated landholdings separated from estate cores. The lands of Fedderate can clearly be seen linking lowlands to upland holdings. In the case of Fedderate the holdings were largely contiguous across that boundary. But, in other cases, the estate centre was more isolated from the upland parts, presumably as the intervening lands were parcelled out as later, individual holdings. It is noteworthy that most of the estate cores fit very neatly within the parish boundaries and rarely cross those lines. However, some of the isolated parts appear to lie within different parishes to the core lands. It is also quite striking that, whereas in the large, central Buchan parishes the estates fit neatly within the boundaries, in the Ugie and Urie areas, this neatness is less marked. Presumably, these areas saw a number of engrossments of certain estates at the expense of others during the intervening period. It might be suggested that parishes were simply laid out in accordance with earlier secular land grants. Stringer has noted the possibility of that explanation for the Garioch (1985: 58–68). Such a situation may also account for a certain parity of value between parishes when ecclesiastical sites are considered with respect to the 1275 taxation figures (see Table 4).
More generalised view of Figure 13 showing the ‘neatness of fit’ of landholdings to parish boundaries in 1696. Montwhitter and Auchredie were later parishes carved from Turriff and Deer. Parish church sites shown as red crosses.

It may be useful to consider Figure 14 in greater depth. The pattern of landholding during the seventeenth century consisted of a number of large groupings on the southern side of the upland zone that emerged as subdivisions of the large Barony of Tarves with the lands of Fyvie – formerly itself derived from the unknown extent of the large royal Thanage of Fermartine. Although much fragmented by 1696, the core estate lands still lay fairly neatly contained within the parish boundaries of Fyvie, Tarves and Methlick. It seems possible that the parish of Methlick may have been carved out of the parishes of Fyvie and Tarves as indicated by the North East salient of Tarves wrapping around it and as suggested by the teinds pertaining to the Barony of Tarves (Arb. Lib., II: 457). These included the lands of Meikle and Little Gight – the former giving the name to the parish while the latter ended up in Fyvie parish along with Mayns of Gight and the Miln of Gight that comprised the ‘Lands of Gight’. Glen Gight and Schivas were subinfeudated to form the barony of Scheves by Alexander II in 1233 (RRS: iii, 188). The net result was to split the ‘Geight’ name between three parishes – Fyvie, Methlick and Turriff – and to divorce the core lands of Scheves in Tarves parish from its uplands in Turriff parish.Footnote 12 Oram’s suggestion (Reference Oram2016: 5) of the piecemeal division of parishes in the twelfth and thirteenth centuries may find an echo in these apparent subdivisions.
To the north-east lay the large parish of Deer and to the north-west, the equally impressive parish of Turriff. Much of the upland zone in 1696 consisted of a large number of smallholdings, many of them linked to larger lowland centres, as well as a large amount of land not accounted for in documentary records. Presumably, this was still common upland grazing pertaining to the surrounding holdings. The Fedderate lands have already been noted and, adjoining them to the east, were the lands of Brucklay with its upland holdings. Brucklay was one of the many smaller holdings derived from the break-up of the lands of the Abbey of Deer. To the south can be seen two small portions of upland retained by the lairds of Gight and Erdo. The Muirs of Fyvie were held by the Gordons until 1635 (MS 2778/1/3/7) when they were taken over by Meldrum. However, as the Meldrums had previously been associated with Fyvie from the early 1400s (Temple, Reference Temple1894: 22), this may be seen as merely a return to the traditional holders of the Muirs. Clearly, this is a very complicated piece of land with respect to ownership. But, for the purposes of this article, the continuing importance of these ‘muirs’ across the centuries and throughout the 1600s is noteworthy. A series of inventories spanning the 1600s and early 1700s attests this ongoing wrangle (MS 2778/6/1). To the north the Forbeses had extended their Blacktoun estate. The uplands of Allathan and the Greens of Allathan came into their possession at the same time as they acquired the lands of Fintray, as noted above. The name ‘Greens’ is probably descriptive of earlier land use. By 1696 Greens had become amalgamated into a larger tenantry comprising other former Forbes holdings. Auchry retained its adjacent uplands. To the west of the Muirs of Fyvie lay the upland holdings of Hatton and, between them and the Auchry holdings lay the uplands pertaining to Delgaty.
This final holding may well have been the site of a complaint that reached the courts in 1492. The case provides an interesting glimpse of the stocking of an upland holding. The exact dispute is not discussed but Gilbert Hay claimed restitution for the loss of grazing and the products thereof. Presumably, the four defendants – two of whom were Gordons – had reneged on agreed terms and refused to quit the land. This, therefore, led to the claim by Hay for the loss of revenue. Sadly, the place in question is not noted but it may be no coincidence that the Gordons and Hays were neighbours across the watershed that provided the parish boundary between Fyvie and Turriff. The list of goods requiring reparation clearly only suit an upland setting. No claim for loss of grain is noted, which was fairly unusual in these types of action. The court found in favour of Gilbert Hay and his claim was made for 180 sheep, 80 ewes and 80 lambs per year and the products lost from those animals over a three-year period. The costs give an account of the values of the lambs: at one year: 12d; at two years: 3s; and hoggs: 18d. Wool was rated at 8s per stone and the 48 stones of potential cheese rated at 2s per stone. The weight of wool lost from the 180 sheep was said to have been 45 stones over the three-year period. Presumably, this was considered to have been a realistic sum. At 15 stone per year and using a conversion of 17.5 lbs per Scots stone (www.scan.org.uk/measures/weight.asp), these sheep were producing 262.5 lbs of wool per year. This amounts to about 1.5 lbs per sheep and falls into the high yielding category of manors on the Bishop of Winchester’s estates in the mid-fifteenth century (Stephenson, Reference Stephenson1988: 372). The average weight between 1209 and 1454 on the estate was 1.35 lbs per fleece (370). The figures also suggest that each fleece of the 180 sheep was worth 8d Scots. This is likely to have been worth approximately 2d sterling. As wool from the Winchester estates around the mid-fifteenth century could be as low as 1.4d per fleece the 2d rate does not seem too bad.
On top of the claims for the lost values of sheep, lambs and wool, the court found in favour of an additional £8 costs for 48 stones of cheese made from ewe’s milk across the three-year period. The only other claim by Gilbert Hay was for the value of five-year-old calves and for the 15 stones of cheese that would have been made from their milk. As noted, it is instructive that no grain or crops were claimed and suggests that the farming unit involved was purely pastoral in nature. Presumably, hay would have been harvested but could not be claimed as it would have been used solely for the purposes of feeding the stock, which was the main basis of the restitution. The chance survival of this action appears to demonstrate a mainly sheep-driven enterprise from the 1490s, seemingly within the upland area under discussion.
With respect to the landholdings as they are evidenced from the seventeenth century, they can be characterised as consisting of four main types of landholdings. Either: small, isolated parts of much larger lowland estates; upland salients of those larger estates; smaller upland estates of much more recent vintage; land still utilised in common by some or all of those other stakeholders. In other words, what might be anticipated to be the case as former pasturelands were engrossed.
The thirteenth-century ‘Central Uplands of Buchan’ – fact or fiction?
It is not difficult to account for the high value of arable land in the Urie catchment during the thirteenth century. The Urie could be used to raft foodstuffs to the growing town of Aberdeen in a way that none of the more northern catchments could have done. Considering the density of assembly and ecclesiastical sites, it is clear that the Urie was also more densely populated than, especially, the Deveron East and Upper Ythan catchments – perhaps by a factor of more than two to one. By 1696 the population density of Deveron East was 10.5 per sq km compared with 14.5 for the Lower Urie. By 1696 the Lower Urie yielded £94.5 per sq m while Deveron East only managed £58.5. However, in terms of value per person per sq km, this translates into a closer margin of £5 per head for Deveron East and £6.5 for the Lower Urie. The per capita profit per sq km equates to 8.5 per cent for Deveron East against only 6.9 per cent for the Lower Urie (see Figure 8).Footnote 13 If 1696 population figures were extrapolated for 1275, the difference would have been still greater during that earlier period. Clearly, intensive crop husbandry was likely to return a greater yield per acre than an extensive pastoral economy. But, when population figures are attempted (which, admittedly, are largely a matter of informed guesswork, as noted above, for example Campbell, Reference Campbell2008: 925–32), the results appear to be quite compelling in describing a different result.
Direct evidence for sheep farming in Buchan in the thirteenth century is rare. Campbell’s work (Reference Campbell2008) has shown evidence for it through the back-door approach of looking at exports from the region. He has demonstrated that the wool trade made the North East one of the richest parts of Britain during the twelfth century with a dynamically developing economy (ibid.: 933). McNeill and MacQueen (Reference McNeill and MacQueen1996: 243) show graphically that between 1327 and 1333 Aberdeen accounted for 25 per cent of all Scottish exports – mainly wool – and second only to Berwick. At this time exports from Aberdeen and Banff comprised entirely wool, woolfells and hides (ibid.: 244). With Scotland exporting 5,750 sacks per year between 1328 and 1333, Aberdeen’s share must have been in excess of 1,400 per year. And, during the 1360s, Scotland was exporting 8,200 sacks per year (Rorke, Reference Rorke2006: 270). This pre-eminence appears to have declined after this time, though cloth manufacturing did partly fill the void (McNeill and MacQueen, Reference McNeill and MacQueen1996: 251–2). Ditchburn notes that Aberdeen’s place as the second port of Scotland had been regained by the mid-fifteenth century (1990: 16) and that c. 1500 it still handled 20 per cent of Scotland’s wool trade (17).
Documentary evidence from the production end of wool products is negligible and usually only occurs through indirect means. Shepherds’ huts and sheep cotes would never have been known to exist on the Correen Hills were it not for a throwaway reference to them in a boundary dispute between Lord Forbes and the Bishop of Aberdeen in 1391 that rattled on into the next century (REA: i, 249). This noted that Sir John Broun had formerly kept these accommodations on the diocesan lands there. If this is the same John Broun who held the Thanage of Fermartine in the early fourteenth century (RMS: i, 538), his role in the local wool trade looks potentially formidable and may have helped support his family’s burgeoning prestige in the area. The 1257 tithe record for Fyvie (REA: i, 18–26) records that, unusually, a percentage of the lesser teinds derived from wool and lambs was to be reserved to the coffers of Arbroath Abbey. This suggests that wool formed an important product on those Fyvie lands associated with the Thanage of Fermartine. A similar situation pertained to the small teinds of Tarves. These exceptions (along with Kennethmont) suggest these lands to have been particularly prominent with regard to the farming of sheep. A further exception was noted in regard to Deer Abbey where two of Robert III’s charters were confirmed in 1526 and granted the Abbey the great custom of the whole wool of the sheep of the monastery, so long as it did not exceed twenty sacks, as well as the teinds of the parish church of Deer (Ill. A&B: ii, 419; Ill. A&B: iv, 551).
Neither can sheep nor other livestock be excluded from the equation relating to arable farming in the Middle Ages. As Shiel has calculated (Reference Shiel1991: 71–2), only a maximum of 20 per cent of land could be kept under arable crops in a pre-fertiliser economy in order to sustain good yields. It is probably not coincidental that Sir John Broun had flocks on the Correen Hills overlooking the rich arable lands of the Don and Urie. Also, that Kennethmont was well endowed with sheep that could have been summered on Gartly Moor while providing rich nutrients for the lands below. This double economy of sheep and arable, along with easy transport links to Aberdeen, is presumably what made the Garioch such a rich economic region. What is questionable, however, is whether the undoubtedly large numbers of sheep that fuelled the Aberdeen export trade in the thirteenth and fourteenth centuries were all accommodated as part of an intensive arable regime or whether two separate agricultural economies coexisted in the North East. One would have been mixed, as in Norfolk – and as is proposed here for the Urie catchment – while the other may have been predominantly pastoral – such as existed on the southern downlands of Britain – and is suggested here for parts of the Central Uplands of Buchan. That it has left scant traces in the landscape record should not occasion much surprise owing to subsequent developments across the region. That other areas of pasture within the forests surrounding the North East were also available for grazing similarly appear infrequently in the documentary records. One such rarity is that alluding to the full panoply of cattle, bull, sheep and horses grazed within the Forest of Boyne, abutting Banff (RMS: i, App. 1, No. 65).
Previous work has suggested the vestigial traces of two- and three-course field systems in the area (Shepherd, 2007: Reference Shepherd2018). Evidence from the grain-drying kiln in Kearn has added to the environmental picture. Here, in the later twelfth century, the charred remains from the kiln indicate a ‘manorial’-type of organisation with managed woodland and evidence for the expansion of arable onto more marginal uplands (Shepherd, Reference Shepherd2018: 21–8). This evidence appears to support the picture suggested by the teind record of a ramping-up of arable productivity at this time. The image of an ‘infield/outfield’ agronomy apparently blanketing the area in the final post-medieval period should not, therefore, be taken as indicative of earlier times. A range of strategies appears to be suggested by the available evidence. It is more likely that the final, pre-modernised homogeneous picture was largely the result of the harsh realities of later (largely seventeenth-century) socio-political and economic turmoil rather than the result of unrestricted developmental processes. Infield/outfield strategies are wonderfully flexible in respect of being able to quickly adapt to changing social pressures (Shepherd, Reference Shepherd2007: 69, 73). The collapse of the Scottish wool trade may have had an adverse effect on arable agriculture as well as pastoral regimes. The removal of so much fertiliser from the farms will have limited the arable potential and resulted in a ‘Postan-like’ crisis in reverse: unlimited pasture but an inability to stock it to the required degree. Ultimately, a new use for this pastureland would be found in the production of beef cattle during the seventeenth century (Koufopoulos, Reference Koufopoulos2004).
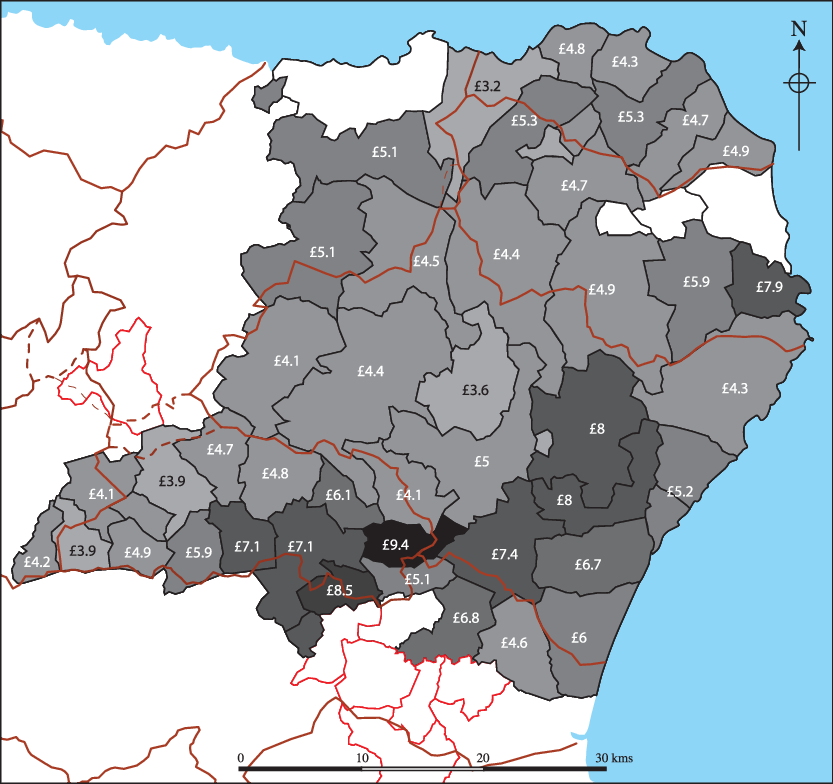
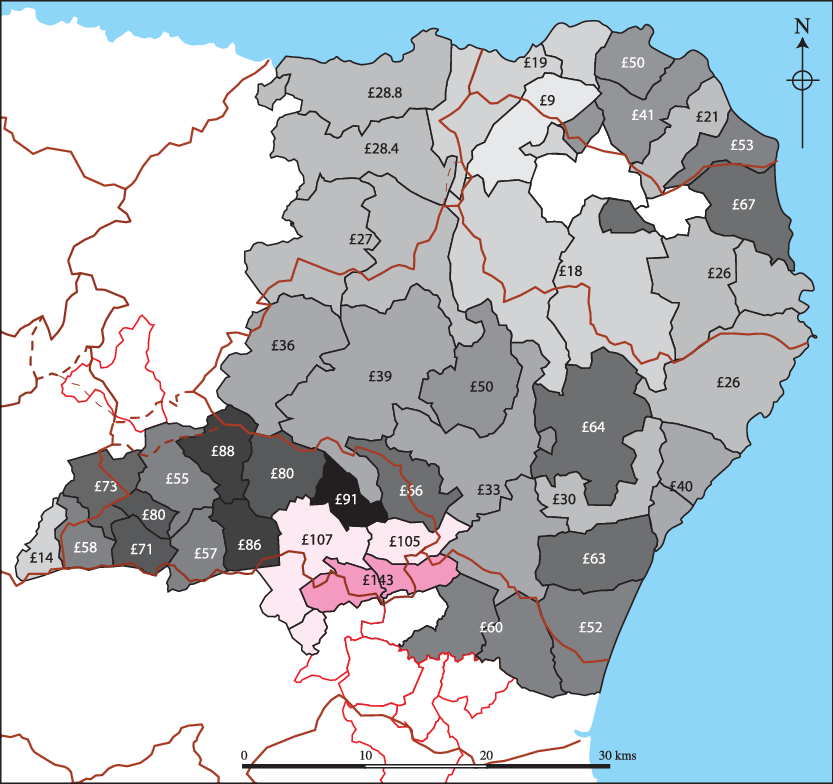
The land taxes of the seventeenth century may demonstrate the development of the other north-east river catchment zones to the detriment of the Urie. The Lower South Ugie and Middle Ythan overtook the Urie in overall value by the second half of the seventeenth century. Figure 15 shows the value per person per parish in 1696.Footnote 14 It can be seen that, by that time, there was no longer such a great divide between the upland or lowland areas in terms of land value per head of population. Figure 16 shows the value of parishes per sq km c. 1275. Note the extraordinary high values in the Lower Urie area.
Value per person per parish in 1696.
Sources: Data taken from the 1674 Land Tax Rolls and the 1696 Poll Tax return.

Value per sq km of parishes c. 1275.
Sources: Data taken from ecclesiastical taxation records contained within REA, I, II; Liber St Andr.; Liber Aberb, I.

Reference to Figure 3 suggests how the economic disparity within the Ythan and Urie catchments may relate to the disposition of soils. Udny and the eastern part of Tarves fall within the ‘brown earths’ region of soils while Fyvie and Methlick are predominantly topped by podsols. It may be that the exploitation of former permanent pastures may have increased the arable values/yields of those lands in much the same way that a similar appropriation during the late eighteenth and nineteenth centuries led to the over-emphasised claims of the ‘improvers’ (Allen Reference Allen and Overton1991: 242–50; Shepherd, Reference Shepherd2011: 27). The brown earths of the Urie had long since passed that nitrogen boom.
By the middle of the seventeenth century, the upland parishes of Buchan were as highly valued as many of the former rich grain lands of the Urie catchment. However, as Figure 17 shows, with respect to per capita profit, they exceeded them. Extrapolation from the 1696 population figures suggests that this situation may also have pertained to the thirteenth century, with only the Lower South Ugie demonstrating a real rise in profitability.
Per capita profitability expressed as percentages of land values. Black (or white) figures show 1674 valuations; red figures (grey) show percentages based upon c. 1275 values with 1696 population levels.
Source: 1674 figures taken from the Land Tax Rolls for Aberdeenshire.

Of course, by the later seventeenth century, the valuable cattle trade was in full swing and north-east stock increasingly valued highly (Koufopoulos, Reference Koufopoulos2004: 88). This was clearly not a new thing. Arbroath Abbey is recorded as having had a vaccary at Gamrie in 1527 (Arb. Lib., 462). Whether these were specialised units for the production of particular items, such as is suggested for a ninth-century vellum-producing vaccary at Lindisfarne (Rob Young, pers. comm.) is unknown. The seventeenth-century wealth of the uplands, with its sparser population, is unlikely to have been related solely to arable agriculture. The subsequent re-use of the land as arable can be seen to have been a product of the early nineteenth-century industrialisation of the landscape. As Koufopoulos notes (Reference Koufopoulos2004: 97), the increase in cattle profitability at the end of the eighteenth century led to increased numbers of cattle, increased levels of dung and a subsequent increase in the potential to grow grain. Reference to Roy’s map (see Figure 11) shows the distribution of arable lands across the North East during the first half of the eighteenth century. Even then, the uplands were still largely untilled. However, the coastlands of the Ugie and the lowlands east of the Deveron appear well covered. If, during this period, the more northerly coastal catchments were maintaining their relative rental values per head of population but increasing their arable production, it might be argued that their pastoral productivity was becoming less important. Population levels were certainly high in the northern coastal zones in the later seventeenth century (Table 5) and suggests a possible reliance on arable production by then.
Sadly, there are no population figures for the thirteenth century. It has been assumed that no great population increases occurred between the late thirteenth century and the end of the seventeenth, taking into account the Black Death (Campbell, Reference Campbell2008: 925–36) and the North East’s ‘ill years’ of the 1690s.Footnote 15 We need to look for a non-arable means whereby the Deveron East, Upper Ythan and Upper Ugie parishes were more productive per capita than the Urie and other lower-lying grain-lands during the thirteenth and seventeenth centuries. It is difficult to avoid the conclusion that sheep provided much of that profit and that, subsequently, their role was partly replaced by cattle. The large numbers of weavers, tailors and shoemakers apparent in the upland parishes in the 1696 Poll Tax record further attest to this ongoing mixed, pastoral economy that may be glimpsed in the thirteenth century records.
Conclusion
Drawing together the strands of evidence that have been considered here, some tentative suggestions concerning the development of agricultural practice across the North East may be made. An assessment of the greater and lesser teinds in the first half of the thirteenth century suggests that the Lower Urie may well have been an area in which intensive arable cropping was undertaken. Such a regime may well have been spreading to the Upper Urie as well, although this zone may have been lagging behind. The high proportion of lesser teinds paid in the Upper Urie mark this out as formerly having been an area of greater pastoral production. The retention of a portion of the sheep products from Kennethmont by Arbroath Abbey suggests that sheep still played an important role in that parish into later times. However, a sophisticated grain-drying kiln found at Druminnor Castle in Kearn and dated to the second half of the twelfth century may indicate that arable intensification may have begun around ‘manorial’-type settlements earlier on some estates than others. The Urie catchment may well have had the densest population and this may be thought to relate to the more intensive arable regime pursued there.
Away from the Urie, the other catchments appear to have pursued a more mixed agricultural regime during the thirteenth century, though land productivity along the Ythan appears to have been higher than in the Deveron East or Ugie zones. However, as population figures demonstrate from the late seventeenth century, higher production values per sq km did not inevitably relate to greater levels of profit per capita. And if the risk factor of bad harvests is brought into consideration, a pastoral regime may have been considered a safer option. The profits may not have been so high but were more reliable. This is likely also to have been the case in the thirteenth century.Footnote 16
Between the fourteenth and seventeenth centuries these uplands can be seen, from the charter evidence, to have been slowly changing, though isolated bits of upland parish remained separate from their core areas. Upland pendicles of lower-lying estates were slowly being gathered into separate farms that were then engrossed to form new tenantries. Estate cores became divorced from their upland resources in many cases and commonty land became enclosed. In the thirteenth century John son of Uhtred had relinquished potentially-rich coastal arable lands to take over the upland estate of Fedderate. By the seventeenth century many upland portions of such estates were being sold off. Data gathered from the Poll Tax records, estate plans and Roy’s Military Map underscores the point that the modern, rich arable environment of much of the Central Uplands of Buchan is the result of later eighteenth- and nineteenth-century landscape management re-organisation. Prior to this the area was predominantly pastoral – though not exclusively so – but certainly not impoverished.
Finally, therefore, this discussion opens the door to a wider consideration of how the more pastoral and the more arable zones interacted economically. If the hard division frequently drawn between ‘uplands’ and ‘lowlands’ can be seen to be a chimera, social and economic boundaries must also be considered to have been porous. Transhumance is well attested for highland zones and, even into modern times, livestock from the highlands and islands were over-wintered in the North East lowlands. It is unlikely that this was a modern answer to problems of shortage of winter fodder in some districts. Whether such a practice worked in the thirteenth century is a question that deserves further consideration. It might be suggested that the model noted for Dartmoor by Fox (Reference Fox2012) may be instructive in this instance in which the surrounding lower-lying landholders of Devon had grazing rights over the large upland zone of Dartmoor. The 269 sq km of the Central Uplands of Buchan may have provided a similar resource. Or perhaps, a version of the ‘multiple estates’ model might be considered in which larger economic units comprised a broad range of topographies and resources in order to be self-sufficient.Footnote 17 The situation of Fedderate may fit this pattern. Or, on an altogether grander scale, and as suggested above, the thirteenth-century parishes of Deer and Peter Ugie may have originated as a single estate within the gift of the Earls of Buchan. But, such suggestions are clearly beyond the reach of this work.
It is hoped that this article has gone some way towards finally laying to rest the notion of a ubiquitous upland/lowland dichotomy across Scotland. The Central Uplands of Buchan were ‘marginal’ and fairly inaccessible to centres of political power. But, as with so many topographically similar parts of Britain, they were fully engaged with the surrounding lower lands. Were they, therefore, ‘uplands’ or ‘lowlands’? It is also hoped that this article has gone some way to mitigating a perception of a similar dichotomy between ‘rich arable’ and ‘poor pastoral’ historical ecologies. The two ends of such an agricultural spectrum may well have existed across Buchan, but they were inextricably interwoven and largely reliant upon each other. This balance, moreover, was flexible and dynamic through time.
Acknowledgements
I would like to note a huge debt of thanks to Alex Forbes for suggesting so many avenues of documentary detail to pursue and for imparting vast tranches of his personal knowledge regarding the landholdings of many of the historically important families of the North East. Also for hours of useful, fascinating, informative and, at times, highly confusing (for me!) conversations. The anonymous referee kindly pointed out further avenues of research, especially the Acts of the Lords of Council that has been of immense help for this and other work – many thanks. I would also like to thank the owners of the Urquhart of Craigston papers for permission to use the estate plans of Craigston Estate.
Appendix The table shows the raw data used to produce the text tables and figures.

|