

1 Introduction
Townsend (Reference Townsend1976) deduced that the energy-containing motions in the logarithmic region of wall-bounded turbulent flows can be understood as a linear superposition of self-similar eddies that are attached to the wall. The size of each eddy is proportional to the distance from the wall ( $y$). Townsend’s attached-eddy hypothesis predicts the turbulence statistics of the logarithmic region in terms of such structures, i.e. the logarithmic variation in the wall-parallel components of the Reynolds stresses. A typical feature of turbulent boundary layers (TBLs) subjected to adverse pressure gradients (APGs) is the enhancement in the large-scale energy above the logarithmic region. A strong outer peak is observed in the streamwise Reynolds stress, which results from long-wavelength motions in the energy spectra (Harun et al. Reference Harun, Monty, Mathis and Marusic2013; Kitsios et al. Reference Kitsios, Sekimoto, Atkinson, Sillero, Borrell, Gungor, Jiménez and Soria2017; Lee Reference Lee2017; Yoon, Hwang & Sung Reference Yoon, Hwang and Sung2018). The large-scale motions (LSMs) with sizes of
 $O(\unicode[STIX]{x1D6FF})$ in the logarithmic region, where
 $\unicode[STIX]{x1D6FF}$ is the 99 % boundary layer thickness, influence the small-scale motions through amplitude modulation (Hutchins & Marusic Reference Hutchins and Marusic2007b; Bernardini & Pirozzoli Reference Bernardini and Pirozzoli2011; Agostini & Leschziner Reference Agostini and Leschziner2014; Hwang et al. Reference Hwang, Lee, Sung and Zaki2016b) and their footprints extend into the near-wall region (Hoyas & Jiménez Reference Hoyas and Jiménez2006; Hutchins & Marusic Reference Hutchins and Marusic2007a). Recently, Hwang & Sung (Reference Hwang and Sung2018) reported that the wall-attached structures of the streamwise velocity fluctuations (
 $u$) are self-similar and contribute to the presence of the logarithmic layer in a TBL of zero pressure gradient (ZPG). Therefore, research is required into the application of Townsend’s attached-eddy hypothesis to APG TBLs, particularly through analysis of the wall-attached
 $u$ structures in order to predict the influence on the turbulence statistics of strengthened LSMs. Although many studies of the turbulence statistics of APG TBLs have been performed, sufficient attention has not been paid to wall-attached structures despite their importance.
The concept of attached eddies originates in the research of Townsend (Reference Townsend1976), who proposed a double-cone vortex model for the energy-containing motions with sizes that are proportional to  $y$, i.e. those that are attached to the wall. The wall-attached structures are self-similar and are superimposed by eddies of various sizes with a constant characteristic velocity. In the logarithmic region, the Reynolds normal stresses can be characterized in the terms of Townsend’s attached-eddy hypothesis as follows:
 $$\begin{eqnarray}\displaystyle & \displaystyle \langle uu\rangle /u_{\unicode[STIX]{x1D70F}}^{2}=B_{1}-A_{1}\ln (y/\unicode[STIX]{x1D6FF}), & \displaystyle\end{eqnarray}$$
 $$\begin{eqnarray}\displaystyle & \displaystyle \langle ww\rangle /u_{\unicode[STIX]{x1D70F}}^{2}=B_{2}-A_{2}\ln (y/\unicode[STIX]{x1D6FF}), & \displaystyle\end{eqnarray}$$
 $$\begin{eqnarray}\displaystyle & \displaystyle \langle vv\rangle /u_{\unicode[STIX]{x1D70F}}^{2}=B_{3}, & \displaystyle\end{eqnarray}$$
 $\langle uu\rangle$,
 $\langle vv\rangle$ and
 $\langle ww\rangle$ are the streamwise, wall-normal and spanwise components of the Reynolds stresses, respectively;
 $u_{\unicode[STIX]{x1D70F}}$ is the friction velocity;
 $A_{1}$,
 $A_{2}$,
 $B_{1}$,
 $B_{2}$ and
 $B_{3}$ are constants; and
 $\langle \cdot \rangle$ denotes time- and ensemble-averaged quantities. Perry & Abell (Reference Perry and Abell1977) suggested the presence of a
 $k_{x}^{-1}$ region (
 $k_{x}$ is the streamwise wavenumber) in the energy spectra of
 $u$ where both the inner scaling (i.e.
 $y$) and outer scaling are simultaneously valid. Given that the
 $k_{x}^{-1}$ region leads to the logarithmic variation of the streamwise Reynolds stress, this scaling behaviour is a spectral signature of attached eddies. After that, Perry & Chong (Reference Perry and Chong1982) extended Townsend’s attached-eddy hypothesis by proposing a model in which a hierarchy of geometrically similar eddies are randomly distributed with a population density that is inversely proportional to their height, leading to logarithmic variations in
 $\langle uu\rangle ^{+}$ and
 $\langle ww\rangle ^{+}$, where the superscript + denotes non-dimensionalization by the wall variables. In addition, Perry & Chong (Reference Perry and Chong1982) reported that a superposition of attached eddies results in the
 $k_{x}^{-1}$ region, which produces the logarithmic variation in
 $\langle uu\rangle ^{+}$. Accordingly, attached-eddy models can explain the asymptotic behaviours in the turbulence statistics of high-Reynolds-number turbulent flows in terms of their coherent structures.
In the last two decades, several studies of high-Reynolds-number wall-bounded turbulent flows ( $Re_{\unicode[STIX]{x1D70F}}>O(10^{4})$) have been performed owing to improvements in experimental equipment and computational power;
 $Re_{\unicode[STIX]{x1D70F}}$ is the friction Reynolds number (
 $=u_{\unicode[STIX]{x1D70F}}\unicode[STIX]{x1D6FF}/\unicode[STIX]{x1D708}$, where
 $\unicode[STIX]{x1D708}$ is the kinematic viscosity). The influence of wall-attached structures is enhanced as the Reynolds number increases. For instance, logarithmic behaviour in
 $\langle uu\rangle ^{+}$ has been observed in ZPG TBLs with
 $Re_{\unicode[STIX]{x1D70F}}=O(10^{4})$ (Hutchins et al. Reference Hutchins, Nickels, Marusic and Chong2009; Vallikivi, Hultmark & Smits Reference Vallikivi, Hultmark and Smits2015; Baidya et al. Reference Baidya, Philip, Hutchins, Monty and Marusic2017; Samie et al. Reference Samie, Marusic, Hutchins, Fu, Fan, Hultmark and Smits2018), an atmospheric surface layer with
 $Re_{\unicode[STIX]{x1D70F}}=O(10^{6})$ (Hutchins et al. Reference Hutchins, Chauhan, Marusic, Monty and Klewicki2012), turbulent pipe flows with
 $Re_{\unicode[STIX]{x1D70F}}=O(10^{4}{-}10^{5})$ (Hultmark et al. Reference Hultmark, Vallikivi, Bailey and Smits2012; Örlü et al. Reference Örlü, Fiorini, Segalini, Bellani, Talamelli and Alfredsson2017) and a turbulent channel flow with
 $Re_{\unicode[STIX]{x1D70F}}=5200$ (Lee & Moser Reference Lee and Moser2015). The
 $k_{x}^{-1}$ regions in the pre-multiplied energy spectra of
 $u$ have been reported in ZPG TBLs with
 $Re_{\unicode[STIX]{x1D70F}}=14\,000$ (Nickels et al. Reference Nickels, Marusic, Hafez and Chong2005), a turbulent channel flow with
 $Re_{\unicode[STIX]{x1D70F}}=5200$ (Lee & Moser Reference Lee and Moser2015) and a turbulent pipe flow with
 $Re_{\unicode[STIX]{x1D70F}}=3008$ (Ahn et al. Reference Ahn, Lee, Lee, Kang and Sung2015). In addition, the
 $k_{z}^{-1}$ regions (where
 $k_{z}$ is the spanwise wavenumber) have been observed in ZPG TBLs with
 $Re_{\unicode[STIX]{x1D70F}}=4000$ (Pirozzoli & Bernardini Reference Pirozzoli and Bernardini2013) and in turbulent channel and pipe flows (Ahn et al. Reference Ahn, Lee, Lee, Kang and Sung2015; Lee & Moser Reference Lee and Moser2015; Han et al. Reference Han, Hwang, Yoon, Ahn and Sung2019). A plateau in the pre-multiplied energy spectrum is not a necessary condition for logarithmic behaviour, since coherent motions contribute over a broad range of wavenumbers (Nickels & Marusic Reference Nickels and Marusic2001). Hwang (Reference Hwang2015) found that the spanwise wavelength (
 $\unicode[STIX]{x1D706}_{z}=2\unicode[STIX]{x03C0}/k_{z}$) of self-similar energy-containing motions is proportional to
 $y$, which were isolated from the results of a filtered and over-damped large-eddy simulation (Hwang & Cossu Reference Hwang and Cossu2010; Hwang Reference Hwang2013). Hellström, Marusic & Smits (Reference Hellström, Marusic and Smits2016) showed that the azimuthal wavenumbers of energetic motions are inversely proportional to their wall-normal length scales by performing a proper orthogonal decomposition of results for pipe flows.
Several models of such systems have been created by extending the model of Perry & Chong (Reference Perry and Chong1982) (Perry & Li Reference Perry and Li1990; Marusic, Uddin & Perry Reference Marusic, Uddin and Perry1997; Marusic Reference Marusic2001; Marusic & Kunkel Reference Marusic and Kunkel2003). Perry, Henbest & Chong (Reference Perry, Henbest and Chong1986) modified the inverse power law in the population density of attached eddies by increasing the weighting for those with  $\unicode[STIX]{x1D6FF}$-height to accurately predict the velocity defect law and the energy distribution in the low-wavenumber region. Despite this modification for large scales (Perry et al. Reference Perry, Henbest and Chong1986), a significant difference arises between the experimental data and the model prediction for APG TBLs, especially for the Reynolds stresses in the outer region (Perry, Li & Marusic Reference Perry, Li and Marusic1988). In later research, several weighting functions have been employed to compensate for the velocity scales (Perry et al. Reference Perry, Li and Marusic1988) and to recover the geometrical similarity of eddies (Perry, Li & Marusic Reference Perry, Li and Marusic1991). Perry, Marusic & Li (Reference Perry, Marusic and Li1994) developed an analytical expression, based on the logarithmic law of the wall and the law of the wake (Coles Reference Coles1956), for the Reynolds shear stress
 $(\langle -uv\rangle )$ in APG TBLs by utilizing one eddy shape to formulate the relationship between
 $\langle -uv\rangle$ and the mean defect velocity. Perry & Marusic (Reference Perry and Marusic1995) recognized that another eddy with a different shape is needed to describe Reynolds stresses in APG TBLs; the wall–wake attached-eddy model was proposed, comprised of wall-attached eddies (type A), larger detached eddies of size
 $O(\unicode[STIX]{x1D6FF})$ (type B) and smaller detached eddies including Kolmogorov scales (type C). Type B eddies with sizes that scale with their height mainly arise in the outer region and are modelled by trial and error. Perry, Marusic & Jones (Reference Perry, Marusic and Jones2002) extended the work of Perry et al. (Reference Perry, Marusic and Li1994) by including general non-equilibrium APG TBLs in the wall–wake attached-eddy model (Marusic & Perry Reference Marusic and Perry1995; Perry & Marusic Reference Perry and Marusic1995). A study of large scales in the outer region proposed a new approach to the analysis of larger detached structures (Smits, McKeon & Marusic Reference Smits, McKeon and Marusic2011). Details of the attached-eddy model are summarized in Marusic & Monty (Reference Marusic and Monty2019). Hwang & Sung (Reference Hwang and Sung2018) concluded that the wall-attached
 $u$ structures have an inverse power-law distribution and that there is an outer peak in their population density, which confirms that additional weighting is required for large scales as conjectured by Perry et al. (Reference Perry, Henbest and Chong1986). Hence, it is necessary to decompose coherent
 $u$ structures from the perspective of attached-eddy models in order to understand the multiscale nature of wall turbulence.
Recently, increased attention has been paid to the coherent structures in APG TBLs. Hairpin packets are more inclined further from the wall (Lee & Sung Reference Lee and Sung2009; Lee et al. Reference Lee, Lee, Lee and Sung2010) and the inclination angle increases with increases in the strength of the APG (Lee Reference Lee2017). In the outer region, the lengths of the long  $u$ streaks with size
 $O(\unicode[STIX]{x1D6FF})$ decrease, and the widths of negative-
 $u$ structures increase (Lee & Sung Reference Lee and Sung2009; Lee Reference Lee2017). It was difficult in the early studies to discriminate whether coherent structures are attached to the wall or detached. To overcome this limitation, intense coherent structures were extracted from instantaneous flow fields of isotropic turbulence (Moisy & Jiménez Reference Moisy and Jiménez2004), homogeneous shear turbulence (Dong et al. Reference Dong, Lozano-Durán, Sekimoto and Jiménez2017), ZPG TBLs (Sillero Reference Sillero2014; Hwang & Sung Reference Hwang and Sung2018), turbulent channel flows (Del Álamo et al. Reference Del Álamo, Jiménez, Zandonade and Moser2006; Lozano-Durán, Flores & Jiménez Reference Lozano-Durán, Flores and Jiménez2012; Lozano-Durán & Jiménez Reference Lozano-Durán and Jiménez2014; Osawa & Jiménez Reference Osawa and Jiménez2018) and turbulent pipe flows (Hwang & Sung Reference Hwang and Sung2019). The identified structures can be classified as wall-attached or wall-detached on the basis of their minimum distance from the wall. These wall-attached structures are self-similar and make dominant contributions to the turbulence statistics in the logarithmic region. Subsequently, Maciel, Gungor & Simens (Reference Maciel, Gungor and Simens2017a,Reference Maciel, Simens and Gungorb) analysed the individual clusters in non-equilibrium APG TBLs by identifying ejections and sweeps. The self-similar wall-attached ejections and sweeps in APG TBLs carry 30 %–45 % of
 $\langle -uv\rangle$ in the region
 $y/\unicode[STIX]{x1D6FF}=0.2{-}0.8$, which is larger than the contribution (25 %–40 %) for ZPG TBLs. The self-similar wall-detached ejections and sweeps mainly arise in the outer region, and their contribution to
 $\langle -uv\rangle$ increases as the strength of the APG increases. Since self-similar structures in APG TBLs play a major role in their energy-containing motions, especially in the outer region, it is essential to analyse the coherent
 $u$ structures in APG TBLs by decomposing them in the terms defined by attached-eddy models.
The objective of the present study is to explore the three-dimensional (3-D)  $u$ clusters by decomposing them in the view of Townsend’s attached-eddy hypothesis. To this end, direct numerical simulation (DNS) data for APG and ZPG TBLs with
 $Re_{\unicode[STIX]{x1D70F}}\approx 800$ are used. The procedures for the identification of
 $u$ clusters are described in § 2. The identified structures are classified into attached self-similar (type A, wall scales), attached non-self-similar (type B, outer scales) and detached structures (viscous scales) according to their height (
 $l_{y}$). In § 3, we scrutinize the properties of type A and type B structures, which are both physically attached to the wall. The population densities of type A structures are inversely proportional to their height, and they are geometrically self-similar in APG and ZPG TBLs. Type B structures contribute to the presence of the outer peak located at
 $l_{y}=O(\unicode[STIX]{x1D6FF})$ in the population density and are non-self-similar with
 $l_{y}$. Type A structures are universal irrespective of the pressure gradient, whereas type B structures make dominant contributions to the outer large scales and are strengthened by the APG. In § 4, we explore the size distributions of the detached
 $u$ structures, which can be classified as short or tall based on
 $l_{y}$. The former structures are non-self-similar, and the latter are isotropic and geometrically self-similar. Finally, we present our conclusions in § 5.
2 Numerical details
In the present study, the DNS dataset for an APG TBL (Yoon et al. Reference Yoon, Hwang and Sung2018) is used. The continuity equation and the Navier–Stokes equations for incompressible flows are discretized in this DNS by using the fractional step method (Park & Sung Reference Park and Sung1995; Kim, Baek & Sung Reference Kim, Baek and Sung2002; Kim, Huang & Sung Reference Kim, Huang and Sung2010). The computational domain sizes are  $1834\unicode[STIX]{x1D6FF}_{0}\times 100\unicode[STIX]{x1D6FF}_{0}\times 130\unicode[STIX]{x1D6FF}_{0}$ in the streamwise (
 $x$), wall-normal (
 $y$) and spanwise (
 $z$) directions, respectively. Here,
 $\unicode[STIX]{x1D6FF}_{0}$ is the inlet boundary layer thickness. The number of grids is 10 497 (
 $x$)
 $\times$ 541 (
 $y$)
 $\times$ 1025 (
 $z$). The power-law distribution of the free-stream velocity
 $U_{\infty }=U_{0}(1-x/200\unicode[STIX]{x1D6FF}_{0})^{-0.2}$ is imposed on the Neumann boundary condition through the continuity
 $(\unicode[STIX]{x2202}\overset{{\sim}}{v}/\unicode[STIX]{x2202}y=-\unicode[STIX]{x2202}U_{\infty }/\unicode[STIX]{x2202}x)$ for an equilibrium layer (Townsend Reference Townsend1961; Mellor & Gibson Reference Mellor and Gibson1966). Here,
 $U_{0}$ is the inlet free-stream velocity and
 $\overset{{\sim}}{v}$ is the wall-normal component of raw velocities. For comparison, the DNS dataset for a ZPG TBL (Hwang & Sung Reference Hwang and Sung2017) is also analysed. Details of the numerical procedure and the boundary conditions can be found in Yoon et al. (Reference Yoon, Hwang and Sung2018). The computational domain is summarized in table 1.
Parameters of the computational domain. Parameters  $L_{i}$ and
 $N_{i}$ are the domain size and the number of grids in each direction, respectively;
 $\unicode[STIX]{x0394}x^{+}$,
 $\unicode[STIX]{x0394}y^{+}$ and
 $\unicode[STIX]{x0394}z^{+}$ are the grid resolutions in the streamwise, wall-normal and spanwise directions, respectively; and
 $\unicode[STIX]{x0394}y_{min}^{+}$ and
 $\unicode[STIX]{x0394}y_{100}^{+}$ represent the resolutions of the 1st and 100th wall-normal grid from the wall, respectively. The inner-normalized resolutions were obtained at
 $Re_{\unicode[STIX]{x1D70F}}=775$ and
 $Re_{\unicode[STIX]{x1D70F}}=825$ for the APG and ZPG TBLs, respectively.

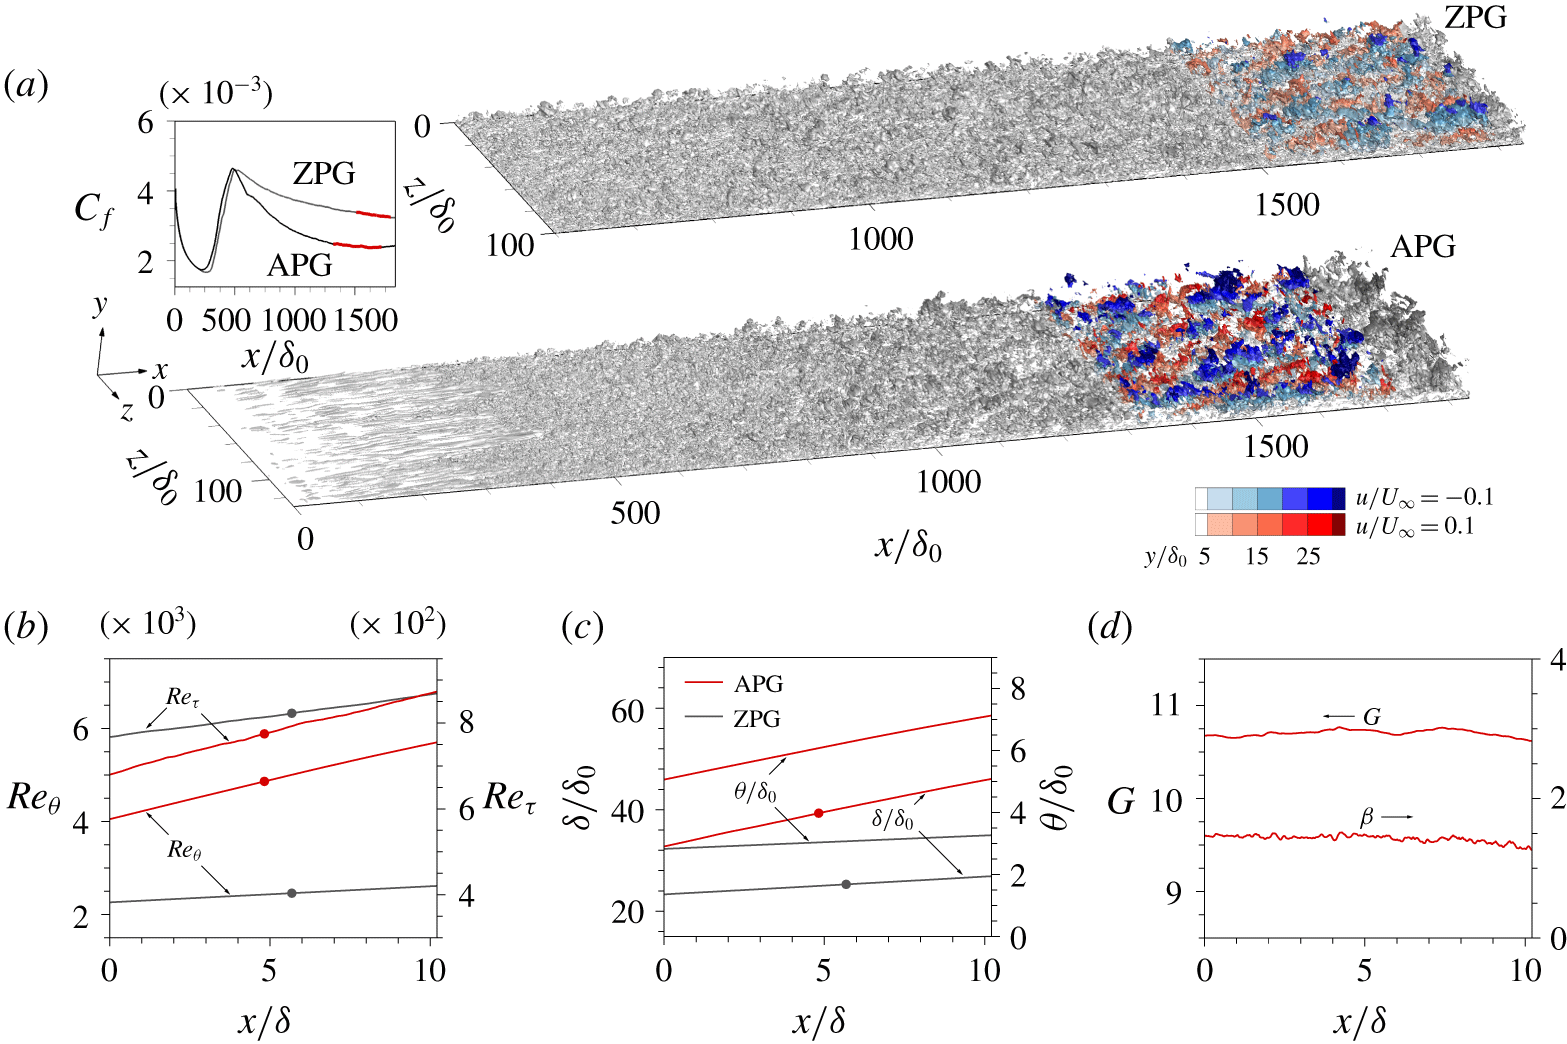
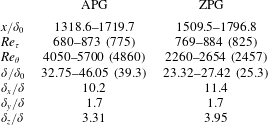
The domain of interest (DoI) is  $10\unicode[STIX]{x1D6FF}(x)\times 1.7\unicode[STIX]{x1D6FF}(y)\times 3\unicode[STIX]{x1D6FF}(z)$. Figure 1(a) shows the skin friction coefficient
 $(C_{f}=2u_{\unicode[STIX]{x1D70F}}^{2}/U_{\infty }^{2})$ and 3-D iso-surface of
 $u$, where the colour contour indicates the DoI. The friction Reynolds numbers for the APG and ZPG TBLs are
 $Re_{\unicode[STIX]{x1D70F}}=775$ and 825, respectively, and the equivalent momentum-thickness Reynolds numbers are
 $Re_{\unicode[STIX]{x1D703}}=4860$ and 2457, respectively (figure 1b). The variations in
 $\unicode[STIX]{x1D6FF}$ and momentum thickness
 $\unicode[STIX]{x1D703}$ are shown in figure 1(c). The defect shape factor,
 $G\equiv \unicode[STIX]{x1D6E5}^{-1}\int _{0}^{\unicode[STIX]{x1D6FF}}(U_{\infty }-\overline{U})^{2}u_{\unicode[STIX]{x1D70F}}^{-2}\,\text{d}y$, and the non-dimensional pressure gradient parameter,
 $\unicode[STIX]{x1D6FD}\equiv \unicode[STIX]{x1D6FF}^{\ast }\unicode[STIX]{x1D70F}_{w}^{-1}(\text{d}p/\text{d}x)=-\unicode[STIX]{x0394}u_{\unicode[STIX]{x1D70F}}^{-1}(\text{d}U_{\infty }/\text{d}x)$ (Clauser Reference Clauser1954), are almost constant (figure 1d). Here,
 $\overline{U}(y)$ is the streamwise mean velocity,
 $\unicode[STIX]{x1D70F}_{w}$ is the wall shear stress,
 $\unicode[STIX]{x1D6FF}^{\text{*}}$ is the displacement thickness
 $(\equiv \int _{0}^{\unicode[STIX]{x1D6FF}}(U_{\infty }-\overline{U})U_{\infty }^{-1}\,\text{d}y)$ and
 $\unicode[STIX]{x1D6E5}$ is the Rotta–Clauser length scale
 $(\equiv \int _{0}^{\unicode[STIX]{x1D6FF}}(U_{\infty }-\overline{U})u_{\unicode[STIX]{x1D70F}}^{-1}\,\text{d}y)$. Note that
 $u_{\unicode[STIX]{x1D70F}}$ and
 $\unicode[STIX]{x1D6FF}$ are chosen at the centre of the DoI. The characteristics of the DoI are listed in table 2.
(a) Skin friction coefficient ( $\text{C}_{f}$) and 3-D iso-surface of
 $u$. The red line and the coloured contours indicate the DoI. (b) Momentum thickness Reynolds number (
 $Re_{\unicode[STIX]{x1D703}}$) and friction Reynolds number (
 $Re_{\unicode[STIX]{x1D70F}}$). (c) Momentum thickness (
 $\unicode[STIX]{x1D703}$) and boundary layer thickness (
 $\unicode[STIX]{x1D6FF}$). (d) Defect shape factor (
 $G$) and non-dimensional pressure gradient parameter (
 $\unicode[STIX]{x1D6FD}$). The points in (b) and (c) are representative of the DoI.

The characteristics of the DoI. The numbers in parentheses indicate the values at the centre of the DoI (the points in figure 1b,c). Parameters  $\unicode[STIX]{x1D6FF}_{x}$,
 $\unicode[STIX]{x1D6FF}_{y}$ and
 $\unicode[STIX]{x1D6FF}_{z}$ are the streamwise, wall-normal and spanwise extents of the DoI, respectively.

2.1 Detection of the turbulent/non-turbulent interface
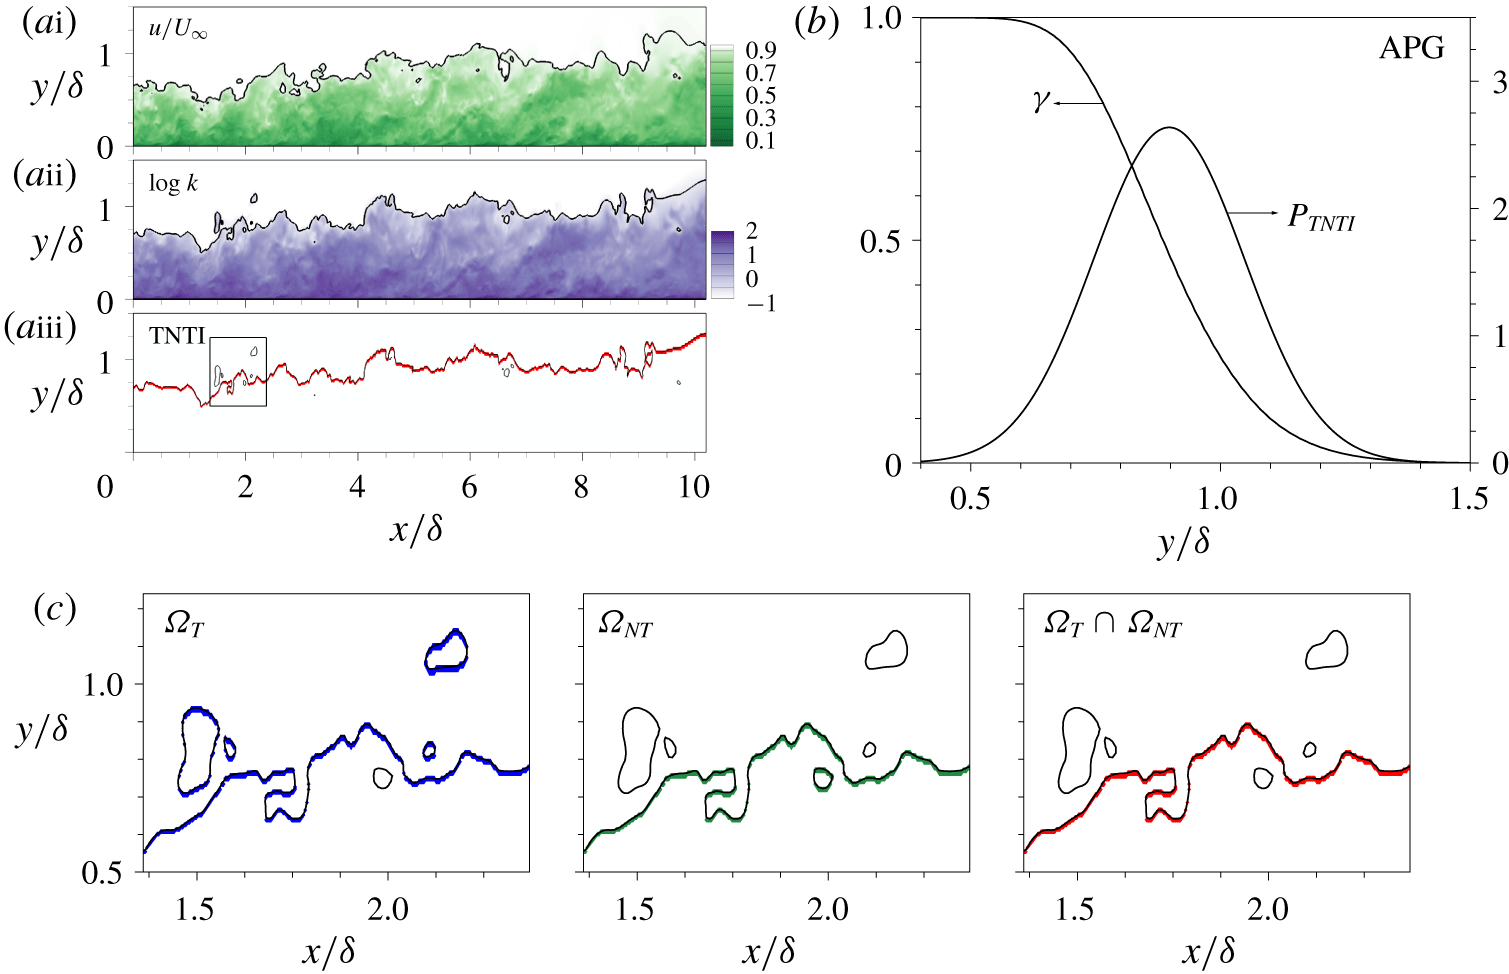
The turbulent/non-turbulent interface (TNTI) that demarcates the turbulent and non-turbulent regions can be defined based on kinetic energy criteria (Chauhan et al. Reference Chauhan, Philip, De Silva, Hutchins and Marusic2014). The purpose of this section is to introduce the contamination of velocity fluctuations by using the Reynolds decomposition near the TNTI. The accurate prediction of the TNTI is important for extracting wall-attached clusters in the outer region. The wall-normal height of the TNTI  $\unicode[STIX]{x1D6FF}_{TNTI}(x,z,t)$ is varied depending on the boundary layer thickness
 $\unicode[STIX]{x1D6FF}(x)$. As a result, the structures of velocity fluctuations are contaminated near the TNTI (Kwon, Hutchins & Monty Reference Kwon, Hutchins and Monty2016). In particular, both large and small scales near the TNTI are significantly amplified in the APG TBL. The raw streamwise velocities (
 $\tilde{u}$) normalized by
 $U_{\infty }$ are displayed in figure 2(ai), where the white line is the contour
 $\tilde{u} /U_{\infty }=0.95$. Figure 2(aii) shows the logarithm of the local kinetic energy (k) obtained from all velocity fluctuations in the reference frame moving with
 $U_{\infty }$ over
 $3\times 3\times 3$ grids, and the black line in figure 2(aii) indicates the threshold value of
 $k$ chosen at
 $k_{threshold}=0.2$, which corresponds closely to the line
 $\tilde{u} /U_{\infty }=0.95$. The red line in figure 2(aiii) shows the TNTI determined from the black
 $k_{threshold}$ line. The mean height of the TNTI is
 $\langle \unicode[STIX]{x1D6FF}_{TNTI}\rangle =0.9\unicode[STIX]{x1D6FF}$, which is slightly higher than that of a ZPG TBL
 $(\langle \unicode[STIX]{x1D6FF}_{TNTI}\rangle =0.88\unicode[STIX]{x1D6FF})$ (Hwang & Sung Reference Hwang and Sung2018). The probability density function (PDF) of the TNTI (
 $P_{TNTI}$) and the intermittency (
 $\unicode[STIX]{x1D6FE}$) are shown in figure 2(b). Figure 2(c) shows magnified views of the rectangular box in figure 2(aiii) and thus illustrates how the TNTI is determined. In figure 2(c), the blue lines connect the points of the
 $k_{threshold}$ grid including the turbulent region (
 $\unicode[STIX]{x1D6FA}_{T}$), and the green lines indicate the non-turbulent region (
 $\unicode[STIX]{x1D6FA}_{NT}$). Finally, to eliminate the turbulence drops in
 $\unicode[STIX]{x1D6FA}_{T}$ and the bubbles in
 $\unicode[STIX]{x1D6FA}_{NT}$, we define the TNTI as the union
 $(\unicode[STIX]{x1D6FA}_{T}\cap \unicode[STIX]{x1D6FA}_{NT})$ (Borrell & Jiménez Reference Borrell and Jiménez2016; Yang, Hwang & Sung Reference Yang, Hwang and Sung2019).
(a) Iso-surfaces of (i) the streamwise velocity ( $\tilde{u}$), (ii) the local kinetic energy (k) and (iii) the TNTI in the
 $x$–
 $y$ plane. The black lines in (i) and (ii) indicate 0.95
 $U_{\infty }$ and
 $k_{threshold}$ (
 $=0.2$), and the red and black lines in (iii) and (c) are the TNTI and
 $k_{threshold}$, respectively. (b) Intermittency (
 $\unicode[STIX]{x1D6FE}$) and PDF of
 $\unicode[STIX]{x1D6FF}_{TNTI}$. (c) Enlarged views of the rectangular box in (aiii).

All raw velocities ( $\tilde{u} _{i}$) are conditionally averaged with respect to the wall-normal height of the TNTI (
 $\unicode[STIX]{x1D6FF}_{TNTI}$);
 $\overset{{\sim}}{U}_{i}(y,\unicode[STIX]{x1D6FF}_{TNTI})$ (
 $=\langle \overset{{\sim}}{u}_{i}(\boldsymbol{x},t)|\unicode[STIX]{x1D6FF}_{TNTI}(x,z,t)\rangle$) is the mean velocity as a function of
 $\unicode[STIX]{x1D6FF}_{TNTI}$ (Kwon et al. Reference Kwon, Hutchins and Monty2016). The mean velocity from the Reynolds decomposition is denoted as
 $\overline{U}_{i}(y)$ (
 $=\langle \overset{{\sim}}{u}_{i}(\boldsymbol{x},t)\rangle$). The velocity fluctuations can be defined in terms of
 $\overset{{\sim}}{U}_{i}$ as
 $u_{i}(\boldsymbol{x},t,\unicode[STIX]{x1D6FF}_{TNTI})$ (
 $=\overset{{\sim}}{u}_{i}(\boldsymbol{x},t)-\overset{{\sim}}{U}_{i}(y,\unicode[STIX]{x1D6FF}_{TNTI})$) and from the Reynolds decomposition as
 $u_{i}^{\prime }(\boldsymbol{x},t)$ (
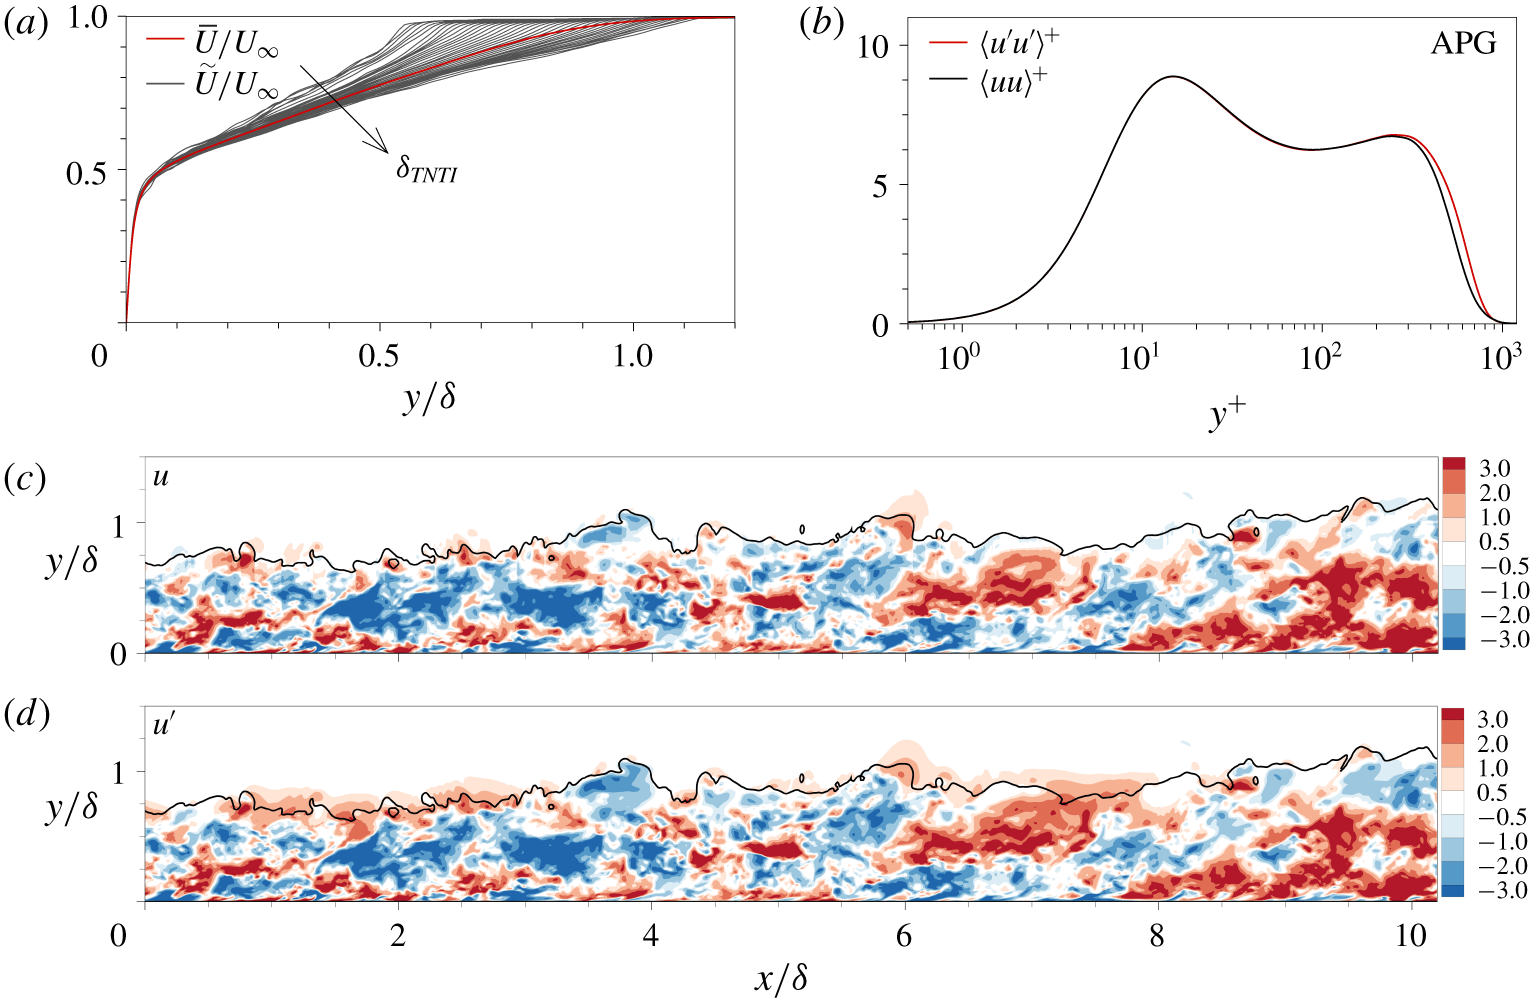
 $=\overset{{\sim}}{u}_{i}(\boldsymbol{x},t)-\overline{U}_{i}(y)$). Note that Jiménez et al. (Reference Jiménez, Hoyas, Simens and Mizuno2010) obtained the TNTI based on enstrophy criteria. We found that the wall-attached structures remain qualitatively unchanged regardless of the detection method used. Figure 3(a) shows
 $\overset{{\sim}}{U}$ and
 $\overline{U}$, where the profiles of
 $\overset{{\sim}}{U}$ diverge beyond
 $y/\unicode[STIX]{x1D6FF}=0.05$ and the magnitude of
 $\overset{{\sim}}{U}$ at
 $y/\unicode[STIX]{x1D6FF}=0.5$ decreases with increases in
 $\unicode[STIX]{x1D6FF}_{TNTI}$. The streamwise Reynolds stress
 $\langle uu\rangle ^{+}$ is calculated from
 $u$ as shown in figure 3(b), where the two profiles of
 $\langle uu\rangle ^{+}$ and
 $\langle u^{\prime }u^{\prime }\rangle ^{+}$ coincide except near the boundary edge; the wall-normal locations of the outer peaks are independent of the pressure gradient. To highlight the discrepancy between
 $u$ and
 $u^{\prime }$, the instantaneous velocities of
 $u$ (figure 3c) and
 $u^{\prime }$ (figure 3d) are illustrated. The red and blue contours indicate positive and negative fluctuations, respectively. The solid line near
 $y$ =
 $\unicode[STIX]{x1D6FF}$ is a line contour of
 $k_{threshold}$. The magnitudes of the positive- and negative-
 $u^{\prime }$ strengthen when
 $\unicode[STIX]{x1D6FF}_{TNTI}$ is lower than
 $\unicode[STIX]{x1D6FF}$ (
 $x/\unicode[STIX]{x1D6FF}$
 ${\approx}$ 2 and 7.5) and higher than
 $\unicode[STIX]{x1D6FF}$ (
 $x/\unicode[STIX]{x1D6FF}$
 ${\approx}$ 3.5 and 10), respectively.
(a) Mean velocity  $\overline{U}(y)$ and conditional mean velocity
 $\overset{{\sim}}{U}(y,\unicode[STIX]{x1D6FF}_{TNTI})$. (b) Profiles of
 $\langle u^{\prime }u^{\prime }\rangle ^{+}$ and
 $\langle uu\rangle ^{+}$. Iso-surfaces of (c)
 $u$ and (d)
 $u^{\prime }$. The black line indicates
 $k_{threshold}$, and the red and blue contours indicate positive and negative fluctuations, respectively.

2.2 Identification of coherent structures
The coherent structures of  $u$ are defined as groups of connected points of
 $u(\boldsymbol{x},t)>\unicode[STIX]{x1D6FC}u_{rms}(y,\unicode[STIX]{x1D6FF}_{TNTI})$ and
 $u(\boldsymbol{x},t)<-\unicode[STIX]{x1D6FC}u_{rms}(y,\unicode[STIX]{x1D6FF}_{TNTI})$ in instantaneous flow fields, where
 $\unicode[STIX]{x1D6FC}$ is the threshold and
 $u_{rms}$ is the root mean square of
 $u$ as a function of
 $y$ and
 $\unicode[STIX]{x1D6FF}_{TNTI}$. Note that the results shown in the present study are not sensitive to the variation of
 $k$ in the vicinity of
 $k_{threshold}$, because we extracted the intense turbulence motions (Hwang & Sung Reference Hwang and Sung2018). To detect each
 $u$ cluster, we use the connectivity of neighbouring six-orthogonal grids at a given node in Cartesian coordinates (Moisy & Jiménez Reference Moisy and Jiménez2004; Del Álamo et al. Reference Del Álamo, Jiménez, Zandonade and Moser2006; Lozano-Durán et al. Reference Lozano-Durán, Flores and Jiménez2012; Lozano-Durán & Jiménez Reference Lozano-Durán and Jiménez2014; Sillero Reference Sillero2014; Dong et al. Reference Dong, Lozano-Durán, Sekimoto and Jiménez2017; Maciel et al. Reference Maciel, Gungor and Simens2017a,Reference Maciel, Simens and Gungorb; Hwang & Sung Reference Hwang and Sung2018; Osawa & Jiménez Reference Osawa and Jiménez2018; Hwang & Sung Reference Hwang and Sung2019). By using this method (Moisy & Jiménez Reference Moisy and Jiménez2004), we can obtain the spatial information for individual
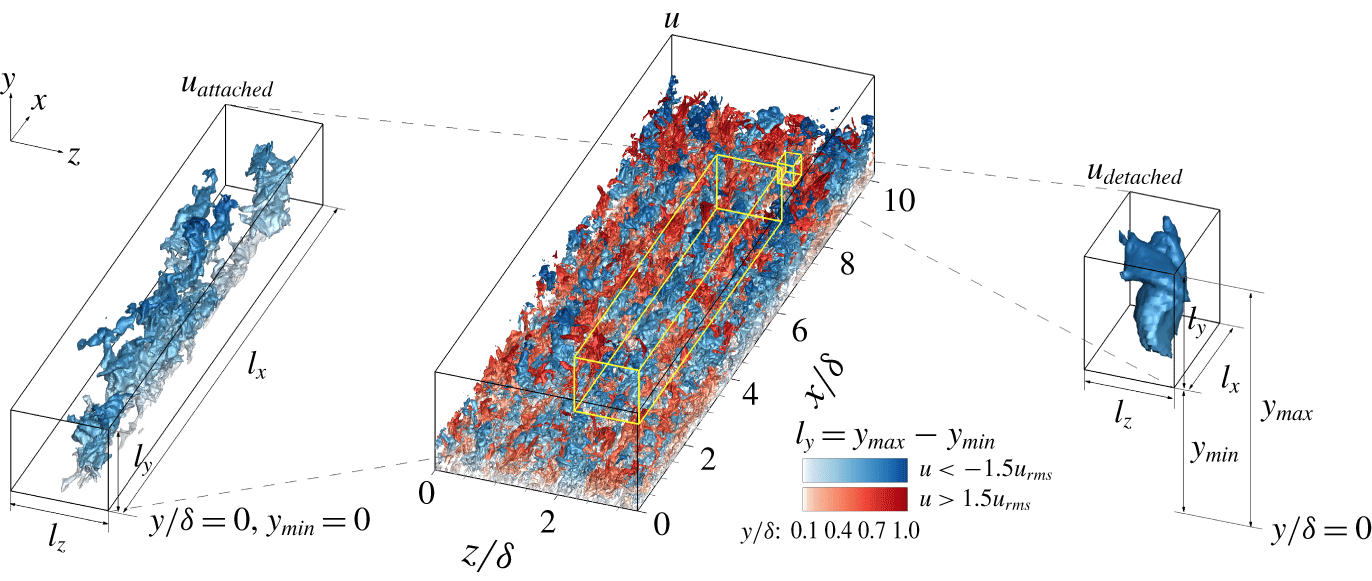
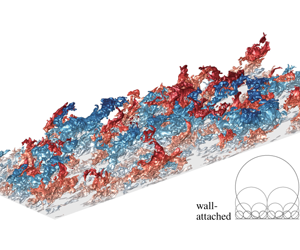
 $u$ clusters. Figure 4 shows iso-surfaces of
 $u$ in an instantaneous flow field of the APG TBL. Positive-
 $u$ (high speed;
 $u>\unicode[STIX]{x1D6FC}u_{rms}$) and negative-
 $u$ (low speed;
 $u<-\unicode[STIX]{x1D6FC}u_{rms}$) clusters are represented by red and blue, respectively, and wall-normal locations are illustrated by colour depths. The two insets show samples of the attached and detached
 $u$ structures. The length scales of an individual cluster are defined as the dimensions of the box circumscribing the object, i.e.
 $l_{x}$,
 $l_{y}$ and
 $l_{z}$ are its streamwise, wall-normal and spanwise lengths, respectively. The wall-normal height (
 $l_{y}$) of clusters is defined as
 $l_{y}=y_{max}-y_{min}$, which are the maximum and minimum distances from the wall.
The 3-D iso-surfaces of  $u$ in the APG TBL. The left- and right-hand insets show samples of the attached and detached
 $u$ structures, respectively.

(a) Percolation diagram for the detected  $u$ clusters. The variations with
 $\unicode[STIX]{x1D6FC}$ in the total volume (
 $V$) and the total number (
 $N$) of clusters. (b) The number of
 $u$ clusters per unit wall-parallel area (
 $n^{\ast }$) with respect to
 $y_{min}$ and
 $y_{max}$.

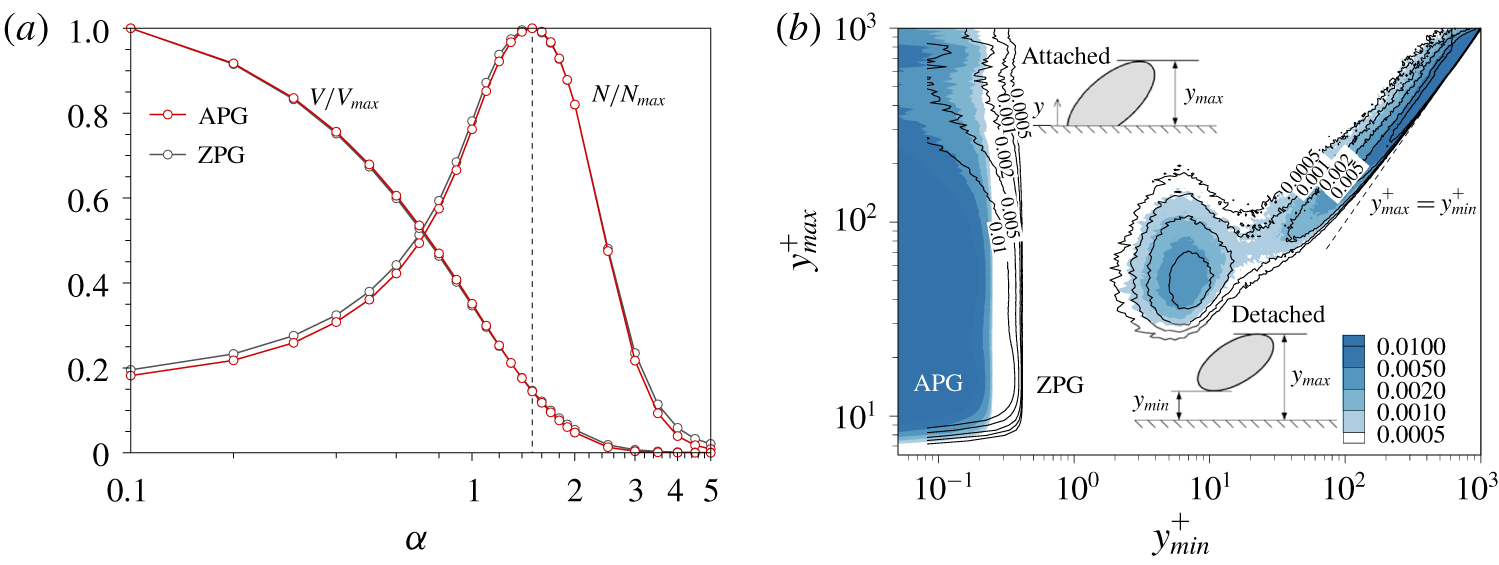
The percolation diagram for the identified  $u$ clusters in figure 5(a) enables the choice of
 $\unicode[STIX]{x1D6FC}$. The percolation theory describes the statistics of the contiguous nodes in a randomly distributed system. The total number (N) and total volume (
 $V$) at a particular
 $\unicode[STIX]{x1D6FC}$ are normalized by the maximum
 $N$ (
 $N_{max}$) and
 $V$ (
 $V_{max}$) over
 $\unicode[STIX]{x1D6FC}$, respectively, which are the sum of the corresponding clusters for negative and positive fluctuations. The normalized volume (
 $V/V_{max}$) increases with decreases in
 $\unicode[STIX]{x1D6FC}$, and in particular it significantly changes in the range
 $1.2<\unicode[STIX]{x1D6FC}<1.7$, which indicates the occurrence of the percolation crisis. Within this region, the number ratio (
 $N/N_{max}$) shows a peak at
 $\unicode[STIX]{x1D6FC}=1.5$. As
 $\unicode[STIX]{x1D6FC}$ decreases, new clusters arise or some of the previously identified clusters become connected. The trade-off between the two effects leads to the presence of a peak in the variation in
 $N/N_{max}$; the former behaviour is dominant for
 $\unicode[STIX]{x1D6FC}>1.5$ and vice versa. In addition, the variations in
 $V/V_{max}$ and
 $N/N_{max}$ in the APG and ZPG TBLs coincide, indicating that the percolation behaviour of the
 $u$ clusters is independent of the pressure gradient. In the present study, we select
 $\unicode[STIX]{x1D6FC}=1.5$ based on the percolation transition.
Figure 5(b) shows the number of  $u$ clusters per unit wall-parallel area (
 $A_{xz}=\unicode[STIX]{x1D6FF}_{x}\unicode[STIX]{x1D6FF}_{z}$) as a function of
 $y_{min}$ and
 $y_{max}$, which are the minimum and maximum distances from the wall:
 $$\begin{eqnarray}n^{\ast }=\frac{n(y_{min},y_{max})}{mA_{xz}},\end{eqnarray}$$
where  $n$ is the number of identified
 $u$ clusters and
 $m$ is the number of instantaneous flow fields used to detect
 $u$ clusters (
 $m=2758$ for the APG TBL and 2100 for the ZPG TBL). Here, the colour and line contours of
 $n^{\ast }$ are for the APG and ZPG TBLs, respectively. Only the
 $u$ clusters with volumes larger than
 $30^{3}$ wall units are analysed (Del Álamo et al. Reference Del Álamo, Jiménez, Zandonade and Moser2006). The
 $u$ structures are divided into two groups: those are observed at
 $y_{min}^{+}\approx 0$ and
 $y_{min}^{+}>0$, i.e. the wall-attached and wall-detached structures, respectively. Following the research of Hwang & Sung (Reference Hwang and Sung2018) and Hwang & Sung (Reference Hwang and Sung2019), we defined the wall-attached objects as those with
 $y_{min}^{+}\approx 0$; i.e. those structures that are physically attached to the wall. Note that Townsend’s attached-eddy hypothesis does not suppose that attached eddies are physically anchored to the wall because attached eddies are assumed to be inviscid. Of course, the present study could define the attached structures as those structures with
 $y_{min}$ below the viscous sublayer (
 $y^{+}=5$) but for 80 % of such structures
 $y_{min}^{+}\approx 0$. In addition, 94 % of the tall structures (
 $l_{y}^{+}=y_{max}^{+}-y_{min}^{+}>100$ and
 $y_{min}^{+}<5$) examined in the present work are based on
 $y_{min}^{+}\approx 0$, which indicates that the results of the present study are not affected by the use of this criterion.
With the present criterion (i.e.  $y_{min}^{+}\approx 0$), we can analyse the wall-normal variations of the turbulence statistics carried by these structures according to their height (
 $l_{y}$) without any interpolation since
 $l_{y}=y_{max}$. Moreover, we distinguish between the words ‘attached’ and ‘self-similar’ in contrast to several previous studies discussing the attached-eddy hypothesis because the clusters of
 $u$ can be decomposed into attached self-similar, attached non-self-similar, detached self-similar and detached non-self-similar motions. Here, ‘self-similar motions’ are defined as the clusters whose characteristic length scales are proportional to their height.
For the attached structures  $(y_{min}^{+}\approx 0)$,
 $y_{max}$ varies from the near-wall region to the outer region and in particular an outer peak emerges near
 $y_{max}^{+}=700$, which implies the dominance of very tall attached structures in the vicinity of the boundary edge. On the other hand, the detached
 $u$ structures are distributed in a narrow band and are densely populated in the outer region (see § 4). A weak peak appears at
 $y_{min}^{+}\approx 7$ and
 $y_{max}^{+}\approx 50$, but its strength is at least two orders of magnitude lower than that in the outer region. The structures in this region may be associated with debris from attached structures or objects that are evolving towards attached ones (Hwang & Sung Reference Hwang and Sung2018). A further exploration of their temporal evolution is necessary, although beyond the scope of the present work.
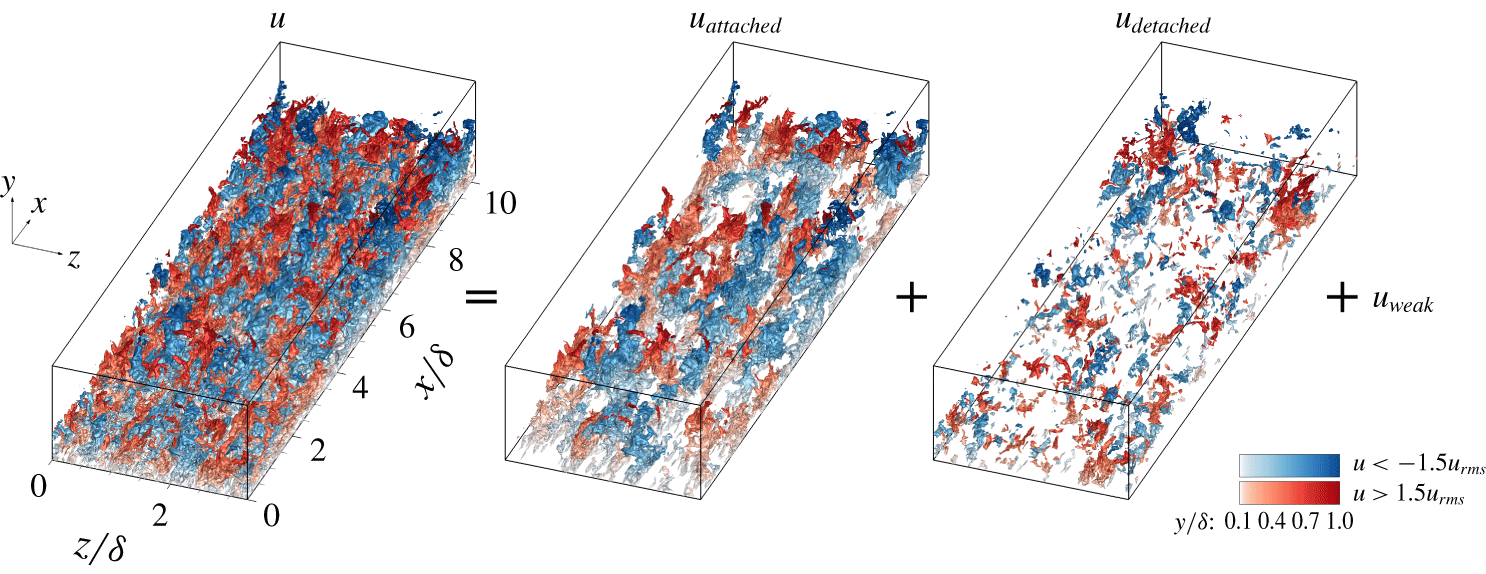
Figure 6 shows the 3-D iso-surfaces of the intense  $u$ (
 $|u|>1.5u_{rms}$) in the APG TBL. Through the identification of individual clusters, we can decompose
 $u$ fields into
 $u_{attached}$,
 $u_{detached}$ and
 $u_{weak}$ (
 $|u|<1.5u_{rms}$). The blue and red contours indicate negative
 $u$ and positive
 $u$, respectively. The intensity of the colour represents the wall-normal distance. As can be seen in this figure, the iso-surfaces of
 $u_{attached}$ are significantly extended in the streamwise direction, and the negative and positive
 $u_{attached}$ are aligned side by side along the spanwise direction. On the other hand,
 $u_{detached}$ is much smaller than the large
 $u_{attached}$.
The 3-D iso-surfaces of  $u$ (
 $=u_{attached}+u_{detached}+u_{weak}$) in the APG TBL. Red and blue represent intense positive and negative
 $u$, respectively.

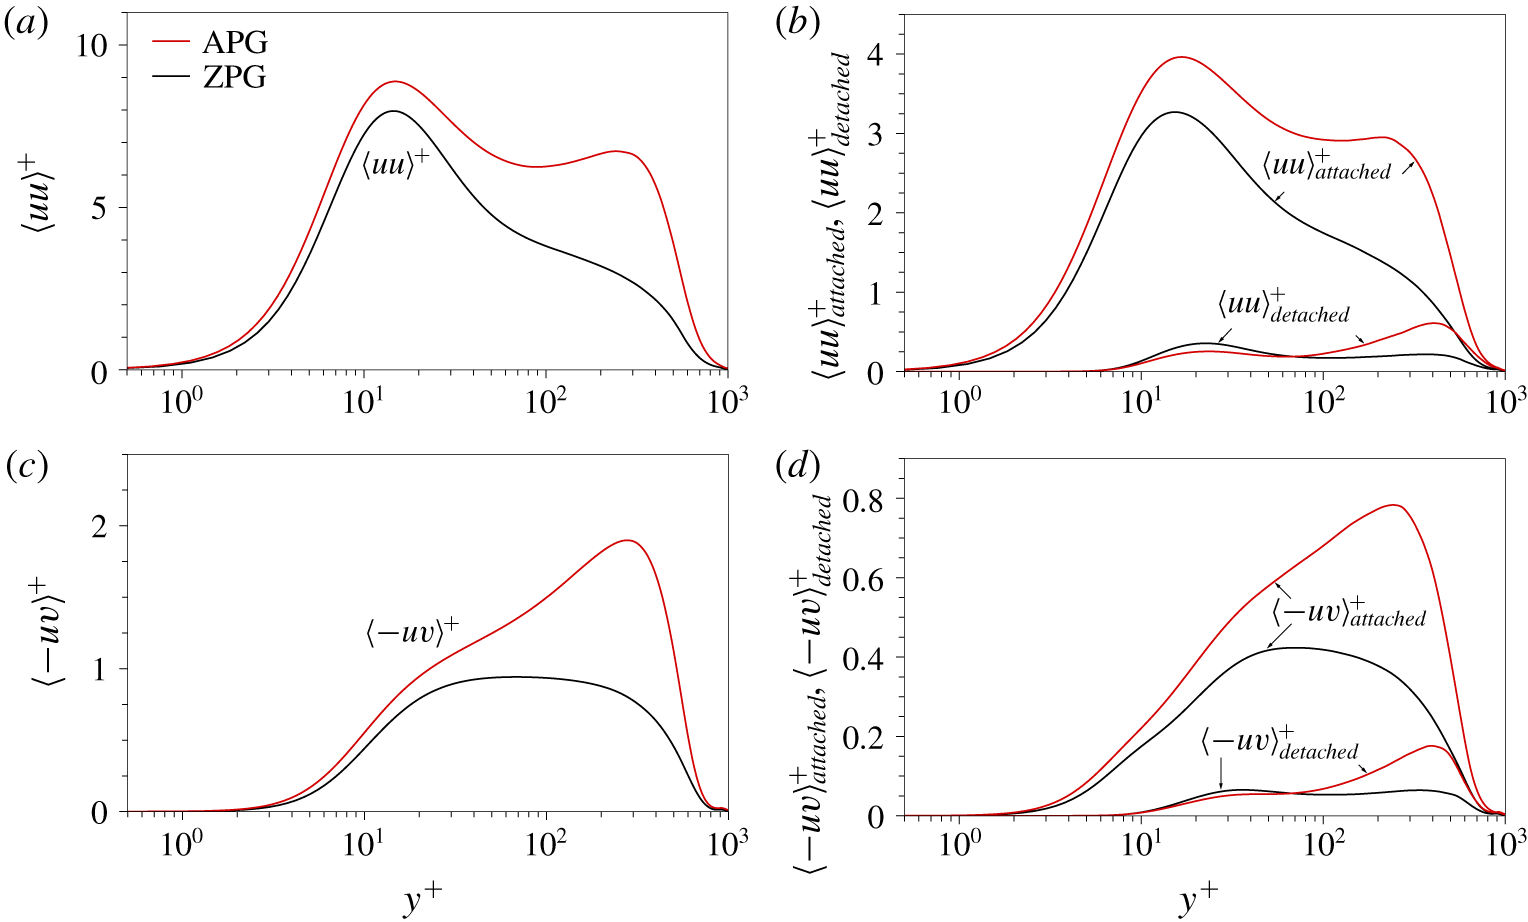
Profiles of (a)  $\langle uu\rangle ^{+}$ and (b)
 $\langle uu\rangle _{attached}^{+}$ and
 $\langle uu\rangle _{detached}^{+}$. Profiles of (c)
 $\langle -uv\rangle ^{+}$ and (d)
 $\langle -uv\rangle _{attached}^{+}$ and
 $\langle -uv\rangle _{detached}^{+}$.

Next, we examine the contributions of the attached and detached  $u$ structures to
 $\langle uu\rangle$. Figure 7(a) shows the profiles of
 $\langle uu\rangle ^{+}$, where the magnitude of
 $\langle uu\rangle ^{+}$ in the outer region is enhanced by the presence of a secondary peak near
 $y^{+}=240$ in the APG TBL (red line). The streamwise Reynolds stresses carried by the attached and detached
 $u$ structures are presented in figure 7(b) and are defined as
 $$\begin{eqnarray}\displaystyle & \displaystyle \langle u_{i}u_{j}\rangle _{attached}(y)=\frac{1}{mV_{DoI}}\iint _{\unicode[STIX]{x1D6FA}_{attached}}u_{i}(\boldsymbol{x})u_{j}(\boldsymbol{x})\,\text{d}x\,\text{d}z, & \displaystyle\end{eqnarray}$$
 $$\begin{eqnarray}\displaystyle & \displaystyle \langle u_{i}u_{j}\rangle _{detached}(y)=\frac{1}{mV_{DoI}}\iint _{\unicode[STIX]{x1D6FA}_{detached}}u_{i}(\boldsymbol{x})u_{j}(\boldsymbol{x})\,\text{d}x\,\text{d}z, & \displaystyle\end{eqnarray}$$
where  $\unicode[STIX]{x1D6FA}_{attached}$ and
 $\unicode[STIX]{x1D6FA}_{detached}$ are the domains of all constituent points of attached and detached structures, respectively, and
 $V_{DoI}$ (
 $=\unicode[STIX]{x1D6FF}_{x}\unicode[STIX]{x1D6FF}_{y}\unicode[STIX]{x1D6FF}_{z}$) is the volume of the DoI. The attached
 $u$ structures account for over half of
 $\langle uu\rangle ^{+}$, whereas the detached
 $u$ structures contribute to less than 13 % of
 $\langle uu\rangle ^{+}$. The remainder is responsible for weak turbulence. In addition, the shape of
 $\langle uu\rangle _{attached}^{+}$ is similar to that of
 $\langle uu\rangle ^{+}$. The wall-normal location of the inner peak of
 $\langle uu\rangle _{attached}^{+}$ is at
 $y^{+}$
 ${\approx}$ 15, and the outer peak of
 $\langle uu\rangle _{attached}^{+}$ arises at
 $y^{+}=210$. In contrast to
 $\langle uu\rangle _{attached}^{+}$, the profiles of
 $\langle uu\rangle _{detached}^{+}$ in the APG and ZPG TBLs follow each other closely up to
 $y^{+}=100$. At
 $y^{+}>100$, the magnitude of
 $\langle uu\rangle _{detached}^{+}$ in the APG TBL is larger than that in the ZPG TBL, and there is an outer peak at
 $y/\unicode[STIX]{x1D6FF}$ = 0.5. This result indicates that the detached structures within
 $y^{+}<100$ are defect by the pressure gradient. Note that the present Reynolds number (
 $Re_{\unicode[STIX]{x1D70F}}\approx 800$) is low. As the Reynolds number increases further, it is expected that the contribution of the attached structures will increase, and thus the similarity of the structures will be maintained in a manner analogous to that observed in turbulent pipe flows with
 $Re_{\unicode[STIX]{x1D70F}}=930$ and 3008 (Hwang & Sung Reference Hwang and Sung2019).
Figure 7(c) shows the profiles of  $\langle -uv\rangle ^{+}$; a peak is located at
 $y^{+}=280$ in the results for the APG TBL. We compute
 $\langle -uv\rangle$ from the results for the attached
 $(\langle -uv\rangle _{attached})$ and detached
 $(\langle -uv\rangle _{detached})$ structures obtained from (2.2) and (2.3). The attached structures contribute over 40 % of
 $\langle -uv\rangle ^{+}$, which is similar to a previous result for the wall-attached ejections and sweeps of APG TBLs (Maciel et al. Reference Maciel, Gungor and Simens2017a). In the present study, the identified wall-attached structures carry approximately half of
 $\langle uu\rangle ^{+}$ and
 $\langle -uv\rangle ^{+}$, which indicates that they are the main energy-containing motions.
3 Wall-attached structures
In this section, we examine the identified attached structures by focusing on the eddy models proposed by Perry & Marusic (Reference Perry and Marusic1995), which distinguish three types of eddies. First, type A eddies are self-similar and the main energy-containing motions in the logarithmic region. In this sense, such eddies are universal structures in wall turbulence. Type B eddies are characterized by the boundary layer thickness and are responsible for the turbulence statistics in the outer region and at low-wavenumber energies. Perry & Marusic (Reference Perry and Marusic1995) employed the type B eddies to model the outer peak of the streamwise Reynolds stress in APG TBLs because the intensity predicted by only considering type A eddies does not agree with experimental results for the outer region. Type C eddies are associated with small-scale motions. Although Perry & Marusic (Reference Perry and Marusic1995) concluded that type B eddies are physically detached from the wall, recent studies have shown that very-large-scale motions (VLSMs) or superstructures ( ${>}O(3\unicode[STIX]{x1D6FF})$) are related to type B eddies because these large-scale structures are characterized by the outer length scale (Hutchins & Marusic Reference Hutchins and Marusic2007b; Marusic & Monty Reference Marusic and Monty2019). However, the LSMs and VLSMs penetrate into the near-wall region and impose their footprints (Abe, Kawamura & Choi Reference Abe, Kawamura and Choi2004; Hutchins & Marusic Reference Hutchins and Marusic2007a; Hwang Reference Hwang2016; Hwang, Lee & Sung Reference Hwang, Lee and Sung2016a; Hwang et al. Reference Hwang, Lee, Sung and Zaki2016b; Yoon et al. Reference Yoon, Hwang, Lee, Sung and Kim2016; Hwang & Sung Reference Hwang and Sung2017), which indicates that they can physically adhere to the wall. In spectral space, the energies carried by structures of types A, B and C are overlaid, and thus it is challenging to extract typical motion types from the energy spectrum (Marusic & Monty Reference Marusic and Monty2019). Very recently, Baars & Marusic (Reference Baars and Marusic2020a,Reference Baars and Marusicb) successfully decomposed several types of motions in wavenumber space using spectral coherence analysis. In the present study, we simply decomposed the identified turbulence motions according to their height and now present the statistical properties of each structure, which are superimposed on those of types A, B and C motions described by Perry and co-workers.
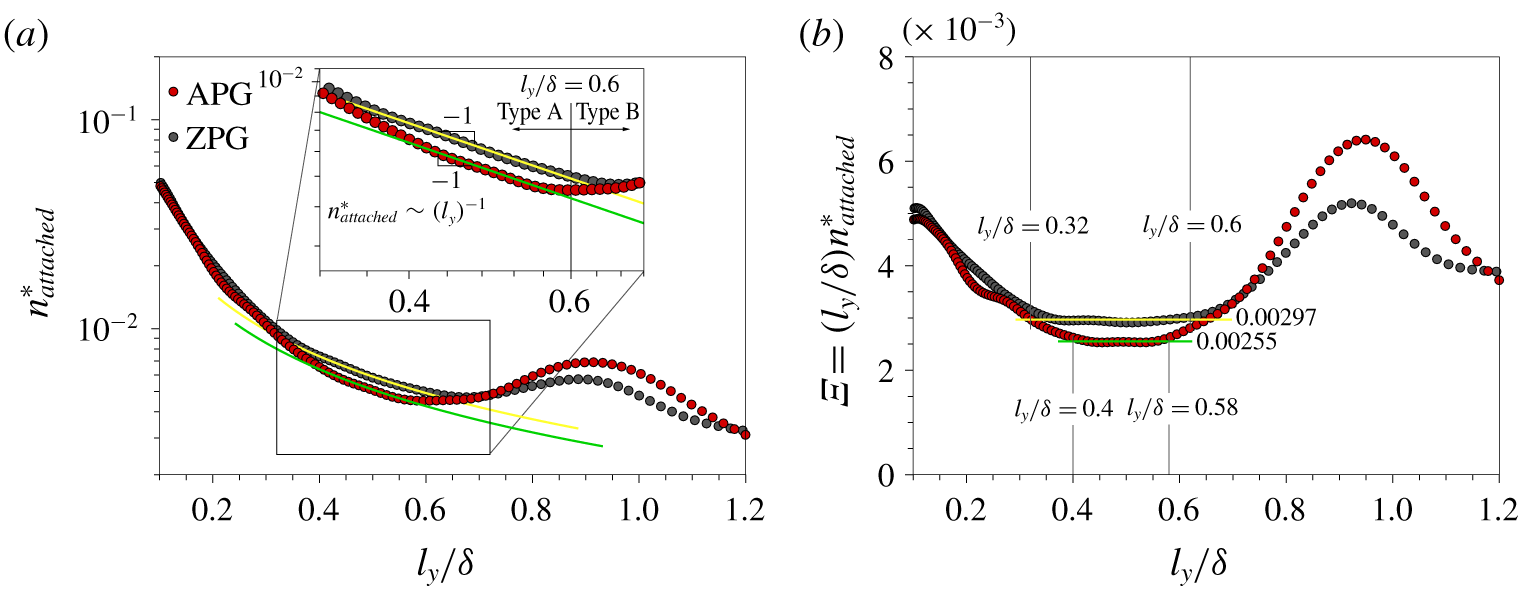
(a) The variation in  $n_{attached}^{\ast }$ with
 $l_{y}/\unicode[STIX]{x1D6FF}$. The inset shows an enlarged view of the region
 $l_{y}/\unicode[STIX]{x1D6FF}=0.32{-}0.72$. (b) Pre-multiplied population density of wall-attached structures,
 $\unicode[STIX]{x1D6EF}=(l_{y}/\unicode[STIX]{x1D6FF})n_{attached}^{\ast }$.

We examine the population density  $(n_{attached}^{\ast })$ of attached
 $u$ structures with respect to
 $l_{y}$. Here,
 $n_{attached}^{\ast }$ is defined as the number of attached
 $u$ structures (
 $n_{attached}$) per unit wall-parallel area with respect to
 $l_{y}$:
 $$\begin{eqnarray}n_{attached}^{\ast }(l_{y})=\frac{n_{attached}(l_{y})}{mA_{xz}},\end{eqnarray}$$
where  $n_{attached}$ is a function of
 $l_{y}$,
 $m$ is the number of snapshots and
 $A_{xz}$ is the wall-parallel area of the DoI. For attached structures,
 $l_{y}$ (
 $=y_{max}$) scales with the distance from the wall due to
 $y_{min}\approx 0$ (figure 5b). Hwang & Sung (Reference Hwang and Sung2018) showed that the population density of attached
 $u$ structures (
 $0.3<l_{y}/\unicode[STIX]{x1D6FF}<0.6$) in a ZPG TBL is inversely proportional to
 $l_{y}$, reminiscent of the hierarchical length-scale distribution of attached eddies (Perry & Chong Reference Perry and Chong1982). Perry & Chong (Reference Perry and Chong1982) assumed that each hierarchy is geometrically similar and that all length scales double from one hierarchy to the next, leading to the inverse power-law distribution in PDFs. In addition, Hwang & Sung (Reference Hwang and Sung2018) observed a peak near the boundary layer edge (i.e. a relatively high occurrence of tall structures), which is consistent with the modification in the PDF of attached eddies proposed by Perry et al. (Reference Perry, Henbest and Chong1986). Figure 8(a) shows the distributions of
 $n_{attached}^{\ast }$. For the APG TBL (red), there is a region for which
 $n_{attached}^{\ast }$ is inversely proportional to
 $l_{y}$. This region spans
 $l_{y}/\unicode[STIX]{x1D6FF}=0.4{-}0.58$ (
 $l_{y}^{+}=310{-}450$), as shown in the inset of figure 8(a); the best fit of the inverse power law is
 $n_{attached}^{\ast }=0.00255(l_{y}/\unicode[STIX]{x1D6FF})^{-1}$. Figure 8(b) shows the pre-multiplied population density of wall-attached structures
 $(\unicode[STIX]{x1D6EF}=(l_{y}/\unicode[STIX]{x1D6FF})n_{attached}^{\ast })$. The magnitude of
 $\unicode[STIX]{x1D6EF}$ is approximately constant (0.0025 within ±5 % tolerance) over
 $0.4<l_{y}/\unicode[STIX]{x1D6FF}<0.58$ for the APG TBL. Although the lower limit is slightly larger than that previously reported for a ZPG TBL (Hwang & Sung Reference Hwang and Sung2018), a hierarchical distribution of attached
 $u$ clusters is expected to be universal in wall turbulence; Hwang & Sung (Reference Hwang and Sung2019) also observed an inverse-scale population density for the range
 $0.3<l_{y}/\unicode[STIX]{x1D6FF}<0.6$ in turbulent pipe flows with
 $Re_{\unicode[STIX]{x1D70F}}=930$ and 3008. The inverse power law in
 $n_{attached}^{\ast }$ is valid up to before the weighting for
 $\unicode[STIX]{x1D6FF}$-height eddies (Perry et al. Reference Perry, Henbest and Chong1986).
Beyond the upper limit of the inverse power-law region ( $l_{y}/\unicode[STIX]{x1D6FF}>0.6$),
 $n_{attached}^{\ast }$ increases and a peak is observed at
 $l_{y}/\unicode[STIX]{x1D6FF}=0.92$ (
 $l_{y}^{+}=710$) (figure 8a). This behaviour indicates the relative dominance of tall attached structures with size
 $\unicode[STIX]{x1D6FF}$, which is equivalent to the weighting for the large scales to satisfy the velocity-defect law and the presence of low-wavenumber peaks in the energy spectra in the model (Perry et al. Reference Perry, Henbest and Chong1986). The attached structures in the present study exhibit the inverse power law in the range
 $0.32<l_{y}/\unicode[STIX]{x1D6FF}<0.6$ and the peak near
 $l_{y}/\unicode[STIX]{x1D6FF}=0.9$ consistent with the PDF suggested by Perry and co-workers. In addition, the magnitude of the peak for the APG TBL is 1.3 times larger than that for the ZPG TBL, indicating that the APG produces enhanced large-scale structures in the outer region (Harun et al. Reference Harun, Monty, Mathis and Marusic2013; Yoon et al. Reference Yoon, Hwang and Sung2018). In addition, the average volume of attached
 $u$ structures with
 $l_{y}=O(\unicode[STIX]{x1D6FF})$ is higher for the APG TBL by 16 % compared to that for the ZPG TBL. This behaviour is likely to lead to a lower population for the range
 $0.3<l_{y}/\unicode[STIX]{x1D6FF}<0.6$ in the APG TBL. The enhanced population and volume of the tall attached structures have an essential role in the presence of the outer peaks observed in the Reynolds stresses of the APG TBL (see further discussion in §§ 3.2 and 3.3).
As discussed above,  $n_{attached}^{\ast }$ follows the population density of attached eddies as conjectured by Perry & Chong (Reference Perry and Chong1982) and Perry et al. (Reference Perry, Henbest and Chong1986). Thus, we can decompose wall-attached structures into two types based on the height of the attached
 $u$ structures: i.e. type A (
 $100<l_{y}^{+}<0.6\unicode[STIX]{x1D6FF}^{+}$) and type B (
 $l_{y}/\unicode[STIX]{x1D6FF}>0.6$). Note that the present type B structures are physically attached to the wall, whereas the type B eddies in the models are detached (Perry & Marusic Reference Perry and Marusic1995). Although the inverse-scale distribution begins at
 $l_{y}^{+}\approx 250{-}300$, we choose the lower limit of type A as
 $l_{y}^{+}=100$ following the work of Perry & Chong (Reference Perry and Chong1982). The lower limit of the logarithmic region scales with
 $Re_{\unicode[STIX]{x1D70F}}^{\text{1/2}}$ (Wei et al. Reference Wei, Fife, Klewicki and Mcmurtry2005; Marusic et al. Reference Marusic, Monty, Hultmark and Smits2013) and thus it would be better to set the lower limit in terms of
 $Re_{\unicode[STIX]{x1D70F}}^{1/2}$ for high-Reynolds-number flows.
3.1 Self-similarity
We now examine the lengths ( $l_{x}$) and widths (
 $l_{z}$) of the wall-attached
 $u$ structures to determine whether the sizes of the type A and type B structures can be characterized with
 $l_{y}$ and
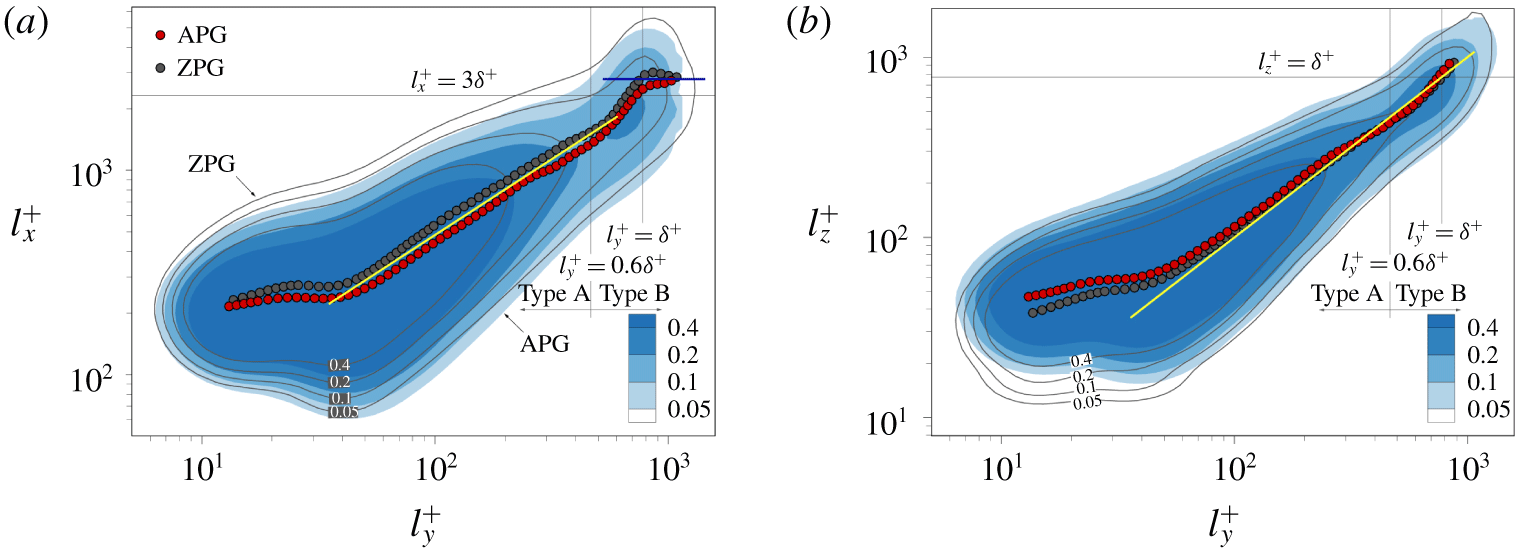
 $\unicode[STIX]{x1D6FF}$, respectively. Figure 9 shows the joint PDFs of
 $l_{x}$ and
 $l_{z}$ of the wall-attached
 $u$ structures with respect to
 $l_{y}$. Here, the contours and lines indicate the distributions for the APG and ZPG TBLs, respectively. The mean
 $l_{x}$ and
 $l_{z}$ at a given
 $l_{y}$ are shown as circles: APG (red) and ZPG (black). In figure 9(a), the mean
 $l_{x}$ of the type A structures (
 $100<l_{y}^{+}<0.6\unicode[STIX]{x1D6FF}^{+}$) scales with
 $l_{y}$, following the power law
 $l_{x}\sim l_{y}^{0.74}$ (yellow solid line). Above
 $l_{y}^{+}>0.6\unicode[STIX]{x1D6FF}^{+}$, the mean
 $l_{x}$ rapidly increases and exhibits a constant value
 $l_{x}^{+}\approx 3.5\unicode[STIX]{x1D6FF}^{+}$ for
 $l_{y}^{+}>\unicode[STIX]{x1D6FF}^{+}$ (blue horizontal line), which indicates that very tall structures (i.e. type B) are non-self-similar (
 $O(3\unicode[STIX]{x1D6FF}{-}6\unicode[STIX]{x1D6FF})$). In addition, there are protrusions in the contours near
 $l_{y}^{+}\approx \unicode[STIX]{x1D6FF}^{+}$, i.e. superstructures or VLSMs. In figure 9(b), a linear relationship is evident between the mean
 $l_{z}$ and
 $l_{y}$ (yellow solid line) from
 $l_{y}^{+}=100$ to
 $l_{y}^{+}=\unicode[STIX]{x1D6FF}^{+}$. In other words, the spanwise length of attached
 $u$ structures (
 $l_{y}^{+}>100$) is proportional to the distance from the wall (Tomkins & Adrian Reference Tomkins and Adrian2003; Del Álamo et al. Reference Del Álamo, Jiménez, Zandonade and Moser2006; Sillero Reference Sillero2014; Hwang Reference Hwang2015; Hwang & Sung Reference Hwang and Sung2018, Reference Hwang and Sung2019). In particular, the width distributions for the APG and ZPG TBLs collapse well, reflecting that the spanwise length scales of the attached
 $u$ structures are not significantly affected by the APG. In sum, type A structures are geometrically self-similar with respect to
 $l_{y}$, whereas the streamwise length of type B motions scales with the outer length scale.
Joint PDFs of (a)  $l_{x}$ and
 $l_{y}$ and of (b)
 $l_{z}$ and
 $l_{y}$. Circles indicate mean lengths. The yellow line in (a) represents
 $l_{x}^{+}\sim (l_{y}^{+})^{0.74}$ and in (b)
 $l_{z}^{+}=l_{y}^{+}$.

3.2 Reynolds stresses
The streamwise Reynolds stresses and the Reynolds shear stresses carried by type A and type B structures are defined as
 $$\begin{eqnarray}\displaystyle & \displaystyle \langle u_{i}u_{j}\rangle _{A}(y)=\frac{1}{mV_{DoI}}\mathop{\sum }_{l_{y}^{+}=100}^{l_{y}/\unicode[STIX]{x1D6FF}=0.6}\iint _{\unicode[STIX]{x1D6FA}_{attached}(l_{y})}u_{i}(\boldsymbol{x})u_{j}(\boldsymbol{x})\,\text{d}x\,\text{d}z, & \displaystyle\end{eqnarray}$$
 $$\begin{eqnarray}\displaystyle & \displaystyle \langle u_{i}u_{j}\rangle _{B}(y)=\frac{1}{mV_{DoI}}\mathop{\sum }_{l_{y}/\unicode[STIX]{x1D6FF}=0.6}^{l_{y}=\unicode[STIX]{x1D6FF}_{y}}\iint _{\unicode[STIX]{x1D6FA}_{attached}(l_{y})}u_{i}(\boldsymbol{x})u_{j}(\boldsymbol{x})\,\text{d}x\,\text{d}z. & \displaystyle\end{eqnarray}$$
Hereafter, subscripts  $A$ and
 $B$ denote averaged quantities of type A and type B structures, respectively. Here,
 $\unicode[STIX]{x1D6FF}_{y}$ (
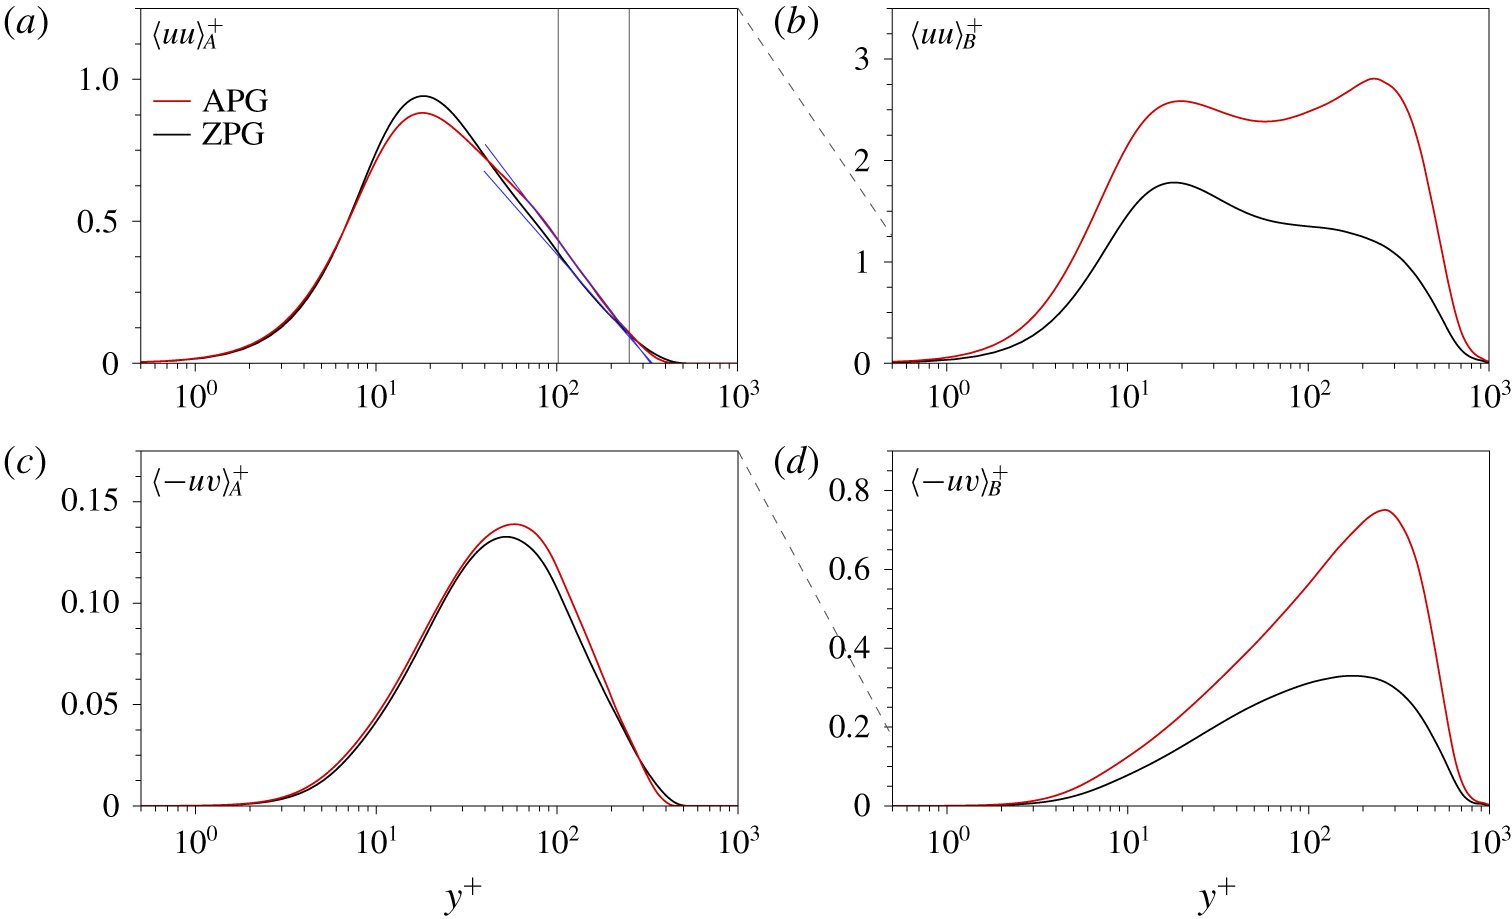
 $=1.7\unicode[STIX]{x1D6FF}$) is the wall-normal size of the DoI. Figure 10(a) shows the wall-normal profiles of
 $\langle uu\rangle _{A}^{+}$ for the APG (red) and ZPG (black) TBLs. Interestingly, both profiles follow the logarithmic profile in the region
 $y^{+}=100{-}0.3\unicode[STIX]{x1D6FF}^{+}$. The attached self-similar structures (
 $100<l_{y}^{+}<0.6\unicode[STIX]{x1D6FF}^{+}$) show the statistical features of type A eddies (Perry & Marusic Reference Perry and Marusic1995). In other words, these structures exhibit universal motion and directly contribute to the presence of the logarithmic region. In contrast,
 $\langle uu\rangle _{B}^{+}$ for the APG TBL is entirely different from that for the ZPG TBL with a distinct outer peak at
 $y^{+}=230$ (figure 10b). The enhanced streamwise Reynolds stress carried by the attached
 $u$ structures (
 $\langle uu\rangle _{attached}^{+}$, shown in figure 7b) in the APG TBL is due to the contribution of the type B structures (
 $l_{y}/\unicode[STIX]{x1D6FF}>0.6$). The magnitude of the outer peak (
 $y^{+}\approx 240$) is greater than that of the inner peak at
 $y^{+}\approx 15$, which reflects the fact that the attached
 $u$ structures with
 $l_{y}/\unicode[STIX]{x1D6FF}>0.6$ are responsible for the wake region. Moreover, there is no logarithmic variation in
 $\langle uu\rangle _{B}^{+}$. Given that the logarithmic variation in the streamwise Reynolds stress is contaminated by very long and wide motions (Jiménez & Hoyas Reference Jiménez and Hoyas2008), the absence of logarithmic variation in figure 10(b) indicates that the tall attached
 $u$ structures are associated with VLSMs or superstructures. In figure 10(c,d), the profiles of
 $\langle -uv\rangle _{A}^{+}$ and
 $\langle -uv\rangle _{B}^{+}$ exhibit behaviours similar to those observed in the streamwise Reynolds stress. The profiles of
 $\langle -uv\rangle _{A}^{+}$ are similar to each other across the wall-normal locations, whereas
 $\langle -uv\rangle _{B}^{+}$ for the APG TBL increases significantly and contains a strong outer peak.
Profiles of (a)  $\langle uu\rangle _{A}^{+}$ and (b)
 $\langle uu\rangle _{B}^{+}$. Profiles of (c)
 $\langle -uv\rangle _{A}^{+}$ and
 $\langle -uv\rangle _{B}^{+}$. The blue lines indicate logarithmic variation in
 $\langle uu\rangle _{i}^{+}$:
 $\langle uu\rangle _{A}^{+}=-0.37\ln (y^{+})+2.12$ over the range
 $y^{+}=100{-}0.3\unicode[STIX]{x1D6FF}^{+}$ for the APG TBL and
 $\langle uu\rangle _{A}^{+}=-0.32\ln (y^{+})+1.84$ over the range
 $y^{+}=100{-}0.3\unicode[STIX]{x1D6FF}^{+}$ for the ZPG TBL. The vertical lines in (a) represent
 $y^{+}=100$ and
 $0.3\unicode[STIX]{x1D6FF}^{+}$.

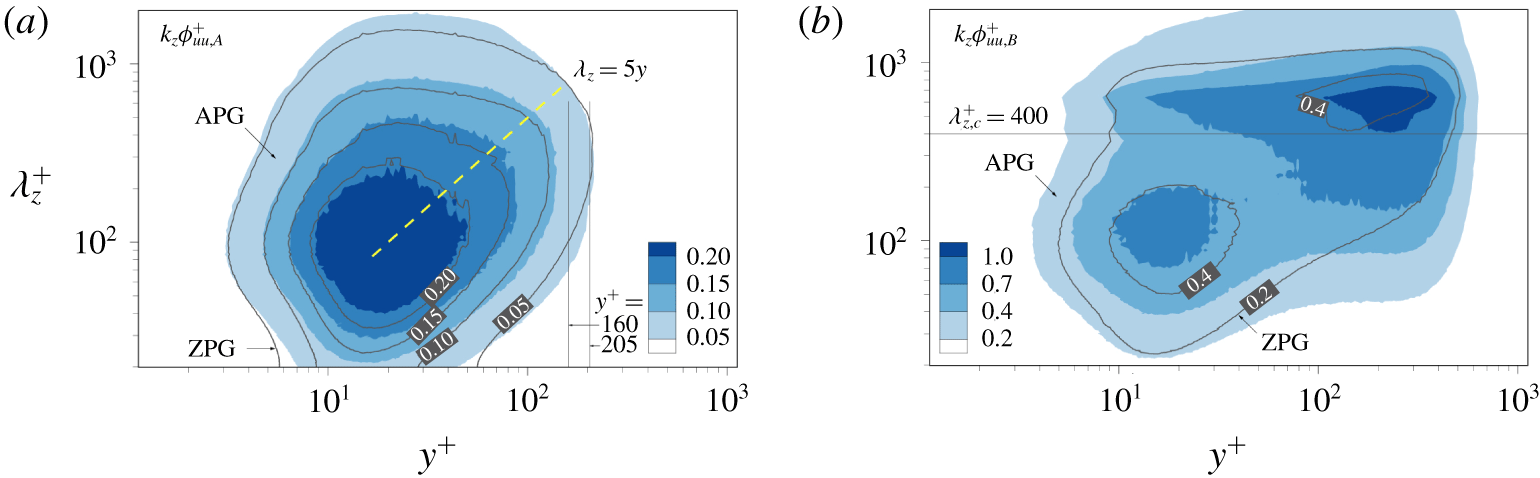
Spectra (a)  $k_{z}\unicode[STIX]{x1D719}_{uu,A}^{+}$ and (b)
 $k_{z}\unicode[STIX]{x1D719}_{uu,B}^{+}$. The colour and line contours are for the APG and ZPG TBLs, respectively. The line contour level is equivalent to the colour contour level. In (a), vertical lines represent
 $y^{+}=160$ and 205, and the yellow dashed line is
 $\unicode[STIX]{x1D706}_{z}=5y$.

3.3 Spanwise spectra
To further examine the streamwise Reynolds stress carried by type A and type B structures, figure 11 shows their pre-multiplied spanwise energy spectra based on conditional velocity fields:
 $$\begin{eqnarray}\displaystyle & \displaystyle u_{A}(\boldsymbol{x},t)=\left\{\begin{array}{@{}l@{}}u,\quad \text{if }|u|>1.5u_{rms},y_{min}^{+}\approx 0\text{ and }100<l_{y}^{+}<0.6\unicode[STIX]{x1D6FF}^{+},\\ 0,\quad \text{otherwise},\end{array}\right. & \displaystyle\end{eqnarray}$$
 $$\begin{eqnarray}\displaystyle & \displaystyle u_{B}(\boldsymbol{x},t)=\left\{\begin{array}{@{}l@{}}u,\quad \text{if }|u|>1.5u_{rms},y_{min}^{+}\approx 0\text{ and }l_{y}/\unicode[STIX]{x1D6FF}>0.6,\\ 0,\quad \text{otherwise}.\end{array}\right. & \displaystyle\end{eqnarray}$$
The spanwise spectra  $\unicode[STIX]{x1D719}_{uu,A}$ and
 $\unicode[STIX]{x1D719}_{uu,B}$ are obtained from the Fourier transform of
 $u_{A}$ and
 $u_{B}$, respectively:
 $$\begin{eqnarray}\unicode[STIX]{x1D719}_{uu,i}(k_{z},y)=\frac{1}{\unicode[STIX]{x1D6FF}_{x}}\int _{-\infty }^{\infty }\text{Re}\{F\hat{F}\}\,\text{d}(x/\unicode[STIX]{x1D6FF}),\end{eqnarray}$$
where  $F$ is the Fourier coefficient of
 $u_{i}(\boldsymbol{x},t)$, Re is the real part of a complex and the caret denotes a complex conjugate. The profiles of
 $\langle uu\rangle _{A}$ and
 $\langle uu\rangle _{B}$ in figure 10(a,b) can be obtained from the integration of pre-multiplied spectra with respect to
 $\ln k_{z}$:
 $\langle uu\rangle _{A}(y)=\int _{-\infty }^{\infty }k_{z}\unicode[STIX]{x1D719}_{uu,A}(k_{z},y)\,\text{d}\ln k_{z}$ and
 $\langle uu\rangle _{B}(y)=\int _{-\infty }^{\infty }k_{z}\unicode[STIX]{x1D719}_{uu,B}(k_{z},y)\,\text{d}\ln k_{z}$, respectively. The spectrum
 $k_{z}\unicode[STIX]{x1D719}_{uu,\,A}(k_{z},y)$ is the distribution of the streamwise Reynolds stress among various spanwise wavelengths contained by type A structures with
 $y<l_{y}$. Note that an individual attached
 $u$ structure with size
 $l_{y}$ contains shorter objects with heights less than
 $l_{y}$ (i.e. nested hierarchies), because the attached
 $u$ structures consist of multiple uniform momentum zones and the streamwise Reynolds stress of the attached structures increases with
 $l_{y}$ along the wall-normal direction (see § 5 in Hwang & Sung (Reference Hwang and Sung2018)). In addition, although the attached-eddy models assume statistically representative structures that possess the gross features of an assemblage of eddies (Perry & Marusic Reference Perry and Marusic1995), we expect an individual
 $u$ structure to contain spanwise wavelengths in the range
 $\unicode[STIX]{x1D706}_{z}\leqslant l_{z}$ (
 ${\approx}l_{y}$; figure 9b), not a single
 $\unicode[STIX]{x1D706}_{z}$ for a given
 $l_{y}$ (Nickels et al. Reference Nickels, Marusic, Hafez, Hutchins and Chong2007). In this sense, if these types of structures satisfy the spectral signature of the attached-eddy hypothesis, then
 $k_{z}\unicode[STIX]{x1D719}_{uu,A}^{+}$ contains a
 $k_{z}^{-1}$ region without peaks in the low-wavenumber range, whereas
 $k_{z}\unicode[STIX]{x1D719}_{uu,B}^{+}$ contains a dominant peak at large scales but no
 $k_{z}^{-1}$ region.
Figure 11(a) shows  $k_{z}\unicode[STIX]{x1D719}_{uu,A}^{+}$ for the APG (colour contour) and ZPG (line contour) TBLs. As this figure shows, the contours of
 $k_{z}\unicode[STIX]{x1D719}_{uu,A}^{+}$ coincide despite the presence of the APG. In the near-wall region,
 $k_{z}\unicode[STIX]{x1D719}_{uu,A}^{+}$ has an inner peak at
 $\unicode[STIX]{x1D706}_{z}^{+}=92$ due to near-wall streaks (Kline et al. Reference Kline, Reynolds, Schraub and Runstadler1967). Since the attached
 $u$ structures are in the form of nested hierarchies, they include small scales in the near-wall region, which results in the inner peak at
 $y^{+}=18$. The spectra
 $k_{z}\unicode[STIX]{x1D719}_{uu,A}^{+}$ are aligned along a linear ridge (
 $\unicode[STIX]{x1D706}_{z}=5y$), representing that the spanwise length scale of type A is proportional to the distance from the wall in spectral space (Hoyas & Jiménez Reference Hoyas and Jiménez2006; Hwang Reference Hwang2015; Chandran et al. Reference Chandran, Baidya, Monty and Marusic2017). Two peaks are evident in both contour maps in figure 11(b), but
 $k_{z}\unicode[STIX]{x1D719}_{uu,B}^{+}$ in the presence of the APG is nevertheless distinctly different from that of the ZPG case. The outer peak is remarkably intense at
 $\unicode[STIX]{x1D706}_{z}^{+}=640$ (
 $\unicode[STIX]{x1D706}_{z}/\unicode[STIX]{x1D6FF}=0.83$) and
 $y^{+}=230$ (
 $y/\unicode[STIX]{x1D6FF}=0.3$). Here, the large and small scales are split according to a cutoff spanwise wavelength of
 $\unicode[STIX]{x1D706}_{z},_{c}^{+}=400$ (
 $\unicode[STIX]{x1D706}_{z},_{c}/\unicode[STIX]{x1D6FF}\approx 0.5$) (Bernardini & Pirozzoli Reference Bernardini and Pirozzoli2011; Hwang & Sung Reference Hwang and Sung2017; Yoon et al. Reference Yoon, Hwang and Sung2018). The footprints of the large-scale energy in the outer region of
 $k_{z}\unicode[STIX]{x1D719}_{uu,B}^{+}$ penetrate into the near-wall region (Hutchins & Marusic Reference Hutchins and Marusic2007a), and outer large scales modulate the amplitudes of small scales (Bernardini & Pirozzoli Reference Bernardini and Pirozzoli2011).
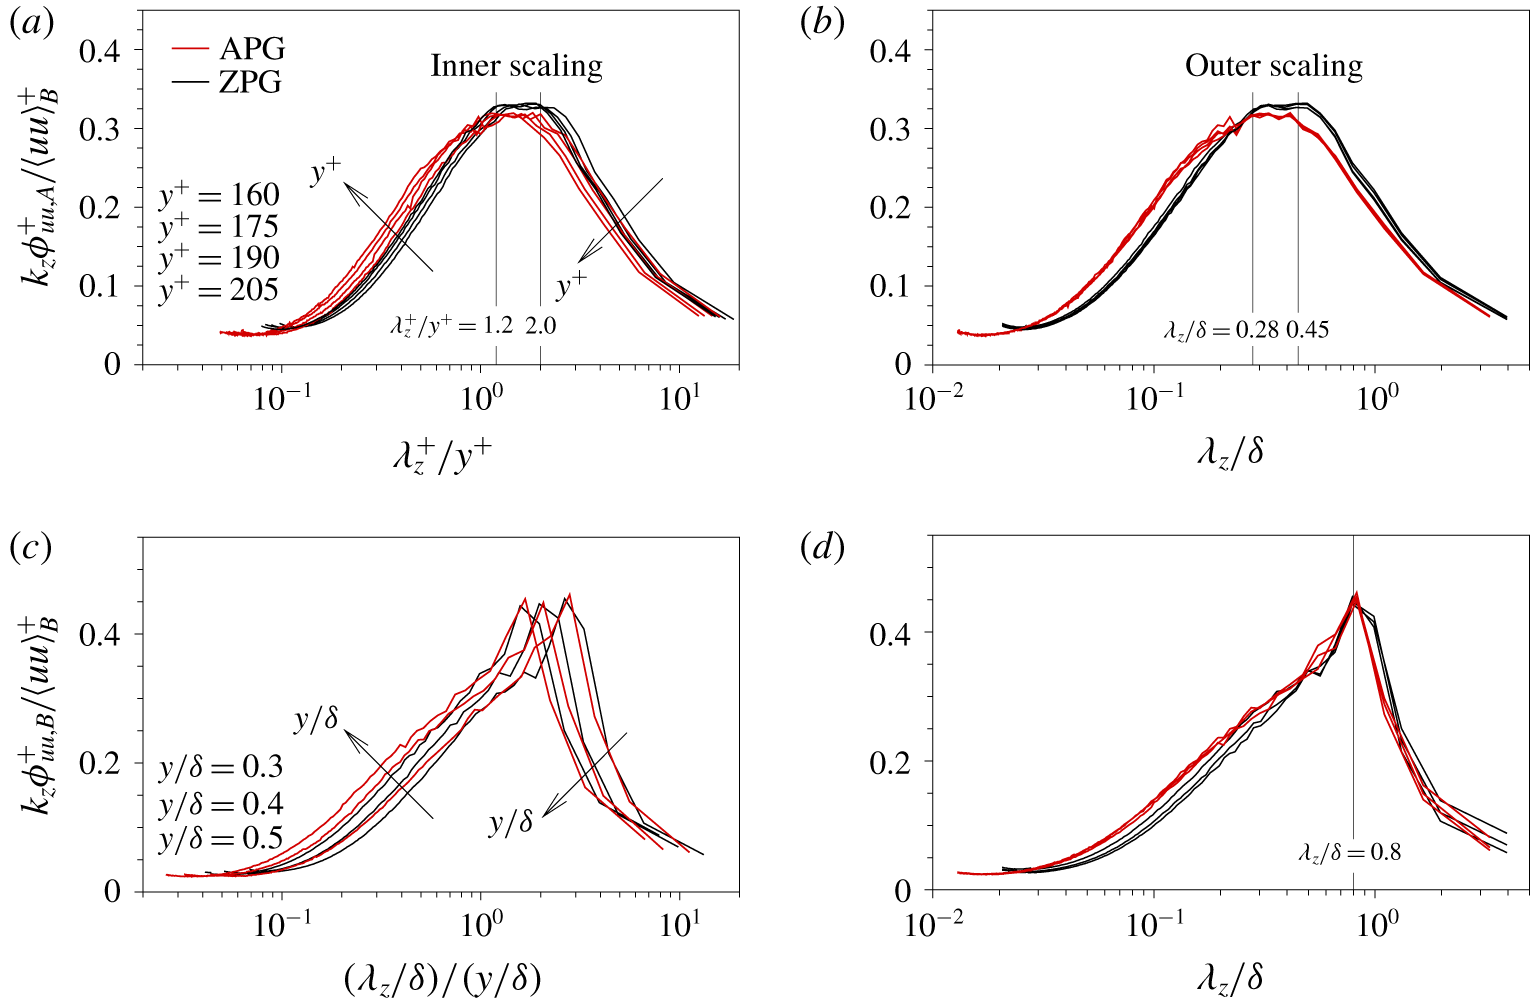
Figure 12(a) shows the profiles of  $k_{z}\unicode[STIX]{x1D719}_{uu,A}^{+}/\langle uu\rangle _{A}^{+}$ with respect to
 $\unicode[STIX]{x1D706}_{z}^{+}/y^{+}$ at four wall-normal locations (
 $y^{+}=160$, 175, 190 and 205), which are chosen in the vicinity of the centre of the logarithmic region of
 $\langle uu\rangle _{A}^{+}$ (figure 10a). The profiles collapse in the region
 $\unicode[STIX]{x1D706}_{z}^{+}/y^{+}=1.2{-}2.0$, where
 $k_{z}\unicode[STIX]{x1D719}_{uu,A}^{+}/\langle uu\rangle _{A}^{+}$ is constant. As for the outer scaling (
 $\unicode[STIX]{x1D706}_{z}/\unicode[STIX]{x1D6FF}$), the profiles in figure 12(b) collapse in a single curve in the region
 $\unicode[STIX]{x1D706}_{z}/\unicode[STIX]{x1D6FF}=0.28{-}0.45$. The
 $k_{z}^{-1}$ region (a plateau) is observed in
 $k_{z}\unicode[STIX]{x1D719}_{uu,A}^{+}/\langle uu\rangle _{A}^{+}$ in the region
 $\unicode[STIX]{x1D706}_{z}^{+}/y^{+}>1.2$ and
 $\unicode[STIX]{x1D706}_{z}/\unicode[STIX]{x1D6FF}<0.45$, where both the inner scaling and outer scaling are simultaneously valid (Perry & Abell Reference Perry and Abell1977; Perry et al. Reference Perry, Henbest and Chong1986; Nickels et al. Reference Nickels, Marusic, Hafez and Chong2005). Note that the
 $k_{x}^{-1}$ or
 $k_{z}^{-1}$ regions do not indicate the spectra collapse over all the range of wavelength. For example, the lower and upper limits of the
 $k_{x}^{-1}$ region are
 $\unicode[STIX]{x1D706}_{x}/y>15.7$ and
 $\unicode[STIX]{x1D706}_{x}/\unicode[STIX]{x1D6FF}<0.3$ (Nickels et al. Reference Nickels, Marusic, Hafez and Chong2005) and
 $\unicode[STIX]{x1D706}_{x}/y>12$ and
 $\unicode[STIX]{x1D706}_{x}/\unicode[STIX]{x1D6FF}<2$ (Hwang Reference Hwang2015). Here,
 $\unicode[STIX]{x1D706}_{x}$ (
 $=2\unicode[STIX]{x03C0}/k_{x}$) is the streamwise wavelength. Given the self-similarity (
 $\unicode[STIX]{x1D706}_{x}\sim 10\unicode[STIX]{x1D706}_{z}$) of the main energy-containing motions in Hwang (Reference Hwang2015), the present
 $k_{z}^{-1}$ region in
 $k_{z}\unicode[STIX]{x1D719}_{uu,A}^{+}/\langle uu\rangle _{A}^{+}$ is in good agreement with previous results. The profiles of
 $k_{z}\unicode[STIX]{x1D719}_{uu,A}^{+}/\langle uu\rangle _{A}^{+}$ exhibit the
 $k_{z}^{-1}$ region, leading to the logarithmic variation in
 $\langle uu\rangle _{A}^{+}$. Baars & Marusic (Reference Baars and Marusic2020b) reported that the logarithmic slope of
 $\langle uu\rangle ^{+}$ reconstructed from type A energy decreases logarithmically with respect to
 $y^{+}$ at lower Reynolds numbers (
 $Re_{\unicode[STIX]{x1D70F}}=O(10^{3})$) but is constant over a certain region at higher Reynolds numbers (
 $Re_{\unicode[STIX]{x1D70F}}>O(10^{4})$). There is a
 $k_{z}^{-1}$ region in
 $k_{z}\unicode[STIX]{x1D719}_{uu,A}^{+}/\langle uu\rangle _{A}^{+}$, which confirms that attached eddies are responsible for the plateau region in the pre-multiplied spectra scaled by both the inner scaling
 $y$ and outer scaling
 $\unicode[STIX]{x1D6FF}$ (Perry et al. Reference Perry, Henbest and Chong1986).
Figure 12(c) shows the profiles of  $k_{z}\unicode[STIX]{x1D719}_{uu,B}^{+}/\langle uu\rangle _{B}^{+}$ at
 $y/\unicode[STIX]{x1D6FF}=0.3$, 0.4 and 0.5 as a function of
 $(\unicode[STIX]{x1D706}_{z}/\unicode[STIX]{x1D6FF})/(y/\unicode[STIX]{x1D6FF})$. As can be seen in this figure, the profiles do not coincide, but the magnitude of the peaks is 0.45 regardless of the pressure gradient. Interestingly, those profiles collapse into a single curve with respect to
 $\unicode[STIX]{x1D706}_{z}/\unicode[STIX]{x1D6FF}$ (figure 12d), which indicates that outer scaling is suitable for type B structures. The peaks converge at
 $\unicode[STIX]{x1D706}_{z}/\unicode[STIX]{x1D6FF}=0.8$, for which the spanwise wavelength motions in type B are the dominant contributors to
 $\langle uu\rangle _{B}^{+}$ in the outer region, and thus there is an outer peak in
 $\langle uu\rangle _{B}^{+}$. In addition, that is equivalent to
 $\unicode[STIX]{x1D706}_{z}$ at the outer peak in
 $k_{z}\unicode[STIX]{x1D719}_{uu}^{+}$ in the APG TBLs with similar
 $\unicode[STIX]{x1D6FD}$ (Kitsios et al. Reference Kitsios, Sekimoto, Atkinson, Sillero, Borrell, Gungor, Jiménez and Soria2017; Lee Reference Lee2017; Yoon et al. Reference Yoon, Hwang and Sung2018), which indicates that type B structures play an important role in the outer region.
Profiles of  $k_{z}\unicode[STIX]{x1D719}_{uu,A}^{+}/\langle uu\rangle _{A}^{+}$ with respect to (a)
 $\unicode[STIX]{x1D706}_{z}^{+}/y^{+}$ and (b)
 $\unicode[STIX]{x1D706}_{z}/\unicode[STIX]{x1D6FF}$ at
 $y^{+}=160$, 175, 190 and 205, and those of
 $k_{z}\unicode[STIX]{x1D719}_{uu,B}^{+}/\langle uu\rangle _{B}^{+}$ as functions of (c)
 $(\unicode[STIX]{x1D706}_{z}/\unicode[STIX]{x1D6FF})/(y/\unicode[STIX]{x1D6FF})$ and (d)
 $\unicode[STIX]{x1D706}_{z}/\unicode[STIX]{x1D6FF}$ at
 $y/\unicode[STIX]{x1D6FF}=0.3$, 0.4 and 0.5.

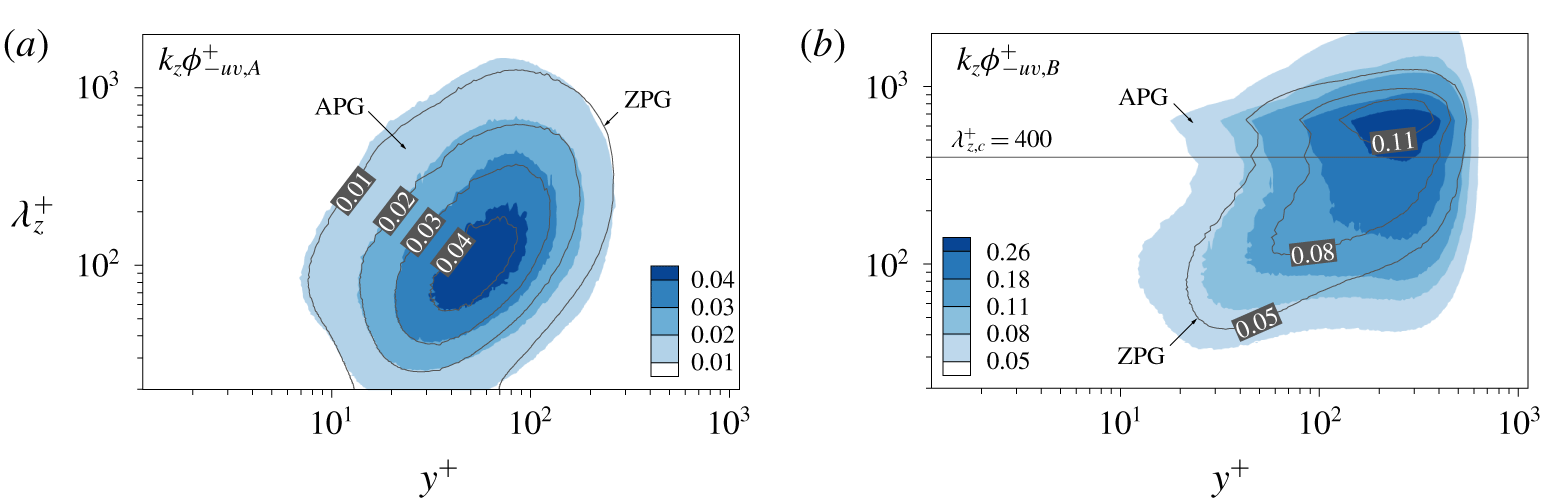
Next, we examine the pre-multiplied spanwise co-spectra of  $\langle -uv\rangle$ carried by type A and type B structures, which can be obtained from (3.4)–(3.6). The spectrum
 $k_{z}\unicode[STIX]{x1D719}_{-uv,A}^{+}$ has an inner peak at
 $\unicode[STIX]{x1D706}_{z}^{+}=100$ and
 $y^{+}=54$, and similar results are obtained for the ZPG TBL (figure 13a). The large scales in the outer region are the main contributors to
 $k_{z}\unicode[STIX]{x1D719}_{-uv,B}^{+}$ as shown by the outer peak at
 $\unicode[STIX]{x1D706}_{z}^{+}=640$ (
 $\unicode[STIX]{x1D706}_{z}/\unicode[STIX]{x1D6FF}=0.83$) and
 $y^{+}=270$ (
 $y/\unicode[STIX]{x1D6FF}=0.35$), which results in an outer peak in the production of turbulent kinetic energy for the APG TBL (Skåre & Krogstad Reference Skåre and Krogstad1994; Lee & Sung Reference Lee and Sung2008; Kitsios et al. Reference Kitsios, Atkinson, Sillero, Borrell, Gungor, Jiménez and Soria2016, Reference Kitsios, Sekimoto, Atkinson, Sillero, Borrell, Gungor, Jiménez and Soria2017) and thus in an increase in large-scale activity in the outer region. As shown in figure 11(b), the long-wavelength energy of
 $k_{z}\unicode[STIX]{x1D719}_{uu,B}^{+}$ in the outer region penetrates into the near-wall region, whereas that of
 $k_{z}\unicode[STIX]{x1D719}_{-uv,B}^{+}$ diminishes near the wall (figure 13b) due to an impermeable wall. This behaviour is equivalent to that reported previously (Jiménez & Hoyas Reference Jiménez and Hoyas2008; Hwang Reference Hwang2015). Hwang (Reference Hwang2015) argued that these inactive motions are the near-wall parts of VLSMs (i.e. the footprint) that contribute negligibly to the Reynolds shear stress in the near-wall region compared to their contributions in the logarithmic region. In other words, the active or inactive characteristics of very large motions depend on their wall-normal locations (Nickels et al. Reference Nickels, Marusic, Hafez, Hutchins and Chong2007).
Spectra (a)  $k_{z}\unicode[STIX]{x1D719}_{-uv,A}^{+}$ and (b)
 $k_{z}\unicode[STIX]{x1D719}_{-uv,B}^{+}$ for the APG and ZPG TBLs.

4 Wall-detached structures
In this section, we examine the detached structures of  $u$. These structures occupy about 35 % of the total volume of
 $u$ clusters (Hwang & Sung Reference Hwang and Sung2018). In addition, the magnitude of
 $\langle uu\rangle _{detached}^{+}$ is lower than that of the ZPG TBL in the region
 $y^{+}<100$, whereas
 $\langle uu\rangle _{detached}^{+}$ for the APG TBL becomes significant in the region
 $y^{+}>100$, as shown in figure 7(b,d). To further explore this difference, we now investigate the sizes and the wall-normal location (
 $y_{c}$) of the detached structures. Here,
 $y_{c}=(y_{min}+y_{max})/2$ is the distance from the centre of the detached structures to the wall. First, the number of wall-detached structures per unit wall-parallel area
 $(n_{detached}^{\ast })$ is given by
 $$\begin{eqnarray}n_{detached}^{\ast }=\frac{n_{detached}(l_{y},y_{c})}{mA_{xz}},\end{eqnarray}$$
where  $n_{detached}$ is the number of detached structures as a function of
 $y_{c}$ and
 $l_{y}$. Note that
 $l_{y}$ of wall-detached structures represents their height and is not related to the wall scaling due to
 $y_{min}>0$. As shown in figure 7(b,d), the magnitudes of
 $\langle uu\rangle _{detached}^{+}$ and
 $\langle -uv\rangle _{detached}^{+}$ are larger in the region
 $y^{+}>100$ for the APG TBL than for the ZPG TBL. Hence, we focus on the detached structures with
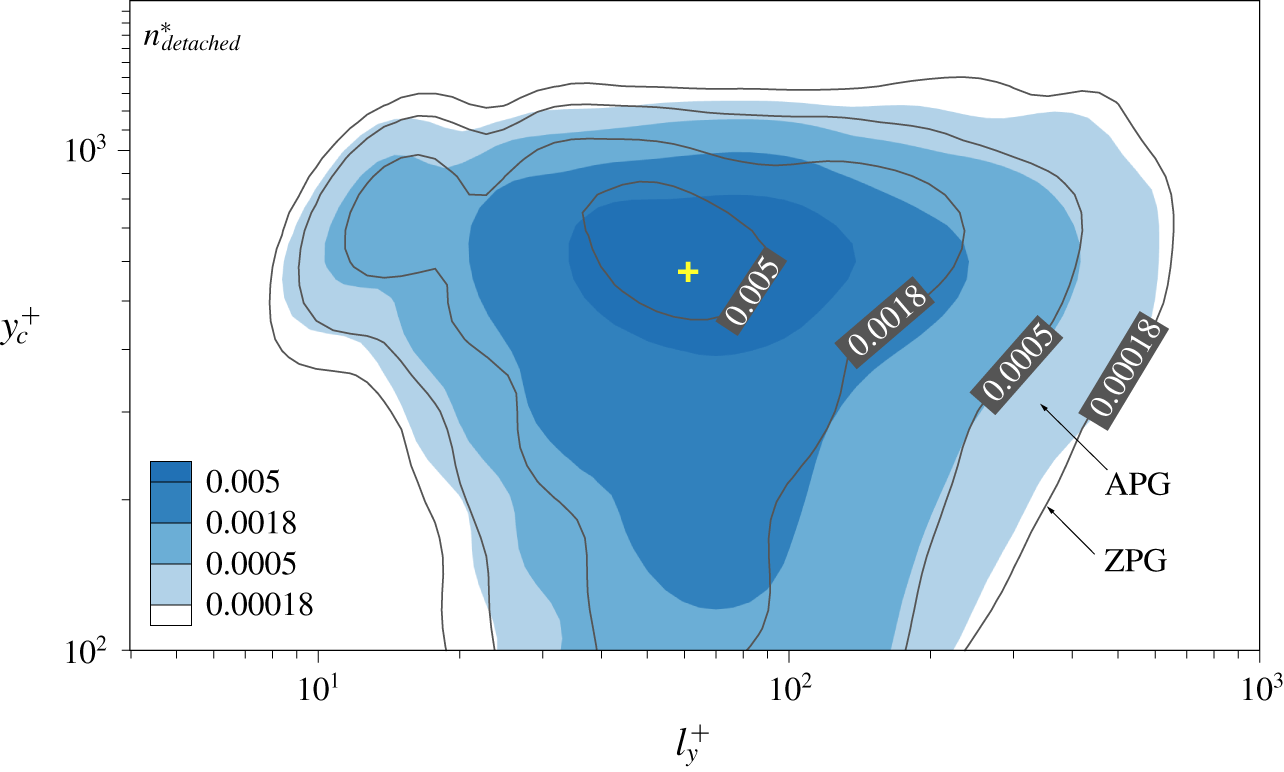
 $y_{c}^{+}>100$. Figure 14 shows
 $n_{detached}^{\ast }$ with respect to
 $l_{y}^{+}$ and
 $y_{c}^{+}$ for the APG (colour contour) and ZPG (line contour) TBLs. As
 $y_{c}^{+}$ increases,
 $n_{detached}^{\ast }$ increases and the range of their height becomes broader from
 $l_{y}^{+}=10$ to
 $l_{y}/\unicode[STIX]{x1D6FF}=0.7$. In addition, a peak is evident at
 $y_{c}^{+}=550$ (
 $y_{c}/\unicode[STIX]{x1D6FF}=0.73$) and
 $l_{y}^{+}=60$, which indicates that the detached
 $u$ structures are dominant in the outer region.
Contour maps of  $n_{detached}^{\ast }$ for the APG (colour) and ZPG (line) TBLs as a function of
 $l_{y}^{+}$ and
 $y_{c}^{+}$.

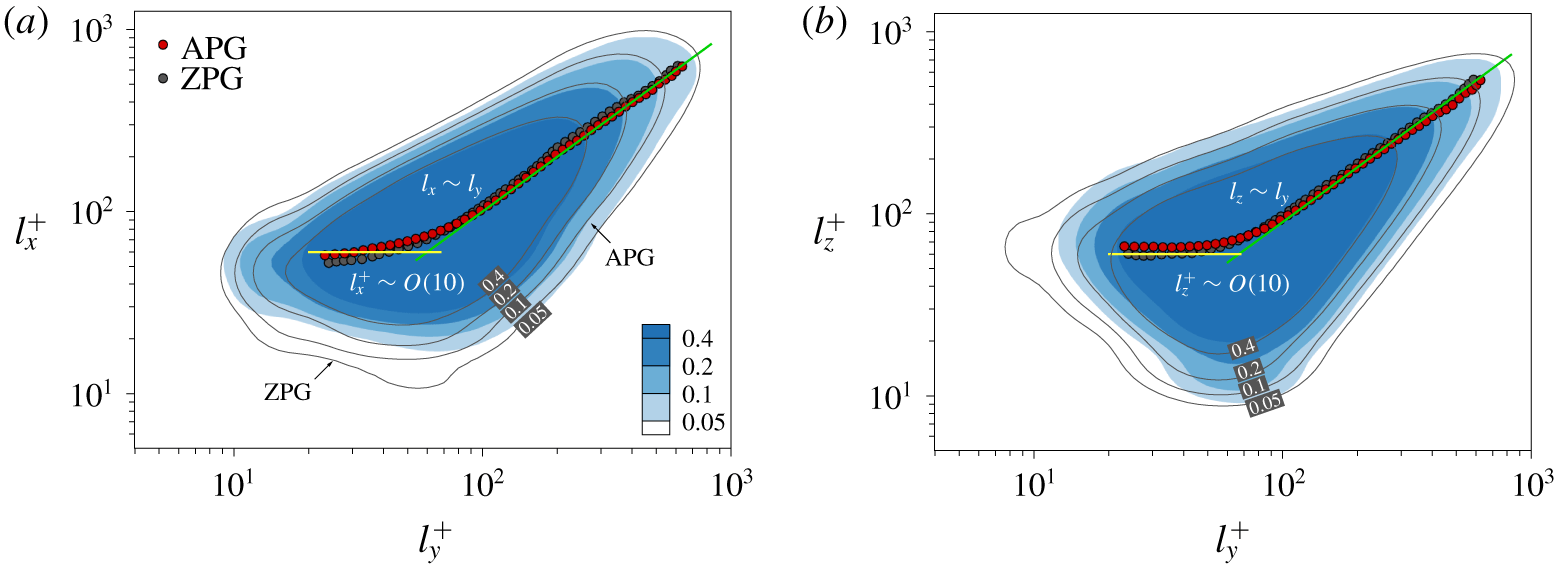
Joint PDFs of (a)  $l_{x}$ and
 $l_{y}$ and of (b)
 $l_{z}$ and
 $l_{y}$ for detached
 $u$ structures. The colour and line contours are for the APG and ZPG TBLs, respectively. The circles are the mean lengths. The green solid lines are
 $l_{x}=l_{y}$ in (a) and
 $l_{z}=0.9l_{y}$ in (b). The yellow lines in (a) and (b) are
 $l_{x}^{+}=60$ and
 $l_{z}^{+}=60$, respectively.

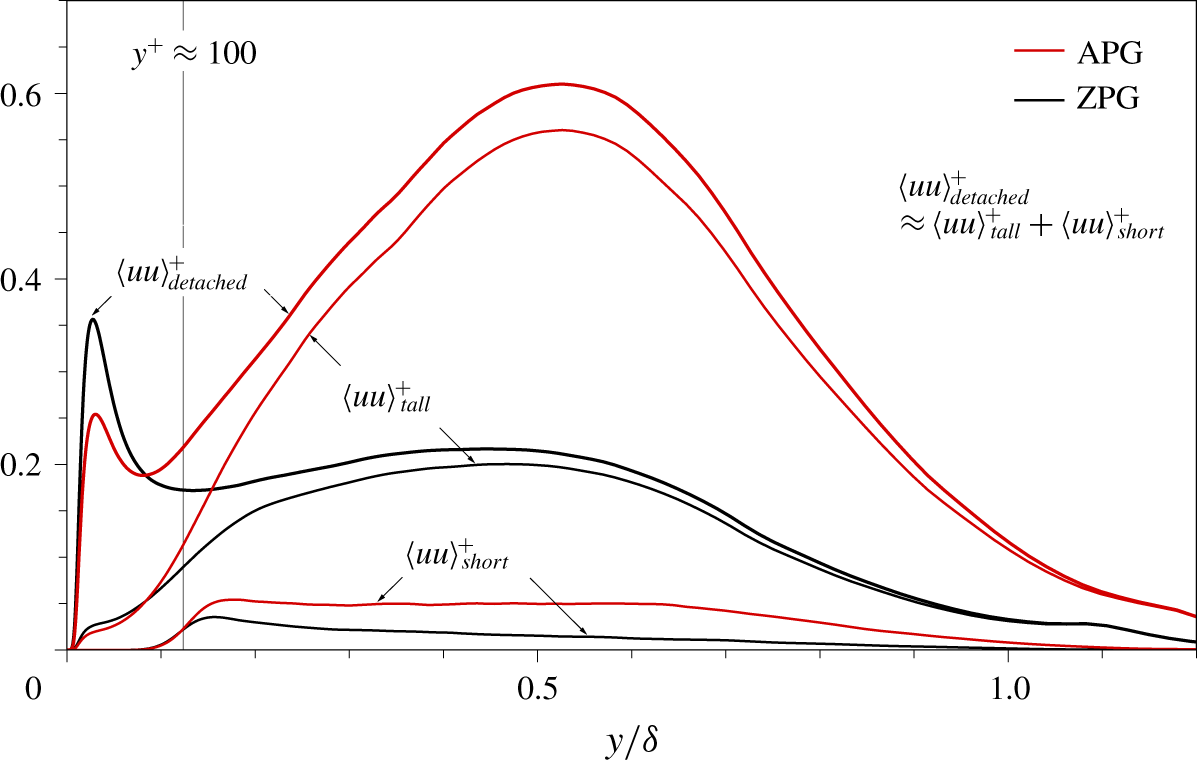
Profiles of  $\langle uu\rangle _{short}^{+},\langle uu\rangle _{tall}^{+}$ and
 $\langle uu\rangle _{detached}^{+}$ for the APG and ZPG TBLs.

Figure 15 shows joint PDFs of  $l_{x}$ and
 $l_{y}$ and of
 $l_{z}$ and
 $l_{y}$ for the detached structures. As can be seen in this figure, the contours of the APG and ZPG TBLs almost coincide. The detached
 $u$ structures can be classified into self-similar and non-self-similar groups. Above
 $l_{y}^{+}$ = 100, the mean
 $l_{x}$ and
 $l_{z}$ (circles) are linearly proportional to
 $l_{y}$. In particular, the aspect ratio of their sizes follows
 $l_{x}\approx l_{y}\approx l_{z}$, which indicates that the tall detached structures (
 $l_{y}^{+}>100$) are geometrically isotropic and self-similar with respect to their height. This result is similar to that for the sizes of detached sweeps and ejections, which follow the ratio
 $l_{x}\approx 1.2l_{y}\approx 1.2l_{z}$ in the APG and ZPG TBLs (Maciel et al. Reference Maciel, Simens and Gungor2017b). Dong et al. (Reference Dong, Lozano-Durán, Sekimoto and Jiménez2017) found that intense ejections and sweeps with diameter larger than
 $50\unicode[STIX]{x1D702}$ are geometrically isotropic in statistically stationary homogeneous shear turbulence, which are similar to the present tall detached structures. Here,
 $\unicode[STIX]{x1D702}$ (
 $=(\unicode[STIX]{x1D708}^{3}/\unicode[STIX]{x1D700})^{1/4}$) is the Kolmogorov length scale, where
 $\unicode[STIX]{x1D700}$ is the dissipation of turbulent kinetic energy. On the other hand, the short detached structures (
 $l_{y}^{+}<100$) follow the yellow solid lines
 $l_{x}^{+}=60$ and
 $l_{z}^{+}=60$ (figure 15). In other words, these motions are not self-similar with respect to
 $l_{y}$. The sizes of the short detached structures are Kolmogorov length scales as
 $l_{x}^{+}=25{-}30\unicode[STIX]{x1D702}^{+}$ and
 $l_{z}^{+}=25{-}30\unicode[STIX]{x1D702}^{+}$, where
 $\unicode[STIX]{x1D702}$ is chosen at the peak location (
 $y_{c}^{+}=550$) of
 $n_{detached}^{\ast }$ (figure 14), i.e.
 $\unicode[STIX]{x1D702}^{+}=2.0$ for the APG TBL and 2.4 for the ZPG TBL. This observation is consistent with the length scales (
 ${\sim}20{-}40\unicode[STIX]{x1D702}$) of detached vortical clusters (Del Álamo et al. Reference Del Álamo, Jiménez, Zandonade and Moser2006) and of detached sweeps and ejections (Lozano-Durán et al. Reference Lozano-Durán, Flores and Jiménez2012). Hence, the short detached
 $u$ structures (
 $l_{y}^{+}<100$) are associated with Kolmogorov-scale motions and are equilateral at a given
 $l_{y}~(l_{x}=l_{z}=25{-}30\unicode[STIX]{x1D702})$. The outer peak (at
 $y_{c}^{+}=550$ and
 $l_{y}^{+}=60$) in the population density (figure 14) is due to those structures.
To examine the contributions of the short and tall detached  $u$ structures to
 $\langle uu\rangle _{detached}$, we compute
 $\langle uu\rangle$ carried by the short (
 $l_{y}^{+}<100$) and tall (
 $l_{y}^{+}>100$) detached
 $u$ structures, which can be defined as
 $$\begin{eqnarray}\displaystyle & \displaystyle \langle uu\rangle _{short}(y) & \displaystyle =\frac{1}{mV_{DoI}}\mathop{\sum }_{l_{y}=0}^{l_{y}^{+}=100}\mathop{\sum }_{y_{c}^{+}=100}^{y_{c}=\unicode[STIX]{x1D6FF}_{y}}\iint _{\unicode[STIX]{x1D6FA}_{detached}(l_{y},y_{c})}u(\boldsymbol{x})u(\boldsymbol{x})\,\text{d}x\,\text{d}z,\end{eqnarray}$$
 $$\begin{eqnarray}\displaystyle & \displaystyle \langle uu\rangle _{tall}(y) & \displaystyle =\frac{1}{mV_{DoI}}\mathop{\sum }_{l_{y}^{+}=100}^{l_{y}=\unicode[STIX]{x1D6FF}_{y}}\mathop{\sum }_{y_{c}^{+}=100}^{y_{c}=\unicode[STIX]{x1D6FF}_{y}}\iint _{\unicode[STIX]{x1D6FA}_{detached}(l_{y},y_{c})}u(\boldsymbol{x})u(\boldsymbol{x})\,\text{d}x\,\text{d}z.\end{eqnarray}$$
Figure 16 shows  $\langle uu\rangle _{short}^{+},\langle uu\rangle _{tall}^{+}$ and
 $\langle uu\rangle _{detached}^{+}$ as functions of
 $y/\unicode[STIX]{x1D6FF}$. The detached
 $u$ structures in the region
 $y_{c}^{+}>100$ are responsible for
 $\langle uu\rangle _{detached}^{+}$ in the region
 $y^{+}>100$. As expected, the tall detached structures contribute 90 % of
 $\langle uu\rangle _{detached}^{+}$ in the region
 $y/\unicode[STIX]{x1D6FF}>0.2$, whereas the short objects account for 10 % of
 $\langle uu\rangle _{detached}^{+}$. The Reynolds shear stresses carried by the short and tall detached
 $u$ structures exhibit similar behaviours to those found for
 $\langle uu\rangle _{short}^{+}$ and
 $\langle uu\rangle _{tall}^{+}$ (not shown here). The magnitude of
 $\langle uu\rangle _{short}^{+}$ is almost constant over
 $y/\unicode[STIX]{x1D6FF}=0.15{-}0.65$ due to a uniform distribution (
 $\unicode[STIX]{x1D706}_{z}^{+}\approx 100$) of the spectra
 $\langle uu\rangle _{short}^{+}$ (not shown here). The tall detached structures scaled by their height are isotropic and geometrically self-similar, and they carry approximately 10 % of total turbulent energy in the outer region despite the presence of detached structures. A peak in
 $\langle uu\rangle _{tall}^{+}$ is observed at
 $y/\unicode[STIX]{x1D6FF}=0.53$, with a magnitude of 26 % of
 $\langle uu\rangle _{B}^{+}$ at that location, which results from an outer peak at
 $y/\unicode[STIX]{x1D6FF}=0.53$ and
 $\unicode[STIX]{x1D706}_{z}/\unicode[STIX]{x1D6FF}=0.47$ in the spectra
 $\langle uu\rangle _{tall}^{+}$ (not shown here).
Perry et al. (Reference Perry, Henbest and Chong1986) proposed that detached eddies originate from the debris of dead attached eddies, which are advected away from the wall and deformed by attached large scales. Lozano-Durán & Jiménez (Reference Lozano-Durán and Jiménez2014) reported that some detached clusters are attached to the wall earlier in their lifetime and the parts of attached clusters wander off by tracking a primary branch (tall attached clusters). Hence, the tall detached structures could be fragments of large-scale attached structures (i.e. type B structures) in the outer region. Their temporal evolution is necessary for validation, which is beyond the scope of the present work. The contribution of the short detached structures to  $\langle uu\rangle ^{+}$ is much smaller than that of
 $\langle uu\rangle _{tall}^{+}$. Since the turbulent kinetic energy is mainly dissipated by small-wavelength motions (Bolotnov et al. Reference Bolotnov, Lahey, Drew, Jansen and Oberai2010; Lee & Moser Reference Lee and Moser2019), the short detached structures with Kolmogorov scales could be related to the dissipation process. Hence, those motions should be considered when we explore the dynamics of
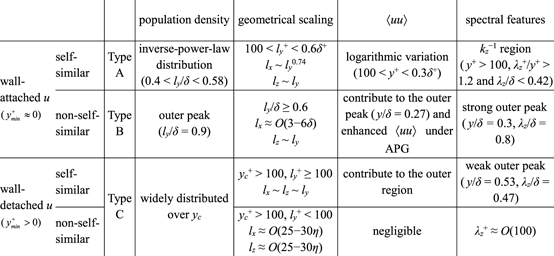
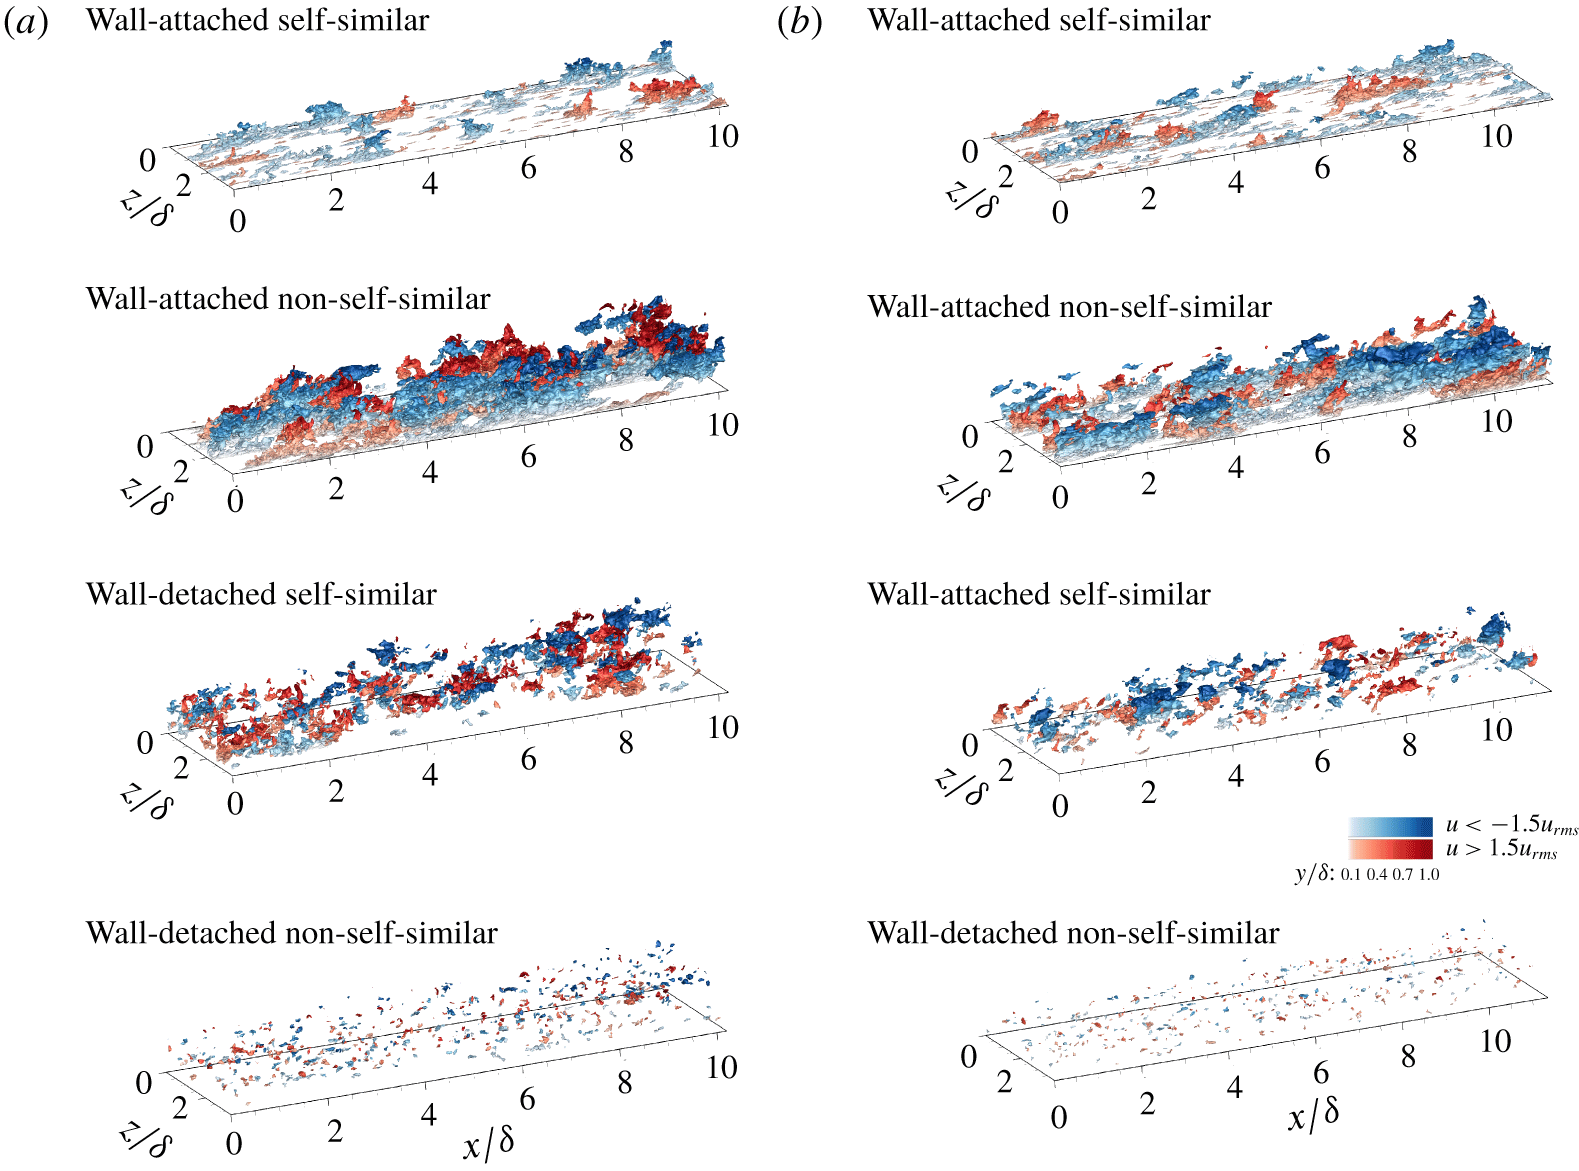
 $u$ clusters to examine multiscale energy cascade in wall turbulence. The main features of wall-attached/wall-detached and self-similar/non-self-similar structures are summarized in table 3. Furthermore, iso-surfaces of the
 $u$ clusters are illustrated in figure 17, where wall-attached non-self-similar and wall-detached self-similar structures are enhanced by the APG, especially in the outer region.
The information of wall-attached/wall-detached and self-similar/non-self-similar structures.

The 3-D iso-surfaces of the  $u$ clusters for (a) the APG TBL and (b) the ZPG TBL.

5 Conclusions
Three-dimensional coherent  $u$ clusters have been explored from the perspective of the attached-eddy model. We extract the
 $u$ clusters using the connectivity of six-orthogonal neighbours in Cartesian coordinates without any assumptions from DNS datasets for APG (
 $\unicode[STIX]{x1D6FD}=1.43$) and ZPG (
 $\unicode[STIX]{x1D6FD}=0$) TBLs with
 $Re_{\unicode[STIX]{x1D70F}}\approx 800$. The identified structures can be decomposed into attached self-similar, attached non-self-similar, detached self-similar and detached non-self-similar structures with respect to
 $y_{min}$ and
 $l_{y}$. The wall-attached structures
 $(y_{min}^{+}\approx 0)$ are the main energy-containing motions in that they carry approximately half of
 $\langle uu\rangle ^{+}$ and
 $\langle -uv\rangle ^{+}$ in the logarithmic and outer regions. The sizes of the attached self-similar structures (
 $100<l_{y}^{+}<0.6\unicode[STIX]{x1D6FF}^{+}$) scale with
 $l_{y}$, and their population density is inversely proportional to
 $l_{y}$ in the region
 $l_{y}/\unicode[STIX]{x1D6FF}=0.4{-}0.58$. They contribute to the logarithmic variation in
 $\langle uu\rangle _{A}^{+}$ and to the presence of the
 $k_{z}^{-1}$ region in
 $k_{z}\unicode[STIX]{x1D719}_{uu,A}^{+}/\langle uu\rangle _{A}^{+}$. The attached self-similar structures are universal wall motions in the logarithmic region that are not dependent on the pressure gradient. The statistical features of the attached self-similar structures in the logarithmic region are equivalent to those of the type A motions in the attached-eddy models of Perry and co-workers. The attached non-self-similar structures (
 $l_{y}/\unicode[STIX]{x1D6FF}>0.6$) are responsible for the enhanced large scales in the outer region in the presence of the APG. Their streamwise sizes are
 $O(3\unicode[STIX]{x1D6FF}{-}6\unicode[STIX]{x1D6FF})$, and some of them extend over
 $6\unicode[STIX]{x1D6FF}$ in the streamwise direction and penetrate deeply into the near-wall region, reminiscent of VLSMs or superstructures. In addition, the attached non-self-similar structures contribute the peak at
 $l_{y}=O(\unicode[STIX]{x1D6FF})$ in their population density, which indicates that they incorporate the characteristics of the tall type A (
 $l_{y}=O(\unicode[STIX]{x1D6FF})$) and type B motions described by Perry and co-workers. The statistical properties of the attached non-self-similar structures demonstrate the relationship between VLSMs or superstructures and type B motions. On the other hand, the detached structures
 $(y_{min}^{+}>0)$ are a subset of the type C motions in the model, which incorporate eddies in the Kolmogorov inertial subrange and dissipation range. The detached self-similar structures (
 $y_{c}^{+}>100$ and
 $l_{y}^{+}>100$) are geometrically isotropic (
 $l_{x}\approx l_{y}\approx l_{z}$) and mainly arise in the outer region, whereas the sizes of the detached non-self-similar structures (
 $y_{c}^{+}>100$ and
 $l_{y}^{+}<100$) scale with the Kolmogorov length scale (
 $l_{x}=l_{z}=25{-}30\unicode[STIX]{x1D702}$). The detached self-similar structures carry approximately a quarter of
 $\langle uu\rangle _{B}^{+}$ in the outer region, which is much larger than the contribution of the detached non-self-similar structures, implying that the detached self-similar structures are remnants of attached non-self-similar structures. The present study classifies coherent
 $u$ clusters into wall-attached/detached and self-similar/non-self-similar structures; these distinctions are found to be in good agreement with those between type A, B and C motions in the attached-eddy model. We have examined the statistical properties of those structures and determined their contributions to
 $\langle uu\rangle ^{+}$ and
 $\langle -uv\rangle ^{+}$ and thus can establish new insights into coherent structures in TBLs and the development of the attached-eddy model.
Acknowledgements
This study was supported by the National Research Foundation of Korea (no. 2019M3C1B7025091) and partially supported by the Supercomputing Center (KISTI).
Declaration of interests
The authors report no conflict of interest.