Introduction
In the late twentieth century, inequality has often been explored through the concept of social exclusion (Byrne, Reference Byrne1999). An important aspect of social exclusion that was often ignored is exclusion from the mainstream economy (Hills et al., Reference Hills, Le Grand and Piachaud2002; Littlewood et al., Reference Littlewood, Glorieux, Herkommer and Jonsson1999). Based on the assumption that exclusion from access to banking services perpetuates poverty, proponents of financial inclusion are advocating for every person to have, at a minimum, a no frills bank account (Conroy, Reference Conroy2008). They argue that access to safe, easy and affordable financial services for the poor, vulnerable groups, disadvantaged areas and production sectors relying on old technologies (such as agricultural) is required for accelerated growth and for reducing income disparities and poverty (Demirgüç-Kunt et al., Reference Demirgüç-Kunt, Beck and Honohan2008). As such, financial inclusion has become a policy priority in many countries (ATISG, 2010; United Nations, 2006).
When announcing 2005 as International Year of Micro-Credit, UN Secretary-General Kofi Annan (Reference Annan2003) noted that: ‘The stark reality is that most poor people in the world still lack access to sustainable financial services, whether it is savings, credit or insurance. The great challenge before us is to address the constraints that exclude people from full participation in the financial sector.’ There is a worldwide search for novel approaches to alleviate poverty that may prove more effective than previous efforts (Chibba, Reference Chibba2009; United Nations, 2006).
Access to affordable finance may enable the poor to undertake economic activities (such as small business loans) and to take advantage of growth opportunities necessary for financial empowerment. It is viewed as a pre-condition for achieving accelerated economic growth as well as for a reduction in income inequality and poverty. As stated by the Rangarajan Commission in India: ‘financial inclusion is considered a prerequisite for empowerment, employment, economic growth, poverty reduction, and social cohesion’ (NABARD, 2009: 32). The sheer breadth of the problem prompted a special United Nations task force to produce a blue book that raised the basic question: ‘why are so many bankable people unbanked?’ (United Nations, 2006: 1). The term unbanked is used to refer to those individuals and households who do not have a bank account.
Financial inclusion is poised to become the new panacea for poverty alleviation, in a manner similar to that of micro-credit and micro-finance some ten to fifteen years ago. Regardless of the early promise of micro-credit and micro-enterprise, it did not lift the very poor out of poverty (Cooney and Shanks, Reference Cooney and Shanks2010). This may also be the fate of financial inclusion. As we will show in this article, financial inclusion is gaining momentum both as a concept and as a policy solution, and, while it can do some good, it is not likely to change the economic fate of the world's poor. Regardless of this, given the recent attention it is receiving, we ought to understand it and assess its feasibility and merit.
Defining and understanding financial exclusion and inclusion
A review of the literature reveals that there is no universal definition of financial inclusion or exclusion. Broadly speaking, financial inclusion means access to finance and financial services for all in a fair, transparent and equitable manner at an affordable cost (Sarma, Reference Sarma2008; Solo, Reference Solo2008). Fuller and Mellor (Reference Fuller and Mellor2008) noted that financial inclusion is the desire to develop ‘alternative’, welfare-oriented (rather than profit-driven), reliable, affordable and accessible financial services for all sections of the population. Others, however, view inclusion as a market-driven solution for poverty alleviation (Alpana, Reference Alpana2007). Financial inclusion is a desired outcome regardless of the motivation behind it as it can help poor people access financial services at a lower cost and reduce the consequences of poverty.
Being a new and evolving concept, financial exclusion is defined in various overlapping manners. It ranges from not having access to a bank account to financial illiteracy. The following quote exemplifies the many forms and reasons for financial exclusion:
The definition of financial exclusion encompasses several dimensions that describe the barriers that prevent some people from using financial services. These barriers include: physical exclusion, caused by the problems of travelling to services; access exclusion, caused by processes of risk assessment; condition exclusion, when the conditions attached to products are unsuitable or unacceptable to consumers; price exclusion, where the price of products is unaffordable; marketing exclusion, where certain consumers are unaware of products due to marketing strategies that target others; and, self exclusion, when people decide to exclude themselves voluntarily on the basis of past rejections or fear that they would be rejected. (Leyshon et al., Reference Leyshon, Signoretta and French2006: 161)
The impact of financial exclusion is not only in terms of lost opportunities. It also means that the cost of financial transactions is significantly higher for those unbanked. For example, Solo (Reference Solo2008) found in Mexico City that financial transactions such as taking a short-term loan cost the unbanked five times more than those who are banked. Often, when the unbanked are paid in cheques, they must travel to the bank where the cheque was drafted, spending time and money, while those who are banked just deposit the cheque (Amaeshi, Reference Amaeshi2006; Mitton, Reference Mitton2008).
In order to understand financial inclusion, we need to distinguish it from other forms of poverty alleviation. Previously, numerous local, regional and national projects and research studies have focused on micro-credit and micro-finance (Robinson, Reference Robinson2001). Other ameliorative efforts have focused on asset building (Sherraden, Reference Sherraden1988; Zhan and Sherraden, Reference Zhan and Sherraden2003). Sadly, evaluation reports suggest that these methods have yielded only modest results, differentially benefit the less poor and often put extreme pressures on women to repay loans that force them to use private money-lenders or recycle loans (Bateman, Reference Bateman2010; Cooney and Shanks, Reference Cooney and Shanks2010; Handy et al., Reference Handy, Moodithaya and Cnaan2009; Honohan, Reference Honohan2004: Montgomery, Reference Montgomery1996; Mosley and Hulme, Reference Mosley and Hulme1998; Rahman, Reference Rahman1999; Todd, Reference Todd1996).
While micro-credit schemes are viewed as an integral part of financial inclusion as they bring saving and borrowing opportunities to marginalised groups, there is an aspect of financial inclusion that they do not cover (Conroy, Reference Conroy2008). Micro-credit schemes are based on a group of neighbours, usually women, who keep each other honest regarding saving and repaying loans. Financial inclusion, however, is mostly geared to the individual household level and does not imply peer relationships. While micro-credit focuses on loans and saving, financial inclusion includes all banking products alongside saving and loans. The Committee for Financial Sector Reforms (Government of India, 2008) noted that over-reliance on credit can lead to dangerous long-term results, including over-indebtedness and wasteful use of scarce resources. Finally, to some extent, micro-credit schemes view the poor as needy and outside the free market, while advocates of financial inclusion sees the poor as regular clients with fewer means. Most importantly, micro-credit can flourish in an environment of financial exclusion. Regardless of the definition of financial exclusion, there are a few reasons why it occurs. In a perfectly competitive market, there are no frictions. It is financially inclusive and facilitates efficient allocation of resources and welfare by providing a range of efficient financial services. The perfect inclusive market system, though theoretically sound, does not exist. Markets are not perfect due to asymmetric information and distortions in terms of availability, accessibility and affordability to all members of the economy. Market exclusion is inherent in an imperfect market due to the inevitability of economic stratification. As a result, access to financial services is often restricted, and market exclusion takes place.
Financial exclusion is also the result of banking deregulation in many advanced democracies and lack of inclusionary banking policies in other countries (Carbó et al., Reference Carbó, Gardner and Molyneux2005). When banks are unregulated, they prefer to cater to wealthy clients that can pay high costs and minimise the number of branches and employees, resulting in increased bank profits and fewer financial services for poorer segments of the population.
Who is financially excluded and why?
Financial inclusion is not randomly distributed. Knowing who is more likely to be excluded is important as it can help the design of financial inclusion programs. Not surprisingly, those with access to financial institutions tend to be males, middle-aged professionals in full-time employment in middle- to high-income groups who have cars, telephones and are home owners (Heimann and Mylenko, Reference Heimann and Mylenko2011). Conversely, those tending to be without are mostly women, the young, the old, the unemployed, those in semi-skilled or manual jobs and those of low socio-economic status (Carbó et al., Reference Carbó, Gardner and Molyneux2005; NABARD, 2008; Solo, Reference Solo2008).
Solo (Reference Solo2008: 48) noted that regarding Mexico and Bolivia, ‘the unbanked in all the countries studied show other characteristics of marginality: lower incomes and lower educational levels than the population at large; and higher representation among minority and immigrant population groups, and among those dependent on the informal sector and living in informal settlements’.
Additional studies have found that people in rural areas or poor neighbourhoods, who are rarely studied, are also less likely to access financial institutions (Carbó et al., Reference Carbó, Gardner and Molyneux2005). The majority of the literature on financial exclusion and inclusion focuses on the urban poor, and we know very little of the level of financial inclusion and exclusion in rural areas.
It is quite possible that some who are unbanked may be so out of preference. These people may mistrust financial institutions, may prefer to deal with cash and to have immediate access to their money, may fear that government will tax their activities or may not want their neighbours to know that they are in possession of money. However, this may more likely apply to people who have the resources necessary for banking rather than the very poor who are often simply excluded.
Measuring financial inclusion/exclusion
There are two key approaches to measuring financial inclusion or exclusion. The first and most popular is to calculate bank accounts (or bank branches) per population (adults or households) (Beck and De la Torre, Reference Beck and De la Torre2006). As Sarma (Reference Sarma2008: 4) noted: ‘As banks are the gateway to the most basic forms of financial services, banking inclusion/exclusion is often used as analogous to financial inclusion/exclusion.’ Although many well-to-do consumers may have more than one account, it is considered a solid estimate of how many people are served by banks. The problem is that this approach is not only ignoring those with many accounts, but also that it does not assess accessibility to other financial services or take into account the experiences and perceptions of those excluded.
The other approach, which avails itself to people's experiences and perceptions, is to survey households in a given area. This method enables researchers to examine accessibility to a wide range of financial services and assess the depth of financial inclusion. This approach is more costly and less often used (Solo, Reference Solo2008).
Financial inclusion in the developed countries
Financial exclusion is a global phenomenon with over two billion people worldwide estimated as being excluded from access to financial services.Footnote 1 While the bulk of the problem is in developing countries, it is also prevalent and acknowledged in developed countries. However, massive inaccessibility to financial institutions is a key difference between developed countries and developing countries (World Bank, 2005). In developed countries, the unbanked are in the minority and they are often unemployed, whereas in developing countries many employed individuals are unbanked.
In several developed countries, the extent of unbanked may reach 10 to 30 per cent of the population (Pratt et al., Reference Pratt, Leyshon and Thrift1996; United Nations, 2006). By 1994, Pratt et al. (Reference Pratt, Leyshon and Thrift1996) found that in the UK 26 per cent of adults were without access to financial services. The socio-characteristics of the financially excluded in the developed world are similar to those of developed countries. Finney and Kempson (Reference Finney and Kempson2009) found that in the UK people who receive their social security payments through post offices are most likely to be unbanked. They noted that financially excluded people tend to be ‘permanently sick or disabled, lone parents, Pakistani or Bangladeshi people and tenants (in both the social and private rented sector)’ (2009: 11). Devlin (Reference Devlin2009) noted low-level education as a key contributor, while living far from cities and financial centers also contributes to financial exclusion (Ford and Rowlingson, Reference Ford and Rowlingson1996; Leyshon and Thrift, Reference Leyshon and Thrift1995). Similar characteristics of the financially excluded were also reported in Australia (Burkett and Drew, Reference Burkett and Drew2008).
In the United Kingdom, Kempson (Reference Kempson1996) found that as need for borrowing arose, those unbanked had little choice but to borrow from home credit companies and other sub-prime lenders at rates of interest that rose regularly to over 200 per cent APR, while those banked were charged 10–20 per cent APR (see also Collard, Reference Collard2007; Mitton, Reference Mitton2008). The cost of being financially unbanked can, thus, be very high, even in developed countries.
In the developed countries, however, the problem of financial exclusion has been tackled mainly on the supply side. Governments have generally intervened in two ways: by enacting statutory instruments that forced practicing banks to serve the poor or through voluntary effort by encouraging institutions to provide affordable banking services without discrimination. In some cases, banks were nationalised when they failed to reach poor and marginalised groups (Kempson, Reference Kempson2006).
In developed countries, such as the UK, attempts to solve financial exclusion included the establishment of Financial Inclusion Funds to support initiatives that paid for accounts of poor people (Byrne, Reference Byrne1999; Collard, Reference Collard2007; Fuller et al., Reference Fuller, Mellor, Dodds and Affleck2006). In France, the 1984 Banking Act made access to a bank account a legal right (Kempson, Reference Kempson2006). In 1992, banks in France signed a charter committing themselves to opening bank accounts at an affordable cost with related payment facilities to all. In Germany, the banking industry has adopted ‘Current Accounts for Everyone’ to provide current accounts on demand (NABARD, 2008). In Canada, legislation entitled ‘Access to Basic Banking Services Regulations’ was enacted in 2003 to ensure all Canadians could open personal bank accounts, and cash most government cheques at no charge.
Karger (Reference Karger2005) found that many poor people in American cities, and especially people of colour, had no access to bank accounts or formal sources of credit and had no alternative but to use the facilities in the grey market where interest rates are very high. Consequently, in the United States, the Community Reinvestment Act (CRA) of 1977 was designed to end redlining (a practice by which banks deny services to residents of designated communities) and discrimination in loans made to individuals and businesses from low- and moderate-income neighbourhoods. The CRA mandates all federally insured banking institutions be evaluated by federal banking agencies to determine if the bank offers services to all people in communities in which they are chartered to do business. The law emphasises that an institution's CRA activities be undertaken in a safe and sound manner, and does not require institutions to make high-risk loans that may bring losses (Kavous, Reference Kavous2006).
In many developing countries, the financially excluded outnumber the financially included. The situation is worse in the least developed countries, particularly in sub-Saharan African and South America, where more than 80 per cent of the population is excluded from the formal financial system (World Bank, 2005).
The key differences regarding financial exclusion between developing and developed countries are the scope of the problem and the nature of interventions undertaken by the state. In developed countries where a minority of residents suffers, state interventions are designed to rectify market inefficiencies. In developing countries where the scope of the problem is greater, state interventions include national plans to transform, modernise and enhance the state economy and welfare of all residents. One example is India, where the state has adopted financial inclusion as an official goal for its citizens.
Financial inclusion in India
In India, the nationalisation of fourteen commercial banks in 1969 was a major landmark in the journey towards mass banking and away from class banking (Thingalaya, Reference Thingalaya2009). Remarkable progress was made in extending banking facilities and mitigating to some extent the regional inequalities in availability of banking services. Thousands of banking centers, some in remote villages, started appearing on the banking map of the country. While institutional innovations in the rural credit delivery system were introduced, the Indian government realised that the banking system had yet to reach a wide section of the population both in rural and urban areas (Government of India, 2008). Mohan (Reference Mohan and Sharma2008) noted that as in many developing countries, the Reserve Bank of India (RBI) focuses not only on inflation but also on growth. Realising that micro-credit failed to provide the expected growth, since 2004 enabling access to the largest number of people has become a top priority for the RBI.
Ramesh and Sahai (Reference Ramesh and Sahai2007: 70) estimated that ‘on an all-India basis, 59 per cent of the adult population in the country has bank accounts. 41 per cent of the population is, therefore, unbanked.’ The Indian Council for Research on International Economic Relations (ICRIER) rated countries according to their levels of financial inclusion and found India to be lagging behind other nations (Sarma, Reference Sarma2008). India was ranked 50 out of the 100 studied countries included, although the bottom two thirds of countries had low inclusion rates. As such, India continues to suffer from a serious case of financial exclusion. In light of these observations and the commitment of the government to extend financial inclusion, the Government of India constituted a Committee on Financial Inclusion in 2006.
In its January 2008 report, the Committee recommended launching a National Rural Financial Inclusion Plan (NRFIP) to provide access to comprehensive financial services, including credit, to at least 50 per cent of the financially excluded rural households by 2012, with the remaining households to be covered by 2015. To achieve these targets, it stipulated that ‘semi-urban and rural branches of commercial banks and RRBs [Regional Rural Banks] should cover a minimum of 250 new cultivator and non-cultivator households per branch per annum’ (NABARD, 2008: 42), which it suggests is the most promising method of poverty alleviation.
Responding to the need for achieving financial inclusion, the bankers have started reaching out to the poor, and some are moving very fast. Even before the deadline, a few have declared the achievement of 100 per cent financial inclusion, adopting the route of ‘no frills’ accounts in the selected districts (Thingalaya, Reference Thingalaya2009). However, many questions remain unclear about the Indian experience of financial inclusion.
Research questions
The above review suggests that while financial inclusion is the newest form of poverty alleviation, much is still unknown about it. Most studies use macro analyses that provide regional or national data on the number of accounts divided by population size. Few have studied the household perspective (Solo, Reference Solo2008) and even fewer have paid attention to households in rural communities. The very few studies on rural populations have tended to focus on only one district and do not provide a comparative vantage point (Ramji, Reference Ramji2009).
Given that banks in India claimed successful comprehensive financial inclusion, we aimed to study the breadth and depth of financial inclusion in rural South India, and this study sheds light on the validity of claims of financial reach and breadth. Further, since the mere opening of bank accounts is not sufficient for inclusive growth, the study identifies barriers in accessing savings, credit and other financial services. We set to study these topics, focusing on the following questions:
1. How many households in the studied villages are financially included and what financial services are available to them?
2. From the perspective of rural villagers, what are the key perceived barriers that prevent financial inclusion?
3. What are the personal characteristics that distinguish the banked from the unbanked?
4. Is there a difference between villages and states or is the picture of financial inclusion in rural India quite uniform?
5. What is the role of micro-credit organisations (self-help groups) in increasing financial inclusion? Do the banked belong to self-help groups?
6. Are there people who are not interested in financial inclusion? What are their reasons?
7. What are the financial unmet needs of rural households in India?
Methods
Procedures
Similar to Solo (Reference Solo2008), we administered household surveys to a sample of rural residents in four states in Southern India: Andhra Pradesh, Karnataka, Kerala and Tamil Nadu. These states were selected because they have a relatively well-developed banking system in comparison to northern India (Thingalaya, Reference Thingalaya2009) and a good concentration of micro-credit outreach, with an estimated two-thirds of micro-credit clients living there (Sinha, Reference Sinha2007). If we found persistent financial exclusion in these states where financial inclusion is expected to be high, then financial exclusion is more than likely to be prevalent elsewhere. We resorted to selecting whole villages, as there are no lists of all people in the state or in a given neighbourhood, and for each state we randomly identified one or two villages and aimed to study every household in those villages. The sample may not be representative of the population, as the chance of getting an atypical village, as was the case in the Tamil Nadu village, is high and cannot be statistically assessed.
Our unit of analysis was a household, which is ‘usually a group of persons, who normally live together and take their meal from a common kitchen, unless the exigencies of work prevent any of them from doing so’ (Government of India, 2007). While we interviewed the person(s) that was at home, we collected data on each family member regarding background characteristics and financial involvement.
In each village, local leaders were recruited to provide legitimacy and a list of every household, which enabled us to reach over 95 per cent inclusion in each of the studied villages. There were no refusals and the missing households were empty upon two visits to the village.
Instrument and data collection
Based on the literature and on our research questions, we composed an eight-page questionnaire that asked about family background; bank access information; income, assets and savings; loans; and expectations of development work by the government.Footnote 2 The questionnaires were written in English by the authors and a team of local experts, (professors, bank workers and community leaders). They were then pre-tested in a village nearby a local university and fine-tuned. All questions were factual and the majority (over 90 per cent) were close-ended. Given that each village/state speaks a different language, the local professors we consulted judged there was a higher chance of errors if we translated the questionnaires than if we used the English version. The interviewers therefore used the English version and conversed with local residents in the language of the villagers’ choice including: Kannada, Malayalam, Tamil, Telugu and Tulu. The interviewers were students, all of whom study in English medium universities and are fluent in English and the local languages. We trained the interviewers to overcome interpretation barriers and to achieve uniformity in data collection.
Once a village was identified, a team of ten local students was recruited, as well as at least one local professor. The students were trained on the interview instruments and schedule by one of the authors in each of the states. Mock interview role-plays were part of the training, which generally lasted a full day (ten hours). On the following days, the students were bussed to the selected village, along with at least one researcher and one professor from the local university who checked for conformity and uniformity of the data collection process. These individuals went with the students to the interview to ensure that protocol was upheld. The completed questionnaires were checked for internal consistency and possible mistakes and corrected the next day through a subsequent visit to the relevant household. On average, an interview lasted 20 minutes, and they were conducted between February and June 2009.
Sample
In all four villages there was a bank in the village (through a weekly visit) or in a nearby larger village. All villagers regularly visited the larger villages where the local market was located. We discussed coverage with the branch managers of the nearest banks and in all cases they knew many families by name and their specific financial situation. As cost of labour in India is reasonably low, banks can afford to hire extra personnel to travel to small villages in rural areas and provide a weekly bank service, a luxury which does not exist where the cost of labour is high. As such, bank employees are familiar with villagers and are eager to open new accounts.
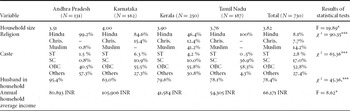
Table 1 shows the demographic characteristics of the sample by states. We found that the average household size is 3.83 persons. In Karnataka, there were more people on average in households (4.0), while in Andhra Pradesh there were the fewest (3.51). Regarding religion, significant differences existed between the villages. In Tamil Nadu and Andhra Pradesh, almost all households were Hindu. In Karnataka, 50 per cent were Christian, while in Kerala about 40 per cent were Muslim and 12 per cent were Christian.
Characteristics of the study participants by State

Notes: *Denotes significant differences at the 0.05 level.
*** Denoted significant differences at the 0.001 level.
Regarding caste, there was great variability between the sites. In Andhra Pradesh, the majority of subjects were members of the upper-level caste (others), while in Tamil Nadu only 4 per cent belonged to this caste. In all cases, less than 5 per cent of villagers were members of the lowest caste – Scheduled Tribe (ST). The majority (three of five) are members of the other backward communities (OBC), a designation of middle-level caste. These differences are statistically significant. Given that rural India is a very traditional environment, we studied the presence of a husband/adult man in the household as a possible explanatory variable for variability in bank accounts. We found statistically significant differences between the sites regarding the presence of a husband/adult man in the household. In Karnataka, only 63 per cent of the families reported a husband living at home, while in Andhra Pradesh the percentage was 95 per cent. What we did not study is whether the missing adult man is dead or away (such as working in construction in a Gulf country). Finally, regarding annual household income, we also found significant differences. Using ANOVA and the Scheffe test reveals that the Karnataka sample was significantly richer than those of Kerala and Tamil Nadu.
Findings
Our first research question dealt with how many households in the studied villages are financially included and what financial services are available to them. We found that the majority of households have access to banks and only 23 per cent reported that no one in the household has a bank account. In 2007, it was estimated that 41 per cent of the population was unbanked (Ramesh and Sahai, Reference Ramesh and Sahai2007; Thorat, Reference Thorat2007), which is perhaps an indication of the success of the financial inclusion initiative. In about half of the households (44 per cent), more than one person has a bank account.
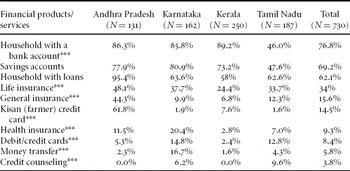
The first question also asked what aspects of financial inclusion are available in the villages. Table 2 lists a set of possible financial services and their use by state. The most accessible financial services are savings accounts (69 per cent) and loans (62 per cent). These are followed by life insurance (34 per cent). The least accessible financial services (less than 10 per cent) are credit cards, money transfer and credit counselling. Again, in the Tamil Nadu village there were lower levels of making bank-related savings and of loans, but higher use of advanced financial services. Higher rates of possessing life and general insurance were noted mostly in the Andhra Pradesh village. These findings suggest that, regardless of the wide coverage of bank accounts, real financial inclusion is far from being reached and is subject to geographical variability.
Use of financial services by State

Notes:*** Denotes significant differences at the 0.001 level.
The second question focused on those barriers to financial inclusion that are perceived as being most salient. To approach this question, we used two methods. First, we asked those without bank accounts to list all the reasons as to why they do not have one. The most commonly reported reasons were: no security to offer (34 per cent), not aware of any bank (25 per cent), no need for bank services (23 per cent), bank is too far away (17 per cent) and not on my mind/did not consider (14 per cent). It was impossible to assess if those uninterested in bank accounts said so because they rationally preferred not to be included or that their abject poverty was so serious that they felt unworthy of such services.
We also asked people if they are comfortable asking banks for a loan. The majority of respondents who did not borrow felt comfortable. Again, the Tamil Nadu village had the highest percentage of people uncomfortable with asking for a loan (28 per cent). For those households, we asked about the reasons for not asking for loans. The top answers were: bank never approached me (53 per cent), lack of information about loans (49 per cent), the bank is too far and offers high interest rates (43 per cent each), bank is unfriendly (35 per cent), readily available local money-lenders (38 per cent), no bus (transportation) (32 per cent) and lack of trust in banks (29 per cent). Clearly, those financially excluded suffer from accessibility barriers and financial illiteracy. Those who do not feel comfortable approaching banks are more suspicious of the banks, in addition to lacking financial literacy.
The third research question focused on personal characteristics that distinguish the banked from the unbanked. We performed a set of bi-variate analyses to be discussed here and later will report the results of a binary-logistic regression.
The presence of an adult male in the house makes little or no difference: among those who are excluded 24 per cent are without an adult male in the household as compared with 23 per cent of those included. Religion, however, was a significant variable in explaining variability in financial exclusion. More Hindus (26 per cent) were excluded as compared to Muslims (14 per cent) and Christians (11 per cent). This difference was statistically significant (χ2 = 11.86, df = 2, p < 0.01). It should be noted that the most poverty-stricken villages in India are usually composed of Hindus.
Caste was also statistically significant (χ2 = 66.2, df = 3, p < 0.001). Surprisingly, the lowest caste (scheduled tribe: ST or Dalit) is actually hardly excluded (13 per cent), almost at the same level as and slightly better than the highest castes (16 per cent). This is most likely due to planned government programs designed to provide preferential treatment to people who are ST and were discriminated against for numerous generations. The second level caste, the scheduled caste (SC), is significantly more financially excluded (58 per cent), followed by the OBC), with 21 per cent of their member households excluded.
Education was also found to explain variability in financial exclusion. Those households with at least one high school graduate (SSLC: Secondary School Leaving Certificate) and higher were significantly less likely to be excluded as compared with those without a member with a similar education (12 per cent and 37 per cent respectively; χ2 = 63.27, df = 1, p < 0.001).
Having certain financial resources also explained variability in exclusion. Those who own land are less likely to be financially excluded as compared with those who do not (21 per cent and 52 per cent respectively; χ2 = 26.65, df = 1, p < 0.001). Similarly, those who own a house are less likely to be excluded as compared to those who lease (21 per cent and 46 per cent respectively, χ2 = 16.63, df = 1, p < 0.001).
From these analyses, we find that caste, religion, education and command of resources were significant in explaining financial inclusion. However, these findings will be further reviewed when we discuss the results of the binary-logistic regression.
The fourth research question focused on differences between villages (and states). The answer to this is predicated on the assumption that the four sites are of similar socio-economic level. However, previous findings suggest otherwise. Table 1 and the sample characteristics show that households in Kerala and Tamil Nadu command the lowest household income. Tamil Nadu and Andhra Pradesh report to be composed entirely of Hindus, while the other two villages contain a minority of Christians and Muslims. In Andhra Pradesh, more than half are members of the ‘others’ (highest caste), while in Tamil Nadu only 4.3 per cent are ‘others’. These differences indicate that the villages are not similar and hence differences in financial inclusion may be attributed to these characteristics rather than location.
We found that the distribution of access to bank accounts was uneven. In three villages, it ranged between 86 per cent and 89 per cent, while in Tamil Nadu it was only 46 per cent. Such differences can be attributed to exclusionary practices by local banks or to the low-income levels. However, Andhra Pradesh, with a similar mean household income, reported 86 per cent financial inclusion. Tamil Nadu reported the lowest rate of family members with beyond high school education (60 per cent), which may explain financial illiteracy, but Andhra Pradesh, which has high financial inclusion, reported 56 per cent of households without a high school graduate.
We also found great variability in the manner by which those who do not use banks explain their exclusion. In Andhra Pradesh, the top reported reason was ‘no need for bank services’. In Karnataka, the top answer was ‘fear of inability to pay’. In Tamil Nadu, it was ‘no security to offer’. In Kerala, it was a combination of ‘too long to get a loan’ and ‘no need for banking services’. As such, the differences between the villages and states are many and are significant but may be the result of characteristics of residents rather than inherent state differences.
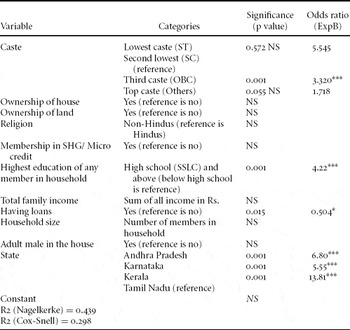
To assess the combination of state/village and characteristics, we performed a binary-logistic regression that included all the above household characteristics and village location. Most variables entered in the model were not statistically significant at the 0.05 level. As seen in Table 3, one significant variable explaining financial inclusion, defined as having a basic bank account, was education. Unlike caste, state and having taken loans, education can serve as a goal for state intervention. If at least one household member has an education level of above high school, the odds of being financially included is significant and 4.22 times greater than households where no-one has achieved high school education. Having loans significantly reduces the chance of being financially included. The majority of those who are members of SHG reported to have loans (81 per cent), while fewer households with non-SHG members reported to have loans (64.5 per cent). Because a small number of households are members of SHG, only 19 per cent of those who have loans are members of SHG. The odds of inclusion of those with loans are half those without loans. It should be noted that many households took loans from self-help groups, money-lenders or from neighbours or relatives but not from banks, which explains why those who took loans are less likely to be financially included. However, it does suggest that for many participation in these forms of financial transactions does not act as a stepping stone to inclusion in more formal financial services.
Binary logistic regression explaining likelihood to be financially included

Notes: NS denotes no significant differences.
* denotes a significant contribution at the 0.05 level.
** denotes a significant contribution at the 0.01 level.
*** denotes a significant contribution at the 0.001 level
Among the four castes, when compared with the second level caste (SC most financially excluded) only the OBC (other backward caste) is significantly different, with the odds of inclusion 3.3 times those of the second level caste. Regarding top caste households (others), they can be socially valued yet financially poor and excluded. Finally, the three villages other than Tamil Nadu had significantly greater chances of being financially included compared to Tamil Nadu. The –2 log likelihood was 440.4 and the Cox-Snell R square was 0.298.
The fifth research question dealt with the role of self-help groups in access to financial inclusion. While it is said that participation in micro-credit groups known as self-help groups (SHG) helps reduce financial exclusion, we found that there was no statistical difference between membership in SHG and banking, as seen in Table 3. In both groups (those who can and those who cannot borrow from SHG), about 23 per cent of households are unbanked. Among the financially included, only about a quarter (26 per cent) listed an SHG as a source through which they became aware of the bank, which was far below a family member (73 per cent) and almost as much as advertisement and bank employees (29 per cent and 26 per cent respectively).
The sixth question assumes that not all people would like to be financially included. Hence, we asked if there are people who are not interested in financial inclusion and for what reasons. Only 52 interviewees (31 per cent) out of the 169 who were financially excluded stated they either do not need bank services and/or had never considered the possibility of banking. We found that having the highest level of education, having a male adult in the house, income, owning land, owning a house, membership in an SHG and religion did not explain the difference between the excluded who are interested or not interested in banking. Among those not interested in banking, more of them are OBC (53 per cent), whereas among those interested in banking, more are SC (47 per cent). However, this difference does not explain why one group is willingly excluded.
Our seventh and final question focused on the unmet financial needs of people in rural India. As noted in Table 2, most households reported to not have debit or credit cards, money transfer services or credit counselling, and less than a third have access to insurance services. These financial options are clearly not available to the majority of studied households. In addition, we asked the respondents about their interest in another set of financial services. About two-thirds of the respondents (65 per cent) wanted general information about the bank. A similar number (58 per cent) asked for help using bank services. These findings suggest that even the so-called banked are quite unaware of what the banks offer, how they practice and how to use them effectively. About half asked for advice in investing savings (47 per cent) and about a fifth asked for assistance in farm-related issues.
Summary and conclusions
In this article, we introduced the concept of financial inclusion as a current policy option for poverty alleviation and assessed its implementation and impact in rural Southern India. Financial inclusion can be conceptually placed in the nexus of social inclusion and poverty alleviation, particularly as a more recent addition to SHG and micro-finance. The logic behind financial inclusion is that poor people who have banking options can save and, if needed, take loans at reasonable rates, as well as access capital for business ventures all at minimal cost. Financial inclusion policies have been implemented in various countries, but our knowledge about their elements and success is quite limited.
Given that the Indian government adopted a policy of financial inclusion that mandated 100 per cent coverage of poor people with no-frills bank accounts, in addition to the fact that many banks claimed to reach this level, we set out to study the coverage, impact and financial needs of poor people in rural Southern India. This is the first study that is household-based, multi-site and rural.
There is still ambiguity regarding what financial inclusion is and how to define it. If we apply the simplistic definition of how many households in a given geographical area are banked, with at least one member of the household having a bank account, then our study shows good coverage. In the four villages we studied combined, three quarters of households are banked. This high rate was lowered by the village in Tamil Nadu where only 46 per cent of the households are banked. This village likely does not represent the state of Tamil Nadu, as it is more poverty stricken than most villages in that state. Yet, it represents many villages of similar socio-economic status throughout India. Put differently, in the case of most villages, bank accounts are becoming the norm, but for the poverty-stricken villages, it is yet to come. This high rate of financial inclusion (77 per cent) is above the reported national standard just two years before the study was carried out and at the time of the Rangarajan Commission report (NABARD, 2008; Ramesh and Sahai, Reference Ramesh and Sahai2007). In 2007, Usha Thorat, Deputy Governor of the Reserve Bank of India, reported ‘that on an all India basis 59 per cent of adult population in the country have bank accounts – in other words 41 per cent of the population is unbanked’ (Thorat, Reference Thorat2007: 2). As such, the campaign for full financial inclusion is quite successful. However, the use of bank accounts per population is a simplistic measure of financial inclusion. The poverty-stricken village in Tamil Nadu reported the lowest rates of bank accounts, yet it also reported higher rates of using advanced banking services among those who are banked. Furthermore, even though three-quarters of studied households are banked, less than 10 per cent reported to know about the availability of investment options. These findings suggest that while access to bank accounts is indeed increasing, financial literacy and advanced use of bank services are lagging. It also suggests that financial inclusion is not a monolithic phenomenon and should be studied in a multi-layered fashion, ranging from being banked to making full use of modern financial instruments.
The fact that a large percentage of the interviewees (65 per cent) noted that they need general information about the bank with which they are associated and its services also indicates that financial inclusion cannot be limited to having a bank account alone. Similarly, studies of financial inclusion should not limit themselves to counting bank accounts as the key parameter for financial inclusion, and governments that are concerned with financial inclusion should demand more in-depth inclusionary practices from participating banks.
Among those unbanked, the majority would like to be banked even though they may have no capital or resources to put up as collateral. In this regard, as Collins et al. (Reference Collins, Morduch, Rutherford and Ruthven2009) showed, poor people are highly concerned with money management. They save, borrow, lend and use money in sophisticated yet informal ways with very high transaction costs and risks. Consequently, many poor people believe that easy access to safe and accessible banking will make their money management efficient and may allow them to deal with irregular income flows and plan for contingencies. As The Economist (2010) noted: ‘The task of smoothing consumption is made more complicated if there is nowhere to store money safely. In an emergency, richer people might choose between dipping into their savings and borrowing. The choice for the great mass of the unbanked in the developing world is limited to whom to borrow from, often at great cost.’
Socio-demographic variables provide insights into who is financially excluded or included. We found that middle-caste people, those who have informal loans, and those with low levels of education are more likely to be financially excluded. It should be noted that low-caste people are experiencing an aggressive governmental campaign of affirmative action. This successful campaign provides them with many opportunities for better jobs and better financial opportunities that members of other castes are not privy to. Education seems to be a key factor influencing financial inclusion worldwide (Amaeshi, Reference Amaeshi2006; Devlin Reference Devlin2009; Mitton, Reference Mitton2008; Solo, Reference Solo2008). Those who take loans do so often from SHG, private money-lenders and/or relatives or friends, and they are not building financial records. In other words, those with the least human and financial capital are likely to be financially excluded.
Surprisingly, membership in SHG aimed at micro-credit was not associated with increased financial inclusion. Loans taken through SHG are registered to the group, and the person taking them is liable to the group, not directly to the bank. It seems that for commercial banks, the poor are still the poor, and regardless of SHG activities, the very poor are not courted by the banks; banks are still catering more to those who have greater resources.
Using the Leyshon, Signoretta and French (Reference Leyshon, Signoretta and French2006) typology of financial inclusion, not having a bank account in our sample was most often the result of self-exclusion and price exclusion. However, when we discuss more advanced types of financial services, the exclusion seems to be marketing exclusion, where certain consumers are unaware of products due to marketing strategies that target others; namely the rich. Physical exclusion, caused by the problems of travelling to services, seems not to be a serious problem in rural South India. With the exception of the isolated village in Tamil Nadu, most financially excluded people did not report physical barriers as the reasons for their being unbanked.
Governments interested in alleviating poverty can develop policies to increase financial inclusion. The Indian model of no-frills accounts enabled many poor households to have access to banks that were before considered for the rich only. Furthermore, the policy to give preferential treatment to the lowest caste (ST) proved successful when measured by levels of basic financial inclusion. The implication is that planned policies can minimise exclusion even for groups that were traditionally socially excluded. As governments license banks and give them permission to make money, they can demand greater financial access to the poor as part of the licensing process. Governments can increase financial inclusion by one of three key ways. First, in countries where few banks are allowed to operate and banks are tightly regulated, government can dictate that banks reach the entire population, as in India. Second, governments can provide banks with incentives such as reduced taxes, approval of new financial products and permission to raise transaction fees. Finally, governments can create an environment conducive to inclusion through mechanisms that reduce bank costs. These may include the formation of insurance programs to underwrite losses, providing space for bank branches in government offices, or linking the distribution of public welfare and/or social security money through accounts opened by banks for the unbanked. But most of all, governments must be focused and committed to financial inclusion and make it a priority that banks cannot ignore.
While in many places people believe that micro-credit self-help groups will alleviate poverty, unfortunately the evidence is not conclusive. This may also be the case for financial inclusion. As the policy of financial inclusion in India is young, our attempt was to assess its implementation rather than to evaluate its longer-term consequences. We doubt if such interventions can modify years of social and economic exclusion and if the very poor can become well-to-do just through bank accounts. However, while we cannot attest to people moving out of poverty due to financial inclusion, it is clear that without bank access monetary services will be far more expensive and that the only beneficiaries are likely to be local money-lenders.