


1. Introduction
The Arctic sea ice has undergone drastic changes in response to climate warming (Reference Comiso, Parkinson, Gersten and StockComiso and others, 2008). The total ice volume shows a clear decreasing trend over the past few decades (Reference Stroeve, Holland, Meier, Scambos and SerrezeStroeve and others, 2007). Studies on Arctic climate change scenarios suggest a warming trend with increasing precipitation (Reference Christensen and SolomonChristensen and others, 2007), which may result in a thicker snow cover on sea ice. The snow affects ice growth by opposing mechanisms. On the one hand, snow acts as a good insulator to prevent ice growth. On the other hand, refreezing of flooded snow and meltwater generates snow ice and superimposed ice, respectively. The variation of snow thickness is of great importance to the ice-thickness distribution. Snow is also one of the major sources of fresh water in the Arctic basin. Understanding processes related to snow on the Arctic sea ice is a challenging task.
In situ measurements of snow thickness and other properties are rare and mostly originate from short-term field campaigns in confined areas. Reference WarrenWarren and others (1999) carried out snow thickness analyses based on snowline data from Russian long-term ice-drift stations in the central Arctic. Temporal variations of snow properties in terms of climatological patterns were derived. Other information is needed to understand spatial variations of snow in the Arctic. Precipitation is the primary source for snow accumulation. No regular in situ measurements on snowfall are carried out over the Arctic sea ice. Precipitation is often measured at coastal weather stations but it is liable to errors due to wind drift (Reference Aleksandrov, Bryazgin, Førland, Radionov and SvyashchennikovAleksandrov and others, 2005). Atmospheric reanalyses and operational products based on numerical weather models provide information on precipitation in the Arctic Ocean and this information is often applied in sea-ice and ocean models. Previous studies have, however, indicated that modelled precipitation over the Arctic Ocean is liable to errors. For example, the widely utilized US National Centers for Environmental Prediction/Atmospheric Research (NCEP/NCAR) reanalysis has a poor accuracy, with a large overestimation of snow water equivalent (Reference SerrezeSerreze and others, 2006; Reference ChengCheng and others, 2008a; Reference Bromwich, Hines and BaiBromwich and others, 2009). The products by the European Centre for Medium-Range Weather Forecasts (ECMWF) have more reasonable values (Reference ChengCheng and others, 2008a; Reference Kwok and CunninghamKwok and Cunningham, 2008; Reference Jakobson and VihmaJakobson and Vihma, 2010).
The large-scale snow thickness in the Arctic can be estimated by analysis of microwave radiometer data. The algorithm for snow thickness on sea ice makes use of the difference in scattering by snow between the 19 and 37 GHz frequencies (Reference Comiso, Cavalieri and MarkusComiso and others, 2003; Reference MarkusMarkus and others, 2006). Currently, there is a snow thickness product based on the Advanced Microwave Scanning Radiometer for Earth Observing System (AMSR-E) radiometer data (12.5km grid size, 5 day running average), which has a good accuracy only for smooth first-year ice.
The Kara Sea is one of the seasonally ice-covered seas located in the Russian Arctic. Operational ice information in the Kara Sea is given by ice charts provided by the Norwegian Meteorological Institute (only ice concentration; see http://polarview.met.no/) and two Russian institutes: the Arctic and Antarctic Research Institute (a public chart available weekly) and SRC Planeta (see http://planet.iitp.ru/english/index_eng.htm). The ice charts are based on analyses of satellite data (e.g. synthetic aperture radar (SAR) images from Envisat).
With increasing activities in the Arctic, due to the operation of oil and gas fields as well as the prolongation of the shipping season and the possible opening of the Northern Sea Route, there is a need for better ice services. A research project has been carried out with a focus on production of high-resolution and user-friendly snow and ice information for the Barents, Pechora and Kara Seas using multisensor satellite data (Reference Mäkynen, Cheng and SimiläMäkynen and others, 2013; Reference Similä, Mäkynen, Cheng and RinneSimilä and others, 2013). New methods have been developed to combine remote-sensing data analysis and numerical sea-ice model simulation to provide ice thickness and concentration information in seasonally ice-covered seas (Reference Karvonen, Cheng and SimiläKarvonen and others, 2007, Reference Karvonen, Cheng, Similä and Hallikainen2008; Reference Similä, Mäkynen, Cheng and RinneSimilä and others, 2013). In these approaches, a thermodynamic sea-ice model is used to calculate the background information of snow and ice thickness.
In this paper, we carry out snow and sea-ice thermodynamic experiments with our HIGHTSI model (one-dimensional (1-D) high-resolution thermodynamic snow and sea-ice model) (Reference Launiainen and ChengLauniainen and Cheng, 1998) in the coastal Kara Sea. The objectives of this study are: (1) to better understand the importance of snow and its effects on the seasonal evolution of sea-ice thickness; (2) to compare different snow parameterizations and identify the best practices to model snow thickness; and (3) to provide thermodynamic ice growth as background information for large-scale ice thickness analyses in the Kara Sea. In the Kara Sea, in situ snow measurements on sea ice are rare, making the modelled snow thickness difficult to validate. To overcome this obstacle, we carried out a number of model experiments with different snow parameterizations, and the modelled ice thickness was then compared with in situ values shown in ice charts by SRC Planeta (Reference TreninaTrenina, 2009). The snow thickness that yields the best ice thickness validation probably best represents the evolution of snow on sea ice in the study area. This hypothesis is based, among other things, on the fact that in a coastal region the heat flux at the ice–ocean interface is small, indicating that the heat loss at the snow surface dominates the ice growth.
2. Study Region and Observations
Seasonal sea ice covers most of the Kara Sea. In the far north, however, multi-year ice floes may be advected from the central Arctic. In the Kara Sea, the ice season lasts for 6–9 months depending on the location and year (Reference JohannessenJohannessen and others, 2007). The growth season for landfast ice lasts for 7 months, from October to April. During April, the fast-ice zone usually reaches the thermal equilibrium stage (no further ice growth). The melting season starts gradually in May and continues through July. Owing to the stronger impact of Siberian continental weather, sea-ice conditions are more severe in the northeastern parts of the Kara Sea (Reference Aleksandrov, Bryazgin, Førland, Radionov and SvyashchennikovAleksandrov and others, 2005). During most of the ice season, snow is present on sea ice (Reference JohannessenJohannessen and others, 2007).
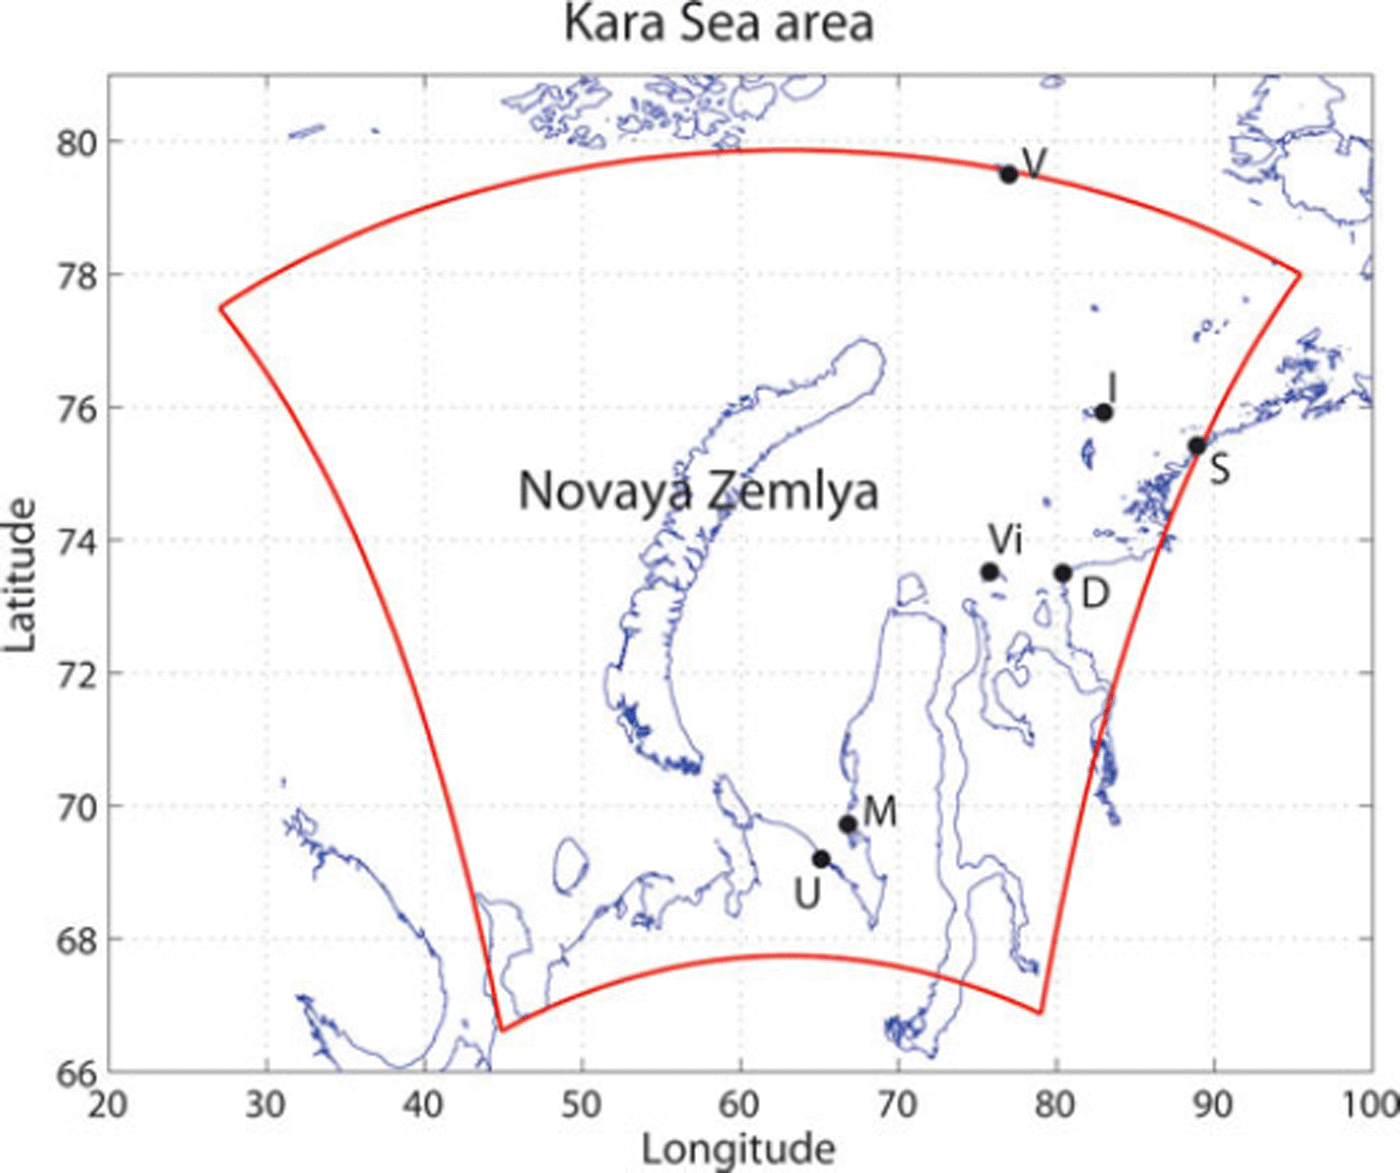
Ice season 2010/11 was selected for this study. The study region is presented in Figure 1. Sea-ice thickness was measured at six locations: Izvestia Tsik, Sterlegova, Vilkistky Dikson Island, Marresale and Ust Kara. The observed ice thicknesses were extracted from the operational SRC Planeta ice charts (http://planet.iitp.ru/english/index_eng.htm; Reference TreninaTrenina, 2009). In situ weather observations, including wind speed and direction as well as air temperature and humidity, were made at Vize Island, Dikson Island and Marresale. Snowfall and total precipitation were measured at Vize Island and Dikson Island.
The Kara Sea study area. The black dots indicate the coastal observation sites: Vize Island (V), Izvestia Tsik (I), Sterlegova (S), Vilkistky (Vi), Dikson Island (D), Marresale (M) and Ust Kara (U). The HIRLAM model domain is marked by the inner black frame.
3. Models Applied
3.1. Numerical weather prediction models
HIGHTSI experiments are driven by the near-surface atmospheric conditions. For this study, the weather forcing was provided by the numerical weather prediction (NWP) High Resolution Limited Area Model (HIRLAM). HIRLAM is a short-range NWP model (Reference UndénUnden and others, 2002), developed by an international consortium of 11 European countries (http://hirlam.org). HIRLAM products were not routinely available over the Arctic Ocean, so we performed dedicated HIRLAM experiments over the research domain (Fig. 1; Reference Mäkynen, Cheng and SimiläMäkynen and others, 2013) during the 2010/11 ice season. The experiments were run with the HIRLAM version 7.3newsnow, which contained improved surface parameterizations, including updated schemes for prediction of snow and ice. Short forecasts with a lead time up to 9 hours were initiälized every 6 hours (0.:00, 06:00, 12:00 and 18:00 UTC). The horizontal resolution of the experiments was 7.5 km and the model had 60 levels in the vertical. Snow depth, sea surface temperature (SST) and ice-cover analyses as well as soil temperature and moisture data assimilation were performed by the method of optimal interpolation, based on SYNOP observations and ECMWF SST/ice-cover analyses. Over the Kara Sea domain, on average seven SYNOP stations, located mainly on the coastline and islands, reported surface weather observations every 3 hours. The HIRLAM upper-air analysis was replaced by an interpolation of the ECMWF analyses, which were also used as lateral boundaries for the HIRLAM experiment.
From the three-dimensional HIRLAM experiments, the diagnostic values of 10 m height wind speed (V ä), 2 m height air temperature (T ä) and relative humidity (Rh) were extracted from the 3 hour forecast values obtained from the HIRLAM lowest model level (at a height of ∼32 m from the surface). The snow precipitation (P snow) as well as downward shortwave (Q s) and longwave (Ql) radiative fluxes were averaged during the first 6 hour forecasts and taken to represent the conditions at the same time as the extracted wind, temperature and humidity. We focus on model experiments for the coastal Kara Sea. All values from HIRLAM gridpoints nearest to the coastal sites (Fig. 1) were obtained and linearly interpolated to 1 hour intervals for the weather forcing of HIGHTSI. Such a procedure leads to some smoothing of the diurnal cycle of the shortwave radiation and temperature, but should be reasonably accurate for the accumulated precipitation.
To study the sensitivity of snow and sea-ice thermodynamics to atmospheric forcing, the weather forcing for HIGHTSI was also extracted from the ECMWF operational analyses and short-range forecasts. Previous studies have indicated that the ECMWF products are of comparatively high quality at high latitudes (Reference ChengCheng and others, 2008a; Reference Bromwich, Hines and BaiBromwich and others, 2009; Reference Jakobson, Vihma, Palo, Jakobson, Keernik and JaagusJakobson and others, 2012). The ECMWF analyses were available with 6hour intervals for Va (10 m), Ta (2m) and Rh (2m). The downward Qs and Ql were based on 12 hour operational forecasts. Precipitation was based on 24 hour forecasts to avoid spin-up problems (Reference Tietäväinen and VihmaTietavainen and Vihma, 2008). HIGHTSI results based on ECMWF and HIRLAM forcing are compared in Section 4.
The overall validation of HIRLAM Tä, Va and Rh against the data from the Kara Sea coastal weather stations for winter 2010/11 is presented by Reference Mäkynen, Cheng and SimiläMäkynen and others (2013). We made comparisons between HIRLAM and ECMWF products. The HIRLAM and ECMWF results are close to each other, in particular Ta and Vä. The radiative fluxes showed less agreement. HIRLAM suggested larger diurnal variation of Qs than ECMWF, but the timing of peak values agreed well. The temporal variations of Ql were larger in HIRLAM than in ECMWF. Note that HIRLAM radiation fluxes represent 6hour averages while 12 hour averages were applied from ECMWF.
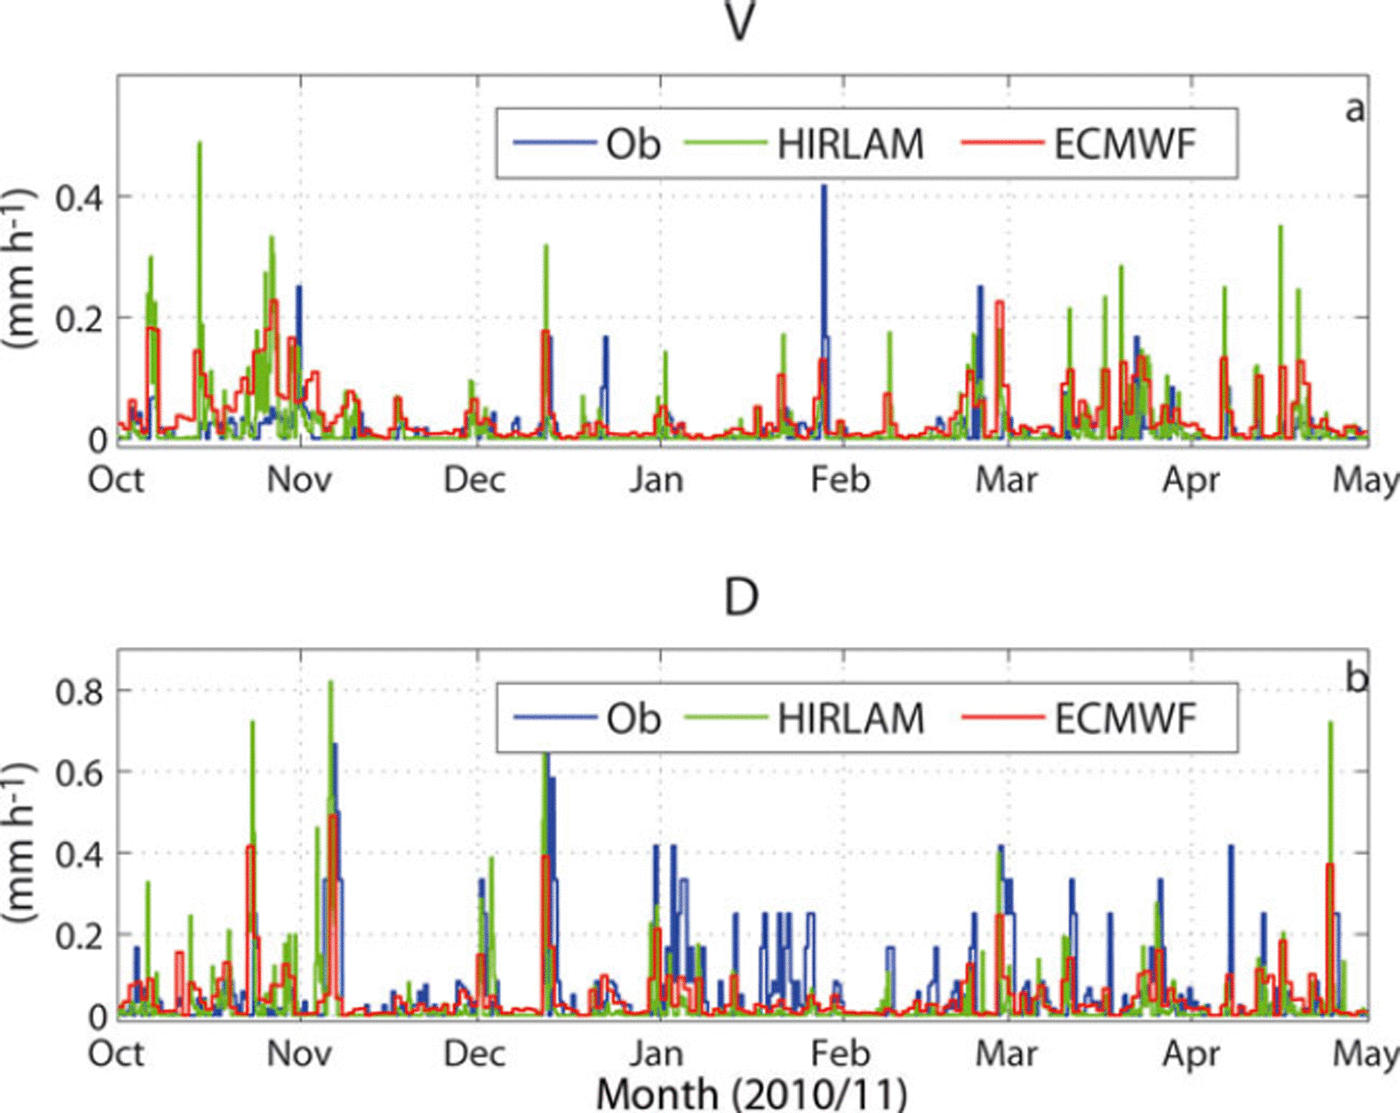
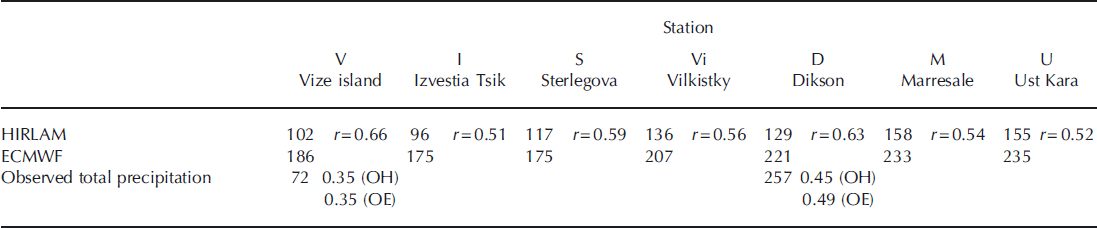
The in situ observed precipitations are available at Vize Island and Dikson Island. A comparison of the HIRLAM and ECMWF daily accumulated snow precipitation against observations is shown in Figure 2. At Vize Island, HIRLAM produced more precipitation in early winter, while at Dikson Island HIRLAM showed less precipitation in midwinter. HIRLAM and ECMWF distinguished between total and snow precipitation, but in the conditions of the Kara Sea the precipitation was almost entirely snow. The observed total precipitation at Vize Island and Dikson Island was 72 and 257 mm snow water equivalent (SWE), respectively, whereas the corresponding HIRLAM/ECMWF values were 102/186 and 129/221 mm, respectively. In general, precipitation was larger in the ECMWF than the HIRLAM results, but the daily amount of precipitation correlated reasonably well between the models (Table 1). However, the correlations between the modelled and observed daily precipitation were weak.
Comparison of observed and modelled precipitation at two weather stations: (a) Vize Island (V) and (b) Dikson Island (D).
Accumulated snow precipitation (mm) according to HIRLAM and ECMWF models and observations at the end of April. The correlation coefficient is denoted by r; OH refers to its value between observations and HIRLAM on a daily basis, and OE between observations and ECMWF on a daily basis
3.2. The HIGHTSI model
The snow and ice thicknesses were simulated applying the HIGHTSI model, which has been applied widely to investigate snow and ice thermodynamics over oceans (Reference Launiainen and ChengLauniainen and Cheng, 1998; Reference Vihma, Uotila, Cheng and LauniainenVihma and others, 2002; Reference ChengCheng and others, 2008a) and lakes (Reference Semmler, Cheng, Yang and RontuSemmler and others, 2012; Reference Yang, Leppäranta, Cheng and LiYang and others, 2012).
The snow or ice surface temperature is solved from a surface heat-balance equation. The shortwave and longwave radiative fluxes can either be parameterized or prescribed based on results of NWP models. The turbulent surface fluxes are parameterized taking the thermal stratification into account (Reference LauniainenLauniainen, 1995). The penetration of solar radiation into the snow and ice is parameterized, making the model capable of quantitatively calculating subsurface melting (Reference Cheng, Launiainen and VihmaCheng and others, 2003). The surface albedo is parameterized according to surface and melting temperatures, snow and ice thickness, solar zenith angle and atmospheric properties (Reference BrieglebBriegleb and others, 2004). The heat and mass balance at the ice bottom serve as the lower boundary conditions of the model. Ice and snow thickness and temperature regime are simulated, solving the heat conduction equation for multiple ice and snow layers. The thermal conductivity of sea ice is parameterized according to Reference Pringle, Eicken, Trodahl and BackstromPringle and others (2007). In HIGHTSI, snow thickness is modelled taking into account the following processes: snowfall, snow surface and internal melting (Reference Launiainen and ChengLauniainen and Cheng, 1998), as well as the formation of snow ice (Reference SalorantaSaloranta, 2000) and superimposed ice (Reference Cheng, Launiainen and VihmaCheng and others, 2003, Reference Cheng, Vihma, Pirazzini and Granskog2006). The precipitation is taken from in situ observations or an NWP model. Changes in snow density due to ageing and compression are calculated according to Reference AndersonAnderson (1976). The snow heat conductivity is parameterized according to Reference Sturm, Holmgren, König and MorrisSturm and others (1997, Reference Sturm, Perovich and Holmgren2002) and Reference Semmler, Cheng, Yang and RontuSemmler and others (2012). A detailed description of HIGHTSI can be found in Reference Cheng and LauniainenCheng and Launiainen (1998) and Reference Cheng, Launiainen and VihmaCheng and others (2003, Reference Cheng2008a).
3.3. Snow parameterizations
Various snow parameterization schemes applied in this study are summarized in Table 2. Snow-free ice (S1) is the simplest consideration. An empirical relation between snow and ice thickness for the Arctic Ocean (Reference Doronin and BorisenkovDoronin and Borisenkov, 1971) has been used to estimate Arctic sea-ice thickness from satellite thermal imagery (Reference Yu and RothrockYu and Rothrock, 1996; Reference Wang, Key and LiuWang and others, 2010). Reference Mäkynen, Cheng and SimiläMäkynen and others (2013) slightly modified this scheme based on data from the Kara Sea obtained from the airborne Sever Expeditions (Reference Cavalieri and Markus Tand ComisoCavalieri and others, 2004) and created a new snow parameterization (S2): for thin ice (<20cm), the snow thickness parameterization is the same as in Reference Doronin and BorisenkovDoronin and Borisenkov (1971), whereas for thicker ice (>20cm), the snow thickness on sea ice is 10% less than that proposed by Reference Doronin and BorisenkovDoronin and Borisenkov (1971).
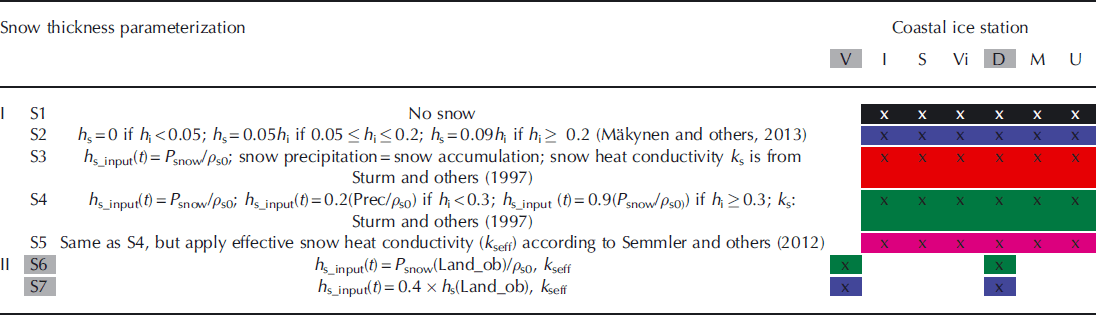
When precipitation is applied as external forcing for snow thickness, one has to convert the SWE value to snow thickness. The NWP snow precipitation (P snow) is usually expressed as kgm−2 or mm per unit time (hours). Following Reference Huwald, Tremblay and BlatterHuwald and others (2005), we used a snow density ps0 = 320kgm−3 in the conversion. Accordingly, at each time-step, the snow accumulation is given as hs_in(t) = Psnow/ps0 in metres, when the total snow precipitation is converted into snow accumulation (S3).
In the coastal Kara Sea in early winter, the wind is often strong (Reference Aleksandrov, Bryazgin, Førland, Radionov and SvyashchennikovAleksandrov and others, 2005). On the basis of in situ observations, the swell, waves and strong winds frequently break the ice before the thickness reaches 0.3 m (Reference JohannessenJohannessen and others, 2007). A large portion of precipitation could be lost to open water (mostly leads and coastal polynyas). As a first-order approximation, we propose such a snow parameterization (S4) that when the ice thickness is <0.3 m, 20% of P snow is added to snow thickness accumulation and 80% of P snow contributes to the ice growth via snow-ice formation by refreezing of slush (Reference SalorantaSaloranta, 2000; Reference ChengCheng and others, 2008a; Reference Semmler, Cheng, Yang and RontuSemmler and others, 2012). When the total ice thickness is >0.3 m, 90% of P snow is added to the snow growth and 10% of P snow is accounted for as the loss of drifting snow.
In this study, a HIRLAM model gridcell has an area of ∼56 km2 (7.5 km × 7.5 km). In such a large area, even for the landfast ice, the ice topography may be inhomogeneous due to the refreezing of thin broken ice in early winter (Reference JohannessenJohannessen and others, 2007). Additionally, owing to strong winds, the spatial distribution of snow is highly heterogeneous, especially when the snow thickness is <0.4m (Reference Sturm, Perovich and HolmgrenSturm and others, 2002). As a result, the overall thermal effect of snow cannot be described by a single value of heat conductivity. In reality, even over a small area, in situ observations indicate large variations in the snowpack properties (Reference Vihma, Mattila, Pirazzini and JohanssonVihma and others, 2011). Accordingly, the effective snow heat conductivity (Reference Semmler, Cheng, Yang and RontuSemmler and others, 2012) is applied to improve the snow parameterization (S5). This variable implicitly takes into account that when snow is thin its insulation effect gives a limited impact on the ice growth in a unit area.
However, a direct application of hs _in (t) as model input for snow accumulation may sometimes result in an unrealistic snow and ice thickness, especially early in the season. The corrections for snow precipitation and parameterization of snowdrift need to be considered to improve the modelled snow thickness and temperature profiles (Reference Ebert and CurryEbert and Curry, 1993; Reference Jordan, Andreas and MakshtasJordan and others, 1999). The wind strongly affects snow redistribution and accumulation (Reference Leonard and MaksymLeonard and Maksym, 2011). A climatological data analysis has indicated that, even on land, in early winter the correlation between observed precipitation and actual snow accumulation is poor, with less than half of the precipitation contributing to the snow growth. In midwinter, however, 94% of precipitation contributes to snow accumulation (Reference Yang, Leppäranta, Cheng and LiYang and others, 2012). Two stations (Vize Island, Dikson Island) have measured snow precipitation, and those data are naturally used as model input (S6).
In many instances, sea-ice models apply a prescribed climatological snow growth (Reference Maykut and UntersteinerMaykut and Untersteiner, 1971) or fixed snowfall scenarios inferred from snow thickness observations (Reference Duguay, Flato, Jeffries, Ménard, Rouse and MorrisDuguay and others, 2003). According to Reference KärkäsKarkas (2000), in the boreal zone the seasonal snow on land is climatologically ∼2.3 times thicker than snow on lake ice. This ratio increases to 2.7 for Arctic lake conditions (personal communication from Y. Reference Yang, Leppäranta, Cheng and LiYang, 2012). We therefore carry out model experiments applying a portion of the observed snow thickness on land as model input (S7).
4. Model Experiments and Results
The HIGHTSI experiments were carried out at each gridcell of the domain shown in Figure 1. Each model run started on 1 October 2010 and lasted until 30 April 2011. The experiments were initialized with a thin ice layer (0.01 m) at each gridcell. If the external weather data did not favour ice growth, HIGHTSI resumed the initial ice thickness. The daily sea-ice concentration was extracted from a Polar View AMSR-E-based ice concentration product with a 6.25 km resolution (Reference Spreen, Kaleschke and HeygsterSpreen and others, 2008). The seasonal variation of oceanic heat flux in the Arctic Ocean is large, depending on many factors (Reference Perovich and ElderPerovich and Elder, 2002). Since our simulations do not cover the melting season, the oceanic heat flux was assumed to increase from 1 to 8Wm–2 when ice concentration decreases from 100% to 20%. With increasing ice cover, HIGHTSI was finally applied over the whole Kara Sea domain and the results were used as background information for an ice thickness retrieval based on remote-sensing data (Reference Similä, Mäkynen, Cheng and RinneSimilä and others, 2013). Table 2 summarizes the model experiments applying different snow parameterizations.
The modelled ice thicknesses (Hi) applying different snow thickness parameterizations are shown in Figure 3. For clarity, we only show Hi results based on the HIRLAM forcing. At all observation sites, Hi was largely overestimated when snow was not taken into account. The simple snow parameterization scheme (S2) as well as adjusted snow precipitation schemes (S4) made the modelled ice thickness close to the observations. In this case, applying the effective snow heat conductivity improved the modelled ice thickness (S4 vs S5). The direct application of HIRLAM precipitation as the source of snow (S3) resulted in a large underestimation of ice thickness because of too much snow accumulation in early winter. The snow parameterization schemes S2 and S5 yielded ice thicknesses close to each other and agreed better with the observed ice thickness than the other snow schemes applied. The modelled ice thickness at Dikson Island (D) was an exception: the ice thickness was overestimated applying S2 and S5. Earlier studies have indicated that snow conditions at Dikson Island are more dynamic (Reference Aleksandrov, Bryazgin, Førland, Radionov and SvyashchennikovAleksandrov and others, 2005). Accordingly, the error of modelled ice thickness could be linked with the inaccuracy of modelled snow thickness.
HIGHTSI-modelled ice thickness (lines) and in situ ice thickness observations (circles). The line colours represent different snow thickness parameterizations as given in Table 2.

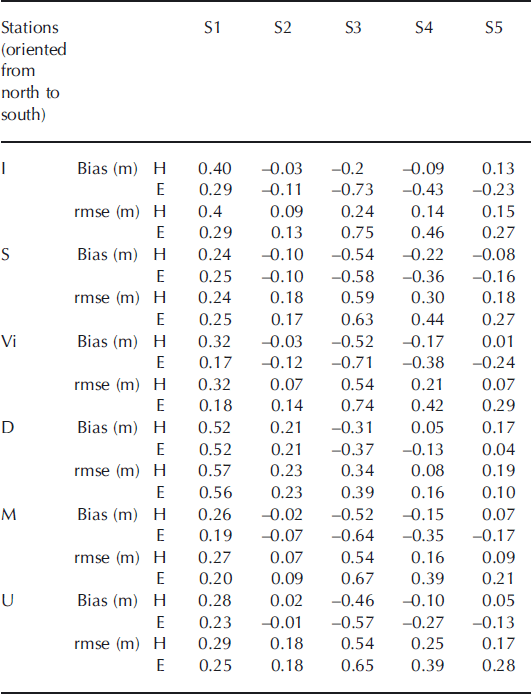
The errors of modelled ice thickness using the HIRLAM and ECMWF forcing are summarized in Table 3. On average, the HIRLAM forcing yielded slightly better ice thicknesses. Without snow (S1), the essential forcings are Vä, Ta and radiative fluxes. Those variables provided by HIRLAM and ECMWF are close to each other, yielding fairly similar modelled ice thicknesses. When snow was taken into account (S2–S5), the model runs with EMCWF forcing often gave negative biases, i.e. underestimation of Hi. This is probably due to a larger snow precipitation produced by the EMCWF model than HIRLAM. Snow schemes S2 and S5 significantly reduced the bias and root-mean-square (rms) errors. The S2 scheme excluded the model uncertainties caused by precipitation. Compared with results from S4 and S5, it seems that using the effective snow heat conductivity improves the modelled ice thickness.
Bias (modelled minus observed) and root-mean-square error (rmse) of simulated ice thickness using HIRLAM (H) and ECMWF (E) products as external forcing
The HIGHTSI-modelled snow thickness is given in Figure 4. At most study sites, the trend of the calculated snow thickness (Hs) is not sensitive to the parameterization scheme as long as snow precipitation is applied as forcing (S3–S5), but parameterization S2 yields very different results. Unfortunately, we do not have in situ observations of snow thickness for validation. Thus, the snow thickness from an AMSR-E data product (12.5 km grid size, 5 day running average) (Reference Cavalieri and Markus Tand ComisoCavalieri and others, 2004) is plotted for comparison. To reduce the random fluctuation present in pixel-wise estimates, we used the mean of nine AMSR-E gridcells as our snow thickness estimate. In order to avoid land contamination, the AMSR-E snow thickness pixels are all from sea area where the ice is subject to drift and deformation. Hence, the comparisons made here do not represent an evaluation of modelled and remotely sensed snow products, but rather give two types of snow thickness values that were obtained using completely different and independent approaches. One snow thickness value is from a coastal fast-ice area, whereas the other is from a nearby drift-ice area. The AMSR-E algorithm for snow thickness is based on the difference in snow scattering between the 19 and 37 GHz frequencies under dry-snow conditions (Reference Comiso, Cavalieri and MarkusComiso and others, 2003; Reference MarkusMarkus and others, 2006). The AMSR-E snow thickness has a good accuracy only for smooth first-year ice, with an underestimation bias for deformed ice fields (Reference MarkusMarkus and others, 2006; Reference PowellPowell and others, 2006). The trends of AMSR-E snow thickness are strikingly close to those of Hs modelled with S2. The temporal variation of AMSR-E Hs may be partly linked to unsolved issues in snow thickness retrieval based on radiometer data, such as the effects of snow grain size and density and ice surface roughness. The results indicated that at four (Izvestia Tsik, Sterlegova, Marresale and Ust Kara) out of six study sites the modelled and AMSR-E-based snow accumulation trends agreed before March. To validate modelled and AMSR-E snow thickness, in situ data are needed.

Two stations (Vize Island and Dikson Island) have in situ snow and precipitation measurements. Accordingly, model experiments were carried out using the precipitation and snow thickness measurements as input data (S6 and S7 in Table 2). Figure 5 gives the modelled and observed snow and ice thicknesses as well as AMSR-E-based snow thicknesses. At Vize Island, S6 and S7 produced rather different Hs values (Fig. 5a), which made a total of 20 cm difference in the modelled ice thickness at the end of the model runs (Fig. 5b). Hs yielded by S6 agreed with AMSR-E Hs in late winter. Hs based on S7 agreed with AMSR-E results early in the season, but later Hs was less than that based on AMSR-E. At Dikson Island, the AMSR-E Hs agreed with S7 snow parameterization until March (Fig. 5c). Hs based on S6 was too small in the autumn, but later agreed well with the in situ snow observations. The modelled ice thickness was sensitive to the choice between S6 and S7 in the calculation of snow thickness (Fig. 5d), but the results are definitely better than those based on S1 and S3 given in Figure 3d.
Modelled (a, c) snow and (b, d) ice thicknesses at coastal regions off (a, b) Vize Island and (c, d) Dikson Island. In (a) and (c) the black lines indicate snow measurements at inland weather stations and the black dots denote AMSR-E snow thickness. The black circles in (d) are observed ice thickness.

5. Conclusions
Snow and ice thickness in the coastal Kara Sea were modelled by applying the 1-D thermodynamic model HIGHTSI with forcing from the short-range limited area NWP model HIRLAM and the global NWP model of the ECMWF. We evaluated the HIRLAM and ECMWF models by comparisons against weather station data. Both models showed reasonably good accuracy for wind speed and air temperature (for more information on HIRLAM, see Reference Mäkynen, Cheng and SimiläMäkynen and others, 2013). The snow precipitation, however, differed between the HIRLAM and ECMWF models. On average, HIRLAM forcing yielded slightly better sea-ice thicknesses. Both the HIRLAM and ECMWF precipitation differed from coastal observations, in particular with respect to the magnitude, although the timing of observed and modelled snowfall events often matched. Despite the large uncertainty in the modelled precipitation, NWP models seem to provide the best available information on precipitation over the Kara Sea. Simultaneously, however, the most serious uncertainty in the atmospheric forcing for sea-ice thermodynamics is related to precipitation.
We applied seven snow parameterizations in the model experiments. In the Kara Sea, snow has to be taken into account for thermodynamic modelling. Snow scheme S2, expressing Hs as a function of Hi (Reference Mäkynen, Cheng and SimiläMayknen and others, 2013), yielded reasonable ice thickness results. But the modelled snow thickness lacks temporal variation. Such a snow scheme is liable to problems during the melting season, when the surface albedo feedback dominates the rapid snowmelt (Reference Cheng, Vihma, Zhang, Li and WuCheng and others, 2008b). When NWP-based snow precipitation was applied as the ice model input, snow scheme S4 yielded better ice thickness results than a direct application of NWP snow precipitation as forcing (S3). In the Kara Sea, snowfall occurs in early winter, making it important to correct the early snowfall impact to avoid significant underestimation of ice thickness.
In lieu of in situ observations it is difficult to validate modelled snow thickness. Our modelling experiment suggested that the AMSR-E snow product was close to the HIGHTSI-modelled snow thickness applying S2. The other schemes (e.g. S3 and S4) provided trends of snow thickness somewhat similar to the AMSR-E product, in particular early in the season at four coastal stations (I, S, M and U). At the Vilkistky (VI) and Dikson Island (D) stations, the agreement between the modelled and AMSR-E-based snow thickness was worse. This could be because at those sites the local orographic effects and the high frequency of snowstorms in winter may lead to large spatial variations in snow conditions (Reference Aleksandrov, Bryazgin, Førland, Radionov and SvyashchennikovAleksandrov and others, 2005).
Detection of snow thickness in the Arctic is challenging because it is subject to large spatial and temporal variations, due to wind drift for example. The effects of wind also make the in situ precipitation measurement liable to errors, which can be as large as 200% (Reference Aleksandrov, Bryazgin, Førland, Radionov and SvyashchennikovAleksandrov and others, 2005). This is a problem in the eastern Kara Sea in particular, where snowstorms occur frequently. The heterogeneity of the snowpack, which also occurs on scales as small as metres (sastrugi), is a challenge for modelling. The modelled ice thickness can be improved by applying better parameterizations for snow physical properties, such as the effective snow heat conductivity (Reference Sturm, Perovich and HolmgrenSturm and others, 2002; Reference Semmler, Cheng, Yang and RontuSemmler and others, 2012). This was demonstrated by model runs using S5.
Applying HIGHTSI in a domain where the external forcing at each gridcell comes from operational analysis and short-term forecasts of NWP models (HIRLAM, ECMWF), a two-dimensional snow and ice thickness field is obtained. Such information has been used as a background ice thickness field for an ice thickness algorithm utilizing multisensor remote-sensing data (Reference Similä, Mäkynen, Cheng and RinneSimilä and others, 2013).
In this study, the model experiments ended before the onset of spring melt because the ice thickness retrieval method of Reference Similä, Mäkynen, Cheng and RinneSimilä and others (2013) works only under cold dry-snow conditions. The simple snow scheme (S2) works reasonably well during this period. However, for full seasonal or interannual sea-ice thermodynamic modelling, one may still consider using the precipitation from NWP models as the primary external forcing.
Finally, we stress the need for sustainable field observations in order to obtain good quality in situ data to validate NWPand sea-ice models as well as remote-sensing products.
Acknowledgements
This study was funded partly by the Finnish Funding Agency for Technology and Innovation (TEKES) under the project ‘Sea ice and snow products for the Barents, Pechora and Kara Seas using multisensor satellite data (KaraX)’. The ECMWF is acknowledged for data supply and computing resources.



