Implications
Because of their high costs, microarray gene expression studies are generally performed with relatively small number of animals. Nonetheless, they generate huge data sets, as virtually all the genome is assessed for each subject in a single experiment. Therefore, careful experimental planning and data analysis tools are needed for a successful microarray study. Here, we discuss how prior genomic and biological knowledge can be incorporated into the design and data mining steps of such experiments to improve their efficiency and statistical power.
Introduction
Microarray technology has been increasingly used in animal functional genomics studies to further our understanding related to gene functions and interactions. Applications of microarray technology in livestock span a broad range of research endeavors, from investigation on gene identification and mapping to function and control of gene expression. Such knowledge can ultimately lead to breakthroughs in farm animal production and welfare, enhancing profitability and trade of animal agriculture and its products (e.g. Hiendleder et al., Reference Hiendleder, Bauersachs, Boulesteix, Blum, Arnold, Frohlich and Wolf2005; Cassar-Malek et al., Reference Cassar-Malek, Picard, Bernard and Hocquette2008).
Microarray gene expression assays, however, are extremely complex, involving a number of laboratorial procedures such as sample collection, RNA extraction, reverse transcription and labeling, and the final hybridization. Given the high costs and intense labor requirement, microarray experiments are generally performed with relatively small numbers of samples (animals). Hence, such trials require a great deal of planning and careful experimental design. Moreover, after microarray experiments are conducted, researchers are faced with data sets of unprecedented complexity and dimensionality, requiring tailored statistical and computational tools for an appropriate data mining.
The statistical analysis of such data sets generally involves a data preprocessing step, which refers to the summarization of signal intensities into expression indexes, as well as data transformation and normalization, for removing non-biological systematic effects contributing to variation on expression measurements (Jaffrezic et al., Reference Jaffrezic, De Koning, Boettcher, Bonnet, Buitenhuis, Closset, Déjean, Delmas, Detilleux, Dovc, Duval, Foulley, Hedegaard, Hornshoj, Hulsegge, Janss, Jensen, Jiang, Lavric, Lê Cao, Lund, Malinverni, Marot, Nie, Petzl, Pool, Robert-Granié, SanCristobal, van Schothorst, Schuberth, Sorensen, Stella, Tosser-Klopp, Waddington, Watson, Yang, Zerbe and Seyfert2007). After the microarray data has been normalized, the statistical analysis may involve, e.g., clustering techniques, discriminant analysis, or differential expression significance test (see, e.g., Jaffrezic et al., Reference Jaffrezic, De Koning, Boettcher, Bonnet, Buitenhuis, Closset, Déjean, Delmas, Detilleux, Dovc, Duval, Foulley, Hedegaard, Hornshoj, Hulsegge, Janss, Jensen, Jiang, Lavric, Lê Cao, Lund, Malinverni, Marot, Nie, Petzl, Pool, Robert-Granié, SanCristobal, van Schothorst, Schuberth, Sorensen, Stella, Tosser-Klopp, Waddington, Watson, Yang, Zerbe and Seyfert2007; Sorensen et al., Reference Sorensen, Bonnet, Buitenhuis, Closset, Déjean, Delmas, Duval, Tosser-Klopp, Hedegaard, Hornshoj, Hulsegge, Jaffrézic, Jensen, Jiang, de Koning, Lê Cao, Nie, Petzl, Pool, Robert-Granié, San Cristobal, van Schothorst, Schuberth, Seyfert, Waddington, Watson, Yang, Zerbe and Lund2007). Subsequently, results are generally complemented with some sort of validation or interpretation using biological knowledge such as gene networks and functional categories, e.g., for assessing enrichment of gene sets (e.g. Beissbarth and Speed, Reference Beissbarth and Speed2004; Subramanian et al., Reference Subramanian, Tamayo, Mootha, Mukherjee, Ebert, Gillette, Paulovich, Pomeroy, Golub, Lander and Mesirov2005; Sorensen et al., Reference Sorensen, Bonnet, Buitenhuis, Closset, Déjean, Delmas, Duval, Tosser-Klopp, Hedegaard, Hornshoj, Hulsegge, Jaffrézic, Jensen, Jiang, de Koning, Lê Cao, Nie, Petzl, Pool, Robert-Granié, San Cristobal, van Schothorst, Schuberth, Seyfert, Waddington, Watson, Yang, Zerbe and Lund2007). On a different approach, rather than using biological information on a follow-up step only, some authors have suggested the integration of external genomic information into the statistical analysis itself, as well as in the design of microarray trials.
In this paper, we review experimental design and data analysis strategies, which take advantage of prior genomic and biological knowledge to improve the efficiency of microarray experiments. Regarding the design component of the manuscript, we concentrate the discussion on genetical genomics studies, which make use of information on genotypes and genetic relationships among the animals available for the expression profiling. In regard to the data analysis module, we focus on the analysis of differential expression, which use genomic information such as gene function and pathway membership, to improve the power of detecting differential expression, as well as the reliability of fold change estimates. This paper is organized as follows: In the first section, we provide some examples to support the notion of the relationship between gene sequence and transcriptional activity, including coexpression of genes. In the second section, we present experimental design alternatives proposed in the literature on how molecular maker information can be used to improve the efficiency of genetical genomics studies. The following section discusses the use of genomic information, such as gene networks, on the statistical analysis of microarray data and lastly some concluding remarks are provided.
The relationship between gene sequence and transcriptional activity
With the accumulation of more microarray data and the availability of complete sequences for several species provided by sequencing projects, the relationship between the expression and the sequence has been demonstrated by many studies. For example, Cohen et al. (Reference Cohen, Mitra, Hughes and Church2000) and Kruglyak and Tang (Reference Kruglyak and Tang2000) independently found that adjacent pairs of genes in yeast (Saccharomyces cerevisiae) have correlated expression patterns. The same phenomenon has been observed in human (Lercher et al., Reference Lercher, Urrutia and Hurst2002), worm (Roy et al., Reference Roy, Stuart, Lund and Kim2002), fruit flies (Spellman and Rubin, Reference Spellman and Rubin2002), and Arabidopsis thaliana (Williams and Bowles, Reference Williams and Bowles2004). Fukuoka et al. (Reference Fukuoka, Inaoka and Kohane2004) performed whole genome transcriptional profiling in six eukaryotic genomes, including yeast, fruit fly, worm, rat, mouse and human, and also found that neighboring genes are likely to be coexpressed.
In addition, other studies showed that genes with common sequence elements in their upstream regions (i.e. regulatory motifs) often share the similar expression patterns (e.g. Bussemaker et al., Reference Bussemaker, Li and Siggia2001). Coexpression patterns have been used then to identify regulatory motifs and also for inferring the cause of such coexpressions, i.e., shared transcription factor (TF)-binding sites in the promoters of coregulated genes (Bussemaker et al., Reference Bussemaker, Li and Siggia2001; Conlon et al., Reference Conlon, Liu, Lieb and Liu2003). By studying the relationship between gene sequence and transcriptional activity, Zhang et al. (Reference Zhang, Lefkowitz, Wei, Lorraine, Page and Allison2009) also provided evidence that sequence similarity, gene neighborhood, as well as pathway membership contribute to observed coexpression patterns.
To take advantage of the relationship between gene sequence and expression, a number of recent publications in the microarray literature propose the use of different kinds of biological information into the design and analysis of such experiments. In this review, we discuss two specific applications of this concept, namely (i) the design of genetical genomics studies and (ii) the significance test for detection of differential expressed genes across experimental or observational groups.
Planning of microarray experiments using molecular marker information
The planning of a gene expression study entails a variety of aspects, including the choice of the microarray platform that best suits the specific experiment goals, as well as careful decision regarding the cell type(s), tissue(s), and the developmental stage(s) to be assayed. Various commercial and homemade microarray platforms are available for gene expression profiling in different livestock species, including the so-called two-color (using either cDNA or long oligo probes) and single-channel (generally with short oligo probes) technologies. The choice of microarray platform is generally guided by the availability of alternative technologies for the organism being studied. For example, cDNA microarrays are available only for species from which expressed sequence tags (ESTs) were obtained from cDNA libraries. Likewise, slides using oligonucleotide probes can be generated only if DNA sequence is available, and an optimal probe set can be designed only for those species with completely sequenced genomes. Hence, a broader range of commercial and homemade array platforms is generally available for research in cattle, pigs and chickens as opposed to other livestock species. Besides economics, the choice of microarray platform depends also on the nature of the research question proposed. For example, traditional platforms may not be optimal for exon level expression profiling to uncover alternative splicing events.
In addition to the choice of array platform, another important consideration before execution of microarray experiments is the complexity of the tissue of interest, and whether to use RNA from whole tissue v. individual purified cell populations of interest. For example, when whole tissue RNA is utilized in microarray experiments, changes in gene expression of interest may be diluted by contribution of transcripts from other cell types and tissue components or may be masked by potential divergent gene regulation within individual cell populations (Smith and Rosa, Reference Smith and Rosa2007).
Another interesting and extremely important component of microarray experiment planning refers to the choice of the experiment layout regarding the allocation of mRNA samples within assay batches, slides, dye labeling and other local control factors (Rosa et al., Reference Rosa, De Leon and Rosa2006). With single-channel platforms, the experiment setup is usually straightforward, as each sample is assayed in an independent slide. With two-color microarrays, on the other hand, there are always numerous ways of pairing samples and assigning dyes. The simplest alternative refers to the so-called reference design, though the loop structure is shown to be generally more efficient (Kerr and Churchill, Reference Kerr and Churchill2001; Yang and Speed, Reference Yang and Speed2002). In addition, variations of the classical reference and loop structures may be obtained with different combinations of biological and technical replication (Rosa et al., Reference Rosa, Steibel and Tempelman2005), i.e., number of subjects within each experimental group and number of replicated arrays or spots for each biological sample, respectively. In a more general context, optimal design methodologies may be used to search for more efficient experiments for specific goals of the experiment (Bueno Filho et al., Reference Bueno Filho, Gilmour and Rosa2006).
It is clear then that prior biological knowledge and the specific experiment goal(s) play a crucial role in the planning phase of a microarray assay, including the choice of array platform, the tissue/cells to be assayed and the overall experiment layout. In addition, prior knowledge may help also on sample size and power calculations, which require input in terms of effects size values, i.e., expected fold change and variability of the system. In this manuscript, however, we focus the discussion on the design of experiments for genetical genomics studies (Jansen and Nap, Reference Jansen and Nap2001), which combine gene expression with information on phenotypic traits, family (or pedigree) structure and molecular markers. Genetical genomics experiments are used, e.g., to search for polymorphisms associated with gene expression variability, denoted expression quantitative trait locus (eQTL), and to estimate heritability of mRNA transcript abundances, among other applications. A comprehensive review of alternative design strategies for genetical genomics studies was presented by Rosa et al. (Reference Rosa, De Leon and Rosa2006). Here, we briefly discuss the main approaches available in the literature, as well as their extension to outbred populations, as generally encountered in livestock research.
A number of suggestions for taking advantage of prior knowledge (in terms of molecular marker information or genetic relationships between individuals) are available in the literature, which can be split into two main categories. The first group relates to the subset selection of individuals to be assayed, when a larger panel of individuals is available. This strategy is generally referred to as selective phenotyping, or selective transcriptional profiling. A second group of design techniques refer to optimal strategies to allocate mRNA samples across slides and dye labeling, if two-color microarrays are being used.
Selective phenotyping is advised when the number of animals available is larger than the number of mRNA samples to be assayed. In such cases, instead of randomly choosing individuals from the available panel, one may use molecular marker information to try to maximize genetic dissimilarity among selected individuals to increase the power of detecting QTL additive effects (Jin et al., Reference Jin, Lan, Attie, Churchill, Bulutuglo and Yandell2004). Such rationale can be extended also if interest includes QTL with dominant effects (Piepho, Reference Piepho2005; Bueno Filho et al., Reference Bueno Filho, Gilmour and Rosa2006). Another cleaver strategy for selective phenotyping in genetical genomics, whose goal is an increased efficiency of localizing eQTL, is a subset selection based on the number of recombination events observed in each individual (Jannink, Reference Jannink2005; Xu et al., Reference Xu, Zou and Vision2005). Such approach may aim not only an increased number of recombination events in the subsample, but also an even distribution of recombinations across the genome. On a somewhat different genetical genomics research goal, if interest refers to inferences regarding variance components and heritability of transcriptional activity, then the selective phenotyping criterion should take into account the genetic relatedness among the available subjects, and the optimal designs are shown to be very specific for each pedigree structure (Bueno Filho et al., Reference Bueno Filho, Gilmour and Rosa2006).
After the individuals to be assayed have been selected, an optimal strategy to allocate mRNA samples across slides and dye labeling should be sought. Again, the choice of experimental layout should be intimately connected with the research goal. Some alternative strategies have been proposed in the literature for specific goals of genetical genomics studies. For example, Fu and Jansen (Reference Fu and Jansen2006) proposed a design strategy for allocating pairs of samples to two-color microarray slides in situations when only two genotypes are possible for each locus, such as with recombinant inbred lines, backcross and double haploid. Their approach, called distant pair design, maximizes the ratio of within- over between-slides genotypic dissimilarity to increase the power of detection of additive effects. Similar rationale was considered by Piepho (Reference Piepho2005), for situations where three genotypes are possible (e.g. F2 population), and the main interest refers to the estimation of dominant effects. A generalization of the distant pairing concept proposed by Fu and Jansen (Reference Fu and Jansen2006) for finite loci was presented by Bueno Filho et al. (Reference Bueno Filho, Gilmour and Rosa2006) for experiments aiming at the estimation of variance components and heritability of gene expression. It is shown that given a sample of subjects with a certain relatedness structure (pedigree), the optimal designs tend to pair less related individuals in each slide.
Specifically for genetical genomics with livestock, Cardoso et al. (Reference Cardoso, Rosa, Steibel, Ernst, Bates and Tempelman2008) extended and compared a number of selective phenotyping strategies in the context of an outbred F2 population, and Lam et al. (Reference Lam, Fu, Jansen, Haley and de Koning2008) propose an extension of the distant pairing strategy for outbred experimental crosses. It is shown that, with limited resources or a fixed number of microarray slides, an optimal selective phenotyping strategy and experimental layout can substantially improve the efficiency of genetical genomics studies.
Integrating genomic information into the statistical analysis of microarrays
General aspects
Microarray assays involve multiple sources of systematic effects (e.g. differences among slides and dye labeling and spatial variation within slides), such that their statistical analysis generally requires a data preprocessing step, usually referred to as normalization, for removing non-biological effects contributing to variation on expression measures. A review and comparison of normalization techniques is provided, e.g., in Jaffrezic et al. (Reference Jaffrezic, De Koning, Boettcher, Bonnet, Buitenhuis, Closset, Déjean, Delmas, Detilleux, Dovc, Duval, Foulley, Hedegaard, Hornshoj, Hulsegge, Janss, Jensen, Jiang, Lavric, Lê Cao, Lund, Malinverni, Marot, Nie, Petzl, Pool, Robert-Granié, SanCristobal, van Schothorst, Schuberth, Sorensen, Stella, Tosser-Klopp, Waddington, Watson, Yang, Zerbe and Seyfert2007).
Normalization approaches can be based either on control genes, or on data-driven selected genes seemingly equally expressed across experimental groups, or most commonly, on all genes represented in the slides. In this latter case, robust statistical techniques are used, with the assumption that the majority of the genes are not differentially expressed. In some cases, e.g., with boutique arrays developed specifically for studies with certain tissue(s) and developmental stage(s), this assumption does not hold and alternative normalization techniques are required (Oshlack et al., Reference Oshlack, Emslie, Corcoran and Smyth2007). Hence, it is apparent that biological knowledge should be used to guide researchers to choose an appropriate data normalization strategy for their experiments.
Other examples of use of prior biological information in preprocessing of microarray data can be found, among others, in Tuikkala et al. (Reference Tuikkala, Elo, Nevalainen and Aittokallio2006) who used information on functional similarities, assessed by semantic correspondences originating from gene ontology (GO) annotations, to improve the selection of relevant genes for missing data imputation, and in Kim et al. (Reference Kim, Doan, Duggal and Bailey-Wilson2007) who investigated the incorporation of genetic relationships among animals for the normalization of expression data in genetical genomics studies.
After this first step of data preprocessing, a higher-level statistical analysis is performed. Depending on the objective(s) of the study such analysis may involve, e.g., clustering, classification techniques or hypothesis testing for detection of differential expression (for a comparison of different approaches, see, e.g., Jaffrezic et al., Reference Jaffrezic, De Koning, Boettcher, Bonnet, Buitenhuis, Closset, Déjean, Delmas, Detilleux, Dovc, Duval, Foulley, Hedegaard, Hornshoj, Hulsegge, Janss, Jensen, Jiang, Lavric, Lê Cao, Lund, Malinverni, Marot, Nie, Petzl, Pool, Robert-Granié, SanCristobal, van Schothorst, Schuberth, Sorensen, Stella, Tosser-Klopp, Waddington, Watson, Yang, Zerbe and Seyfert2007 and Sorensen et al., Reference Sorensen, Bonnet, Buitenhuis, Closset, Déjean, Delmas, Duval, Tosser-Klopp, Hedegaard, Hornshoj, Hulsegge, Jaffrézic, Jensen, Jiang, de Koning, Lê Cao, Nie, Petzl, Pool, Robert-Granié, San Cristobal, van Schothorst, Schuberth, Seyfert, Waddington, Watson, Yang, Zerbe and Lund2007). In this manuscript, we will specifically discuss the comparison of expression profiles across groups or populations using ANOVA models. Such models (including those with random effects) are the most popular in the microarray literature (see, e.g., Jaffrezic et al., Reference Jaffrezic, De Koning, Boettcher, Bonnet, Buitenhuis, Closset, Déjean, Delmas, Detilleux, Dovc, Duval, Foulley, Hedegaard, Hornshoj, Hulsegge, Janss, Jensen, Jiang, Lavric, Lê Cao, Lund, Malinverni, Marot, Nie, Petzl, Pool, Robert-Granié, SanCristobal, van Schothorst, Schuberth, Sorensen, Stella, Tosser-Klopp, Waddington, Watson, Yang, Zerbe and Seyfert2007), due to their flexibility and ease of use as well as the availability of software for their implementation, e.g. MAANOVA and LIMMA, both developed in R language and available at Bioconductor website (http://www.bioconductor.org/).
The ANOVA approach for analyzing microarray data was first presented by Kerr and Churchill (Reference Kerr and Churchill2001), with a model described as:

where y adgvr represents the expression intensities on the log scale; μ is an overall constant; Aa, Dd and (AD)ad are ‘global factors’ that account for variation between arrays and dyes; Gg is the gene effect; (AG)ag represents array by gene interactions; (DG)dg is gene-specific dye effects; (VG)vg is the quantity of interest, related to differential expression of gene g specifically attributable to variety (treatment) v; and ε adgvr is random residual term with variance σ ε2. Wolfinger et al. (Reference Wolfinger, Gibson, Wolfinger, Bennett, Hamadeh, Bushel, Afshari and Paules2001) extended this approach to allow for random effects as well for gene-specific variance components. For computational convenience, a two-step methodology was proposed. In the first stage, a model including only global factors is fitted to all data simultaneously, which can be written as:

where the terms are defined as in model
(1). The second stage uses the estimated residuals  from model
, and fits a series of gene specific models, expressed as:

where μ g, Aag, Ddg and Vvg are gene-specific constant, array effects, dye effects and treatment effects, respectively.
The mixed effects modeling approach of Wolfinger et al. (Reference Wolfinger, Gibson, Wolfinger, Bennett, Hamadeh, Bushel, Afshari and Paules2001) relaxes the assumption of a common variance for all genes, as in model (1), but at the expense of performing independent analyses for each gene, one at a time. This means that genes are treated as independent entities, ignoring the natural covariance among their expression levels due to coregulation processes. The main drawback of this approach is that, because sample sizes for each gene are usually relatively small, the resulting statistical tests have low power and fold change estimates have low precision. Most of the strategies available in the literature to overcome this situation refer to some sort of shrinkage estimation of variance components, to borrow information across genes (e.g. Smyth, Reference Smyth2004 and Cui et al., Reference Cui, Hwang, Qiu, Blades and Churchill2005). However, those approaches are still based on the assumption of independence among genes, and they do not take advantage of prior genomic or biological knowledge. Exogenous information is generally used only after a list of genes has been selected, e.g., to study gene set enrichment (Huang et al., Reference Huang, Sherman and Lempicki2009).
Modeling covariance between gene expression
Some recent publications have suggested the integration of prior biological knowledge into the statistical analysis of microarray data. For example, Imoto et al. (Reference Imoto, Higuchi, Goto, Kuhara, Miyano and Tashiro2003) and Werhli and Husmeier (Reference Werhli and Husmeier2007) exploit multiple sources of prior knowledge for gene regulatory network reconstruction; and Huang and Pan (Reference Huang and Pan2006), Pan (Reference Pan2006a) and Tseng (Reference Tseng2007) propose biologically informed gene clustering techniques. However, not much research has been published regarding the incorporation of prior knowledge into the analysis of differential expression, one exception being Pan (Reference Pan2006b), who uses gene functional annotation for improving detection of differentially expressed genes. Here, we discuss some strategies for integrating prior biological information into the statistical analysis of differential expression. The main idea is to build parsimonious multivariate ANOVA models, as an alternative to the shrinkage estimation approaches usually found in the literature.
We start by combining the gene-specific models into a single multigene model (as discussed by Hoeschele and Li, Reference Hoeschele and Li2005), which can be expressed in matrix notation as:

where y is a vector with expression intensities for all genes and samples; β and u are vectors with fixed (such as treatment and dye) and random (such as slide and animal) effects, respectively; X and Z are incidence matrices; and ε is a vector of residual terms, assumed to be independent from each other. For modeling the dependence across genes, a multivariate version of the mixed model described above could be considered, with an unstructured covariance matrix for modeling the residuals. In this case, the variance of ε could be represented as Var (ε) = In⊗Σ, where

is a matrix describing the variances and covariances between genes, k is the number of genes and In is an identity matrix of order n (n is the number of samples or subjects in the experiment).
The covariance matrix Σ, however, has k(k + 2)/2 distinct elements that need to be estimated (k variances and k(k − 1)/2 covariances), which makes fitting such a model unfeasible given the small number of samples relative to the number of genes, i.e. n ≪ k. For example, with an experiment involving k = 10 000 genes, there would be over 50 million (co)variance parameters to be estimated. Nonetheless, currently microarray experiments in livestock do not involve more than a few hundreds of slides.
To overcome this problem, biological information could be used, e.g., to split the genes into subsets of potentially coexpressed genes such that multivariate models of much lower dimensions could be fitted within each set of genes. Biologically meaningful gene groupings, such as regulatory networks and pathways, can be assessed using freely available databases such as the GO Consortium (GO – http://www.geneontology.org/), the Kyoto Encyclopedia of Genes and Genomes (KEGG – http://www.genome.jp/kegg/) among others. In this context, the assumption is that genes in different groups are independent but that genes within each group can have any pattern of coexpression. Under these circumstances, the new covariance matrix Σ is block diagonal, and can be described as:

where b is the number of gene subsets, and

The number of non-zero parameters in Σ is now  which is much smaller than the original
 parameters, where
 . Moreover, the analysis under such settings can be implemented independently for each gene set, making model dimensions even smaller and computations less cumbersome. Nonetheless, small samples sizes can still hinder the gene set models to be fitted, especially for larger groups of genes. In this case, parsimonious structures for each covariance matrix Bi can be built using biological information, e.g., by describing covariances between genes as a function of their number of shared elements, their positions in the genome, as well as information on biological processes (Vazquez et al., Reference Vazquez, Rosa, de los Campos, Weigel and Gianola2009).
A standard way of summarizing current knowledge about the biological process is via a regulatory network. Wei and Pan (Reference Wei and Pan2008), e.g., used biological information summarized in a network with a model in which the joint prior probability of gene effects is multivariate normal, and the conditional prior probabilities for any gene depends only on the effects of neighboring genes. The mean of the conditional distribution is the mean of the effects of neighboring genes, and its variance decrease with edge degree. A more general approach may be obtained by assigning a multivariate normal prior on gene effects with a general (co)variance structure derived from the network, in the form of a kernel.
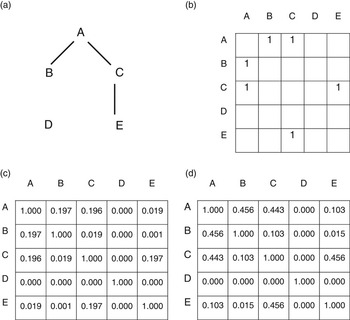
The key element in this approach is the form of Σ, which is a function of a gene network (or graph). Figure 1 illustrates how to express an undirected unweighted graph into an adjacency matrix, E, whose entries eij are equal to 1 if genes (or nodes) i and j have a common edge connecting them (e.g. indicating (co)expression), or 0 otherwise. As an example, in Figure 1a, genes A and B are connected with an edge, and D is an isolated gene. Kernel candidates are functions of E, such as the exponential exp(−dij), or the inverse 1/dij, where dij is the length of the path between nodes i and j, with an infinite distance between no connected genes (e.g. genes A and D in Figure 1a). A particular function of E is the diffusion kernel (Kondor and Lafferty, Reference Kondor and Lafferty2002), which has been previously used in microarrays in a classification problem with a support vector machine approach (Vert and Kanehisa, Reference Vert and Kanehisa2003). The diffusion kernel matrix has larger entry values between nodes more closely connected and smaller values between two nodes with a longer path, with the strength of the correlations controlled by a bandwidth parameter h. On Figure 1, two different values of the bandwidth parameter were used to construct diffusion kernels based on the simple network depicted (h = 0.2 and 0.5 for Panels c and d, respectively).
Example of an undirected unweighted graph representing a 5-node network (panel a), and its corresponding adjacent matrix (panel b), and two possible diffusion kernels (panels c and d).

As an illustration of the potential of using prior biological knowledge in the analysis of microarray data, we consider a simple example with the data set and network used by Wei and Pan (Reference Wei and Pan2008). Briefly, log-ratio expression of 4609 genes of S. cerevisiae was measured in absence and presence of a TF, using ChIP-on-chip technology. A weighted average of three independent replicates in each group (i.e. with and without TF) were analyzed, incorporating or not the information provided by a probabilistic functional gene network obtained from an independent study (Lee et al., Reference Lee, Date, Adai and Marcotte2004).
The following model was used to incorporate the gene network information:

where yk is the average (over the three replicates) of the log-ratio intensity values for gene k, m is an overall mean, gk is the differential expression (fold change in the log scale) relative to gene k, and ek is a residual term associated with the observation yk. It is assumed that  , and that g = [g 1, g 2,…,g K]′∼N(0,Kh). A diffusion kernel with bandwidth parameter h = 0.2 (K0.2) was then generated from the network. A model that ignores the gene network information was also considered, in which case g = [g 1, g 2,…,g K]′∼N(0,Iσg 2), i.e.
 . These models were evaluated in terms of predictive ability using a leave-one-out cross-validation (LOOCV) approach. In the model with the gene network (K0.2 model), prediction of ratio values were obtained by
 , whereas in the model ignoring the gene network, because of the confounding between gk and ek, predictions were equal to
 for all k.
With the K0.2 model, the estimate of variance due to the gene structure was 0.006, whereas the residual variance was 0.045, such that the gene structure explained about 12% of the total variability. When ignoring the network, however, it was not possible to separate both variances, since the data set does not have replications. The network allowed not only the estimation of variances, but also the prediction of gene expression differences (fold changes). The correlation between predicted and observed log-ratio values was 0.76, indicating that the network produced considerable information borrowing across genes. The mean squared error of the prediction (MSEP) evaluated via LOOCV was smaller in K0.2 compared with the model ignoring the network, being 0.0503 and 0.0545, respectively (i.e. an improvement of 7.6%).
For successful modeling of covariance structures for microarray data using prior biological knowledge, the choice of an adequate kernel is critical. Building adequate kernels requires two main components: (i) an informative input set and (ii) an appropriate function to generate the kernel from the adjacent matrix. Informative input sets can be gathered from trustable and validated biological knowledge from public databases, whereas an adequate kernel can be obtained, e.g., by comparing candidate functions using cross-validation techniques. In this case, the incorporation of prior knowledge into the statistical analysis of microarray data should yield lower MSEP, i.e. more accurate and or less biased predictions.
Concluding Remarks
In this manuscript, we discuss the incorporation of genomic and biological knowledge into the experimental design and data analysis of microarray gene expression experiments. Specifically on the design of microarray experiments, we review strategies for subset selection of animals and for pairing of RNA samples for each competitive hybridization in genetical genomics studies. It is shown that the use of molecular marker information and genetic relationships among animals can increase the power of eQTL detection, and also improve the accuracy of estimates of transcriptional activity heritability. The incorporation of biological information, such as gene function and pathway membership, is also shown to improve results of microarray data mining tools. More specifically, it is shown to considerably enhance performance of clustering techniques. Here, we discuss how statistical models for detection of differential expression can incorporate biological information, such as gene networks. The key element of the approach discussed is the form with which the network graph is translated to a covariance structure describing gene coexpression. This is an extremely contemporary and promising area of research, which should enhance the efficiency of microarray experiments and lead their analysis to a more integrated, systems biology approach. It is worthy noting that, as technology develops, in the near future gene expression will probably be measured using resequencing techniques (e.g. Morozova and Marra, Reference Morozova and Marra2008; Torres et al., Reference Torres, Metta, Ottenwälder and Schlötterer2008). Nonetheless, most of the design and data analysis strategies discussed here will still apply.
Acknowledgments
The authors acknowledge support from the Wisconsin Agriculture Experiment Station.