


1. Introduction
The thickness of the accumulation zone of an ice sheet responds continually to both annual and long-term changes in snowfall rate, to changes of firn density and to long-term changes in factors controlling ice flow. Such responses are measurable as changes in ice-sheet surface elevation, using satellite or airborne laser altimetry, or precise ground-level surveys. Monitoring of elevation changes is useful for several reasons. First, surface elevation changes rather directly indicate changes in ice-sheet volume, if corrected for bedrock motion and firn-density changes. Second, these changes may be used to constrain models of ice-sheet dynamics. Third, these changes can be manifestations of climate changes. Fourth, they directly reflect the year-to- year variability of accumulation rate, which contains information on atmospheric circulation and hydrologic processes. Interest in use of ice-sheet elevation monitoring as a “climate observatory” in this fashion is particularly keen for the Greenland ice sheet (Reference ZwallyZwally, 1989; Reference Davis, Kluever and HainesDavis and others, 1998; Reference KrabillKrabill and others, 1999; Reference ReehReeh, 1999; Reference McConnellMcConnell and others, 2000), which is expected to be a dominant source of future sea-level rise (Reference Huybrechts and de WoldeHuybrechts and de Wolde, 1999) and which is situated in a region where large climate changes are expected if global warming continues.
For elevation-monitoring programs to contribute meaningfully to climate-change studies, the past and present temporal variability of elevation changes must be characterized and understood, and the present contribution is part of this effort. A major complication for these analyses is the stochastic variability of snowfall rate (Reference OerlemansOerlemans, 1981; Reference Van der VeenVan der Veen, 1993), which induces short-term increases or decreases of elevation that are rapid compared to dynamic velocity changes.
Reference Van der VeenVan der Veen (1993) has elucidated important properties of this system, with emphasis on implications for Greenland elevation-monitoring programs. He considers the present climate to be characterized by a Gaussian distribution of annual accumulation rates. This, together with a simple ice-flow model, implies a unique Gaussian distribution of net elevation changes for any specified monitoring interval. This distribution then serves as a benchmark for evaluating whether or not any observed elevation change is likely to result from stochastic variations. Further, contemporaneous climate change is best revealed by elevation monitoring over relatively short intervals (5–10 years) which are long enough to significantly reduce the stochastic accumulation variations but not generally long enough to be dominated by long-term dynamical adjustments.
The present contribution intends to complement Van der Veen’s analyses in two ways:
-
(1) by adopting a longer-term perspective, and
-
(2) by considering firn densification explicitly.
In this paper I use a time-dependent firn-densification and ice- and heat-flow model and data from the Greenland Ice Sheet Project II (GISP2) deep ice core to estimate the history of short- and long-term elevation changes through the late Holocene in central Greenland. From this model history, statistics are computed that characterize elevation change in central Greenland over the past 30–1000 years. These provide a benchmark for comparing future observed elevation changes to the precedent of recent history. The purpose of using such a long-term benchmark is to place any observed changes in comparison to past changes, i.e. to establish how unusual they are from the perspective of (up to) the most recent past millennium of climate history. Further, this analysis provides specific model-based estimates of the effective firn density associated with elevation changes over 5–50 year measurement intervals. This information is necessary for converting water-equivalent benchmark statistics to a benchmark of elevation changes.
Two additional smaller contributions make this paper distinct from Van der Veen’s:
-
(1) No assumption is made about the form of the probability density function (PDF) characterizing accumulation-rate changes, which is the primary determinant of the elevation-change benchmarks; and
-
(2) the long-term mean elevation changes resulting from ice dynamics and climate history are calculated explicitly.
An analysis closely related to the one presented here is Reference McConnellMcConnell and others (2000). They demonstrated, using shallow-core data and a firn-densification model, that observed variations in Greenland surface elevation over the past few decades can be explained by variations in accumulation rate. In addition, they showed that these recent variations are within longer-term variability. The present paper is different in that it
-
(1) gives correction factors (effective densities) for converting accumulation variability to elevation variability,
-
(2) explicitly shows the statistical distributions of elevation variability that are useful as benchmarks for evaluating how future observed changes compare to current and past variability, and
-
(3) distinguishes long-term from current-climate benchmarks.
This paper focuses on the central Greenland Summit region, for two reasons. First, the accumulation-rate history is exceptionally well characterized via the GISP2 ice core (Reference MeeseMeese and others, 1994; Reference Kapsner, Alley, Shuman, Anandakrishnan and GrootesKapsner and others, 1995; Reference Cuffey and ClowCuffey and Clow, 1997). Second, the ice-dynamical contribution to current mean elevation change is modelled to be small here (Reference HuybrechtsHuybrechts, 1994), with the Summit lying in the transition region between actively thinning ice in northeastern Greenland and thickening ice in southwestern Greenland.
Several weaknesses of the present analysis deserve immediate mention, because although the goal is to provide a quantitative benchmark it must be recognized as imprecise and viewed as a current best estimate. First, there is no information available about temporal changes in the local spatial variability of accumulation rate, which contributes to interannual variability in the ice core, so I have assumed that the late-20th-century value (Reference Van der Veen and BolzanVan der Veen and Bolzan, 1999; also estimated independently as discussed below) applies throughout the last millennium too. Fortunately, the effects of spatial variability on 5–50 year cumulative accumulation are minor (Reference Fisher, Reeh and GlausenFisher and others, 1985). The accumulation-rate history from the ice core is itself subject to errors, the magnitude of which is not known for the 5–50 year time intervals considered here. The long-term average cumulative error is only ∼1% in the Holocene (Reference AlleyAlley and others, 1997; Reference MeeseMeese and others, 1997). The approach I adopt is to assume no error in the reconstructed 5–50 year accumulation rates, which means that the elevation variabilities here are too large. This error is probably small, given the high cumulative accuracy of the upper portion of the GISP2 depth–age scale, and the exceptionally strong characterization of annual variability in this core’s upper section (by combining measurements of visual stratigraphy, electrical conductivity, δ 18O and dust concentration). In the present context this is the conservative approach; an anomalous elevation change is identified more conclusively if the benchmark is too broad rather than too narrow.
Finally, the model physics are also imperfect. The time-dependent densification model relies on empirical calibration, and the ice-dynamical effects contributing to the mean rate of elevation change are poorly known. Fortunately, the latter are not important on the 5–10 year time-scales, and the former can be addressed through sensitivity tests.
2. Methods
This analysis is conceptually very simple. It is assumed that the GISP2 accumulation rate and temperature histories of the most recent millennium are accurate for averages over a few years and longer. These histories force an ice-flow model which includes time-dependent firn densification and generates a history of ice-sheet thickness changes. Statistics characterizing this history are compiled, and small corrections are made to remove effects of spatial variability of accumulation rate.
A further assumption is that at the time-scales of interest in this paper, ice-sheet thickness changes are equivalent to surface elevation changes. Isostatic motion, in addition to ice-dynamical changes, may be contributing to a mean long-term elevation change in central Greenland, but this paper focuses on short-term variability superimposed on any long-term trends. The present calculations provide an estimate for this mean value, but here the numerous uncertainties associated with this number are not addressed.
2.1. Definition of benchmarks and of


Suppose that an elevation change ΔE 0 is observed over some measurement interval of N years. We wish to ask whether the magnitude of ΔE 0 is unusual. Is ΔE 0 typical for the past century? For the past millennium? Such questions are answered by comparing ΔE 0 to a PDF showing the relative likelihood of some given ΔE. This density function is the benchmark. Many different benchmarks can be defined. For example, the distribution of all N year elevation changes during the past 1000 years defines one benchmark, whereas the distribution of all N year elevation changes during the past 100 years defines another. If the accumulation-variability and densification-rate controls have not changed during this millennium, then these two benchmarks are identical, despite the difference in number of years. If the accumulation variability of the last 100 years differs from that of the last 1000, the benchmarks will be different. This analysis does not address the significance of such an underlying difference in 100 year climate vs 1000 year climate. For example, the 100 year climate may or may not be likely to arise by stochastic sampling from the 1000 year climate distribution. Either way, if the ΔE 0 is improbable according to the 100 year benchmark, it suggests that the dominant physical controls on Greenland annual climate are changing relative to their characteristic values of the past 100 years. It is beyond the scope of the present analysis to ascertain whether this change has broader significance (e.g. is related to changes of global climate forcings).
The following, more technical description is intended to eliminate possible ambiguity in the term “benchmark” and to define variables. Suppose that in a period of N years duration, the ice-sheet surface elevation changes by a net amount ΔE(N). Over a longer period of M years duration, the M − N + 1 values for ΔE for each N can be compiled to define a random variable whose distribution is characterized by statistics including a variance (the square root of which is the standard deviation
 ). A set of these distributions for various values of N based on a common M years ending at some time t
0 constitute a “benchmark” to which future observations of ΔE(N) can be compared, and judged to be typical or anomalous. The Reference Van der Veen and BolzanVan der Veen and Bolzan (1999) statistics, after a correction is made for effective density, constitute a current-climate benchmark for elevation changes, a theoretical construct for which M is a small number of years and t
0 is the present (a little more than two decades of record were used for their analysis). This is the useful benchmark from which to look for a contemporaneous climate change.
To compare the magnitude of any observed elevation change to historical changes, longer-term benchmarks can be defined (i.e. to ask whether an anomaly relative to the current-climate benchmark is also anomalous with respect to a longer period of time during which accumulation variability may have been greater or smaller). Here I calculate the “one-century benchmark”, for which M = 100 and t 0 is the present, the “three-century benchmark”, for which M = 300 and t 0 is the present, and the “millennial benchmark”, for which M = 1000 and t 0 is the present.
It is important to recognize that
 is the standard deviation of the PDF that characterizes net elevation changes for a specified N and M. It is calculated from the second moment of the distribution and therefore is unbiased by sample size M − N. It is therefore independent of M if the accumulation variability is constant, unless there has been a change in firn density due to a change in mean accumulation rate or temperature.
2.2. Model physics
Ice-sheet surface elevation E rises or falls due to imbalances between net addition of mass by accumulation (ice-equivalent rate
 ) and the downward velocity of surface firn, which is due to a deformational velocity (w
s) and to basal vertical motion (rate
 ):

where ρ
i and ρ
0 are ice and surface density, respectively, here taken to be 920 and 320 kg m−3. The basal motion
 results generally from bedrock uplift and from melting/refreezing. In central Greenland the latter process is absent because the basal temperature is ∼−10°C (Reference Cuffey, Clow, Alley, Stuiver, Waddington and SaltusCuffey and others, 1995). The w
s consists of a dynamic term due to the vertically integrated longitudinal stretching of ice in shear flow, and a term due to densification of firn and ice

where z is elevation above ice-sheet bed, H is ice-sheet thickness,
 is vertical strain rate due to volume-conserving deformation, ρ is bulk density and
 is rate of densification of a specified layer. w
d is a function only of ice-sheet geometry and rheology and therefore changes only on millennial scales (Reference OerlemansOerlemans, 1981; Reference WhillansWhillans, 1981). The annual snowfall rate, by contrast, has large stochastic changes (Reference OerlemansOerlemans, 1981), so ∂E/∂t is rarely close to zero; the ice-sheet surface will rise and sink in coherence with the fluctuations of
 . This response is modulated somewhat by changes in w
p which operate at intermediate time-scales (Reference Arthern and WinghamArthern and Wingham, 1998). Time-dependent densification implies that an elevation increase due to a mean
 increase is larger than for a steady density–depth profile (the firn column thickens), and that a temperature increase causes a surface lowering (thinning of the firn column).
Mechanisms for changes in the dynamic velocity w d are reasonably well understood theoretically for an ice sheet immobile at its bed, but precise predictions of w d for a given location on an ice sheet are uncertain. In central Greenland the most important ongoing elevation changes resulting from controls on w d are thought to be:
-
(1) a decrease due to propagation of Holocene warmth (Reference WhillansWhillans, 1981);
-
(2) an increase due to late-Holocene rise in accumulation rate (Reference Cuffey and ClowCuffey and Clow, 1997);
-
(3) a possible increase due to advection of viscosity stratification (Reference ReehReeh, 1985).
In the present analysis, all of these changes are estimated using a quasi-one-dimensional flow model, described elsewhere (Reference Cuffey, Clow, Alley, Stuiver, Waddington and SaltusCuffey and others, 1995; Reference Cuffey and ClowCuffey and Clow, 1997). As with the zero-dimensional model of Reference OerlemansOerlemans (1981), this model responds to a
 change with an exponentially decaying rate, with a characteristic time of greater than a millennium, so the characteristics of the ice dynamics in this model are not otherwise important for analyses of short-term variability.
2.2.1. Densification
Variations in wρ
are not understood in detail, and there is no standard physical model for predicting densification rate
 in the firn column; here using semi-empirical relations is a necessity. The most rapid response of the firn is in the uppermost section (ρ < 550), and understanding this region is most important for understanding time-dependent elevation on annual to decadal time-scales (Reference Arthern and WinghamArthern and Wingham, 1998). For the lower firn (ρ > 550) the relations of Reference Barnola, Pimienta, Raynaud and KorotkevichBarnola and others (1991) are used here (see Reference Schwander, Sowers, Barnola, Blunier, Fuchs and MalaizéSchwander and others, 1997).
For the upper firn I view the densification rate
 as resulting from two additive mechanisms


of which the dominant one is grain-boundary sliding (rate
 ) (Reference AlleyAlley, 1987), and the secondary one (rate
 ) results from vapor flux in the firn pore spaces.
The grain-boundary sliding rule (Equation (4)) is Alley’s (1987) model. I have followed Reference Arthern and WinghamArthern and Wingham’s (1998) suggestion and set the density at which grain-boundary sliding ceases (ρ +) to a slightly higher value than the 550 kg m−3 used by Alley, and have arbitrarily chosen to use a 5% higher value. The prefactor k G and activation constant Q G are then treated as adjustable parameters here. Other terms in Equation (4) are: T is the absolute temperature, P is overburden pressure and P 0 is air pressure.
As recognized by Alley, the sliding mechanism is inadequate in the topmost few meters, where densification occurs much more rapidly than predicted by Equation (4), and Equation (5) is supposed to contribute the extra densification. Based on the observation that it is needed only in the top few meters, it is assumed here that the missing mechanism is related to vapor flux in the snowpack, driven by the strong temperature and pressure gradients associated with penetration of the seasonal thermal cycle, with winds, and with the high vapor pressures associated with summer-time warmth. I am not confident of the physical mechanism important here but suggest that the continual rearrangement of the firn structure facilitates densification by creating voids that may be filled. Equation (5) is the simplest plausible description: a rapid depth decay (z v = 2 m), a direct proportionality to the saturation water-vapor pressure P vs as a function of temperature (Reference Iribarne and GodsonIribarne and Godson, 1973) and a tunable prefactor, k v.
The densification model thus has three adjustable parameters: k G, Q G and k v. Values for these are found by matching predictions of the density–depth profile to the observed density–depth profiles at GISP2 and at Dye 3. The resulting match is excellent (Fig. 1), with mks values k G = 9.5 × 10⁸, Q G = 6.5 × 10³ and k v = 4 × 10⁻⁷. Though it is not a satisfactory physical model, I do consider this empirical description to be valid for small climate deviations around the present GISP2 value, of the sort that have occurred in central Greenland over the past several millennia.
Comparison of model and measured density–depth structure. For GISP2, model results are the dashed line, and measurements (Reference Alley and KociAlley and Koci, 1990) shown as points (indicated by plus symbols) along the curve fit to the higher-resolution measurements. For Dye 3, model results are the solid line, and measurements are the diamonds (Reference Hammer, Clausen, Dansgaard, Gundestrup, Johnsen and ReehHammer and others, 1978). These model calculations use actual annual accumulation rate and temperature for GISP2, and a mean annual accumulation rate and a seasonal temperature cycle with a constant mean for Dye 3.

2.2.2. Current-climate accumulation variabilities
Following earlier studies, the standard deviation of annual accumulation rate measured on an ice core (called σ
b) is taken to result from a spatial variability component (σ
s) and a regional climatic component (σ
c). Their interrelation is
 . The spatial variability is associated with short-wavelength topographic features and so does not affect net accumulation over many years (Reference Fisher, Reeh and GlausenFisher and others, 1985).
By analyzing a group of shallow cores (spanning 24 years), Reference Van der Veen, Krabill, Gsatho and BolzanVan der Veen and others (1998) and Reference Van der Veen and BolzanVan der Veen and Bolzan (1999) estimate for central Greenland that σ s = 0.027 m a−1 ice equivalent and that σ c = 0.026 m a−1 ice equivalent. These are reasonable estimates for current-climate values.
From a single core, σ
c cannot be estimated for such a short time period, but a somewhat longer-term estimate can be made from the GISP2 core alone and this provides another current-climate estimate for σ
c. Given that the spatial variability noise is only important for time periods of a few years or less (Reference Fisher, Reeh and GlausenFisher and others, 1985), the 10 year net accumulation is almost independent of σ
s. An estimate for σ
c is thus provided by the standard deviation of the 10 year net accumulation, divided by
 . For the most recent 50 years of the GISP2 core (1938–88) this is 0.037 m a−1 ice equivalent. For the same period, σ
b in the GISP2 core is 0.047. These two numbers provide an estimate for σ
s which is
 , which is nearly equivalent to Van der Veen and others’ estimate, despite being constructed by a very different method using a single core.
Given this similarity in σ s, the reason for the 40% higher value for σ c at GISP2 relative to the shorter-term regional estimate is not clear. It is not possible to get a reliable estimate for σ c from the single GISP2 core for the short 24 year period. Thus it may arise from a real difference between the time intervals, or from a real geographic difference between Summit and the more regional average (e.g. Summit could lose more mass by wind scour).
2.2.3. Effective density ρN
To interpret elevation-change statistics in terms of accumulation-rate variability, it is necessary to know the effective density corresponding to an N year observation interval. Specifically, if there is a standard deviation of climatic annual water-equivalent accumulation rate given by σ
c, then the effective density ρN
is defined so that
 can be calculated from

In the limit of steady climate forcings and negligible elevation change, ρN is simply the depth-averaged density for the firn column between the surface and layers of age N. Such a depth-averaged value would probably offer a reasonable estimate of ρN in a variable climate, but in this study I calculate ρN directly from the time-dependent model to avoid any assumptions in this regard. Calculations show (see below) that ρN is indistinguishable from the depth-averaged value for N = 5 or 10, but rises to be 13% higher than the depth- averaged value for N = 50.
By writing
 as the sum
 , Equations (1) and (2) can be decomposed as


and the net elevation change over a time period t = N years written as

Over the time-scales considered here, the
 term can be neglected in central Greenland. Thus thickness changes are enhanced relative to their ice-equivalent values by an amount
 , which allows calculation of ρN
for an N year observation interval as

2.2.4. Correction for spatial variability σ s
To correct for the spatial variability, it is here assumed that σ
s has been constant over time and has the value inferred by Reference Van der Veen and BolzanVan der Veen and Bolzan (1999), σ
s = 0.027 m a−1 ice equivalent. Over multiple years the accumulation-rate variations due to spatial variability are serial anticorrelated so the cumulative effect does not increase over time beyond a few years (see Reference Fisher, Reeh and GlausenFisher and others, 1985). Thus it is reasonable to approximate that over a period of N years this variability makes a contribution N
*[(ρ
i/ρN
)σ
s]2 to the variance of net elevation changes, where N
* is a small number of years (2 is used here). This is subtracted from the total variance before calculating the standard deviations of the multi-century benchmark, which reduces the
 by 6% and
 by < 1%.
2.2.5. Error in identifying layer boundaries
For each N year section of ice core there is an uncertainty of several centimeters associated with the placement of each end. This uncertainty is typically no more than a few per cent of the N year length, so no correction for it has been attempted.
2.2.6. Forcings
The model calculation was conducted with annual forcings throughout the most recent five millennia, and was initialized with lower-resolution forcings (described in Reference Cuffey and ClowCuffey and Clow, 1997) starting 50 ky r before present.
The ice-equivalent accumulation-rate history
 is taken directly from layer-thickness measurements on the GISP2 core corrected for strain and density (Reference AlleyAlley and others, 1993, Reference Alley1997; Reference Cuffey and ClowCuffey and Clow, 1997; Reference MeeseMeese and others, 1997). Annual layers throughout the late Holocene were identified (Reference AlleyAlley and others, 1997; Reference MeeseMeese and others, 1997) by combining measurements of four annually varying properties: the visual stratigraphic layering, the electrical conductivity, the δ
18O, and the microparticle concentration (Reference AlleyAlley and others, 1997; Reference MeeseMeese and others, 1997).
The mean annual temperature for this period was calculated by assuming direct proportionality to the mean annual δ 18O history (Reference Grootes, Stuiver, White, Johnsen and JouzelGrootes and others, 1993; Reference Stuiver, Grootes and BraziunasStuiver and others, 1995), using an isotopic sensitivity of 0.52 per mil° C−1 (Reference Cuffey, Alley, Grootes, Bolzan and AnandakrishnanCuffey and others, 1994; Reference ShumanShuman and others, 1997).
2.3. Numerical implementation
I have added this time-dependent densification model to the quasi-one-dimensional heat-flow/ice-flow model of Reference Cuffey, Clow, Alley, Stuiver, Waddington and SaltusCuffey and others (1995) and Reference Cuffey and ClowCuffey and Clow (1997). As described in these studies, this model uses an Eulerian control volume mesh (Reference PatankarPatankar, 1980) with an adjustable grid to allow for elevation changes of the ice-sheet surface. Using this model in the present context is overkill in so far as the ice-dynamical part is unnecessarily complex, being designed foremost to look at problems coupling long-term firn-density changes to climate changes. It does, however, obviate questions as to how to treat lower boundary conditions, and fully accounts for propagation of thermal anomalies through the firn column. The resolution of the grid near the surface, where density gradients are large, is 2 cm. To avoid numerical instabilities, a small time-step of 0.2 years was used to counter the rapid densification rate near the surface.
2.4. Model response to simple forcings
Model behavior is most simply illustrated as the response to a step change in climate (Fig. 2). A step increase of
 from 0.24 m a−1 to 0.28 m a−1 results in thickening that is amplified by the time-dependent densification. A step increase in temperature from −31.5°C to −26.5°C results in thinning as the firn column warms. These responses are consistent with results of Reference Arthern and WinghamArthern and Wingham (1998).
Modelled elevation response to step changes in climate, as described in the text (upper and lower curves). The middle dashed line shows the response to the accumulation-rate increase if the density–depth profile is held fixed.

3. Results
3.1. Effective densities
The model calculations produce effective density values that vary significantly as a function of the N year observation interval (Fig. 3). This indicates that a single assumption such as ρN = 0.5ρ i (Reference Van der VeenVan der Veen, 1993) may result in misinterpretation in some cases. The increase of ρN as a function of N is similar to the increase of depth-averaged density between the surface and layers of age N (Fig. 1). However, effective density rises more rapidly with N, and attains a 13% higher value by N = 50, implying that elevation variations are modestly smaller than expected from mean depth-averaged density. This results from the dependence of densification rate on overburden. High accumulation rate at the surface increases load on layers of given age at depth, causing the deep layers to densify more rapidly. This slightly reduces the elevation increase caused by the higher accumulation rate.
Effective densities ρN as a function of observation interval N (solid line) Also shown is the depth-averaged density between the surface and the layer of age N (dashed line).

3.2. Current-climate benchmark
These ρN values can be used to construct a current-climate benchmark of N year net elevation changes, using the estimates for standard deviation of climatic water-equivalent annual accumulation rate (σ c) for the recent past. The benchmark standard deviations of N year net elevation changes are then given by Equation (6). The corresponding statistics for annual average rate of elevation change are
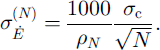
From the analyses of nine 24 year core records in the Summit region, Reference Van der Veen and BolzanVan der Veen and Bolzan (1999) estimate σ
c = 0.024 m a−1, giving, for example, ,
 , and
 . The corresponding average rates of elevation change are 0.03 and 0.02 m a−1, respectively. The σ
c estimated from the GISP2 core for the most recent five decades available (1938–88) is larger, and is ∼ σ
c = 0.034 m a−1. The corresponding benchmark statistics are
 , and
 (with corresponding average elevation change rates of 0.042 and 0.028 m a−1). Both of these are viable estimates for a current-climate benchmark.
3.3. Multi-century benchmarks
The distributions of net elevation changes based on 100, 300 and 1000 years of climate forcing are all similar, and show greater variability than the current-climate benchmarks (Figs 4 and 5). This is directly a consequence of lower average accumulation variability during the most recent several decades compared to variability over the longer intervals (Fig. 6).
(a)
 as a function of N (curve labelled “total”) and the corresponding variability holding density–depth structure constant (labelled “dynamic only”), (b)
 the standard deviation of annual average rate of elevation change, rather than net elevation change.

These are benchmarks. Shown here are inferred PDFs for average rate of elevation change over 5 and 10 year observation intervals. Solid lines: density-adjusted current-climate benchmark using Reference Van der Veen and BolzanVan der Veen and BolzanS (1999) estimate for σ c. Black diamonds: the multi-century benchmark.

GISP2 core estimate of σ
c for periods from 1988 back to the number of years indicated. Also shown is the 1000 year average value. Here σ
c was calculated from annual accumulation variability (measured as σ
b) as
 , with σ
s = 0.027.

The σE for the 100, 300 and 1000 year benchmarks have relative magnitudes of 0.94, 1.0 and 1.04, respectively. These are close enough to be considered indistinguishable, so hereafter I will use the three-century benchmark as a representative multi-century benchmark. σE for this multi-century benchmark (Figs 4 and 5) is 1.23 times larger than the 50 year current-climate one, and 1.8 times larger than the current-climate one based on Van der Veen and Bolzan’s short-term but regional analysis.
This increase is not necessarily expected; more climate regimes are sampled as the basis for the benchmark is extended back through time, but these could be characterized by either smaller or greater variability. The late 20th century was a time of relatively small variability. It can be thought of as a biased sample of the long-term distribution. Note that higher
 variability appears to be a characteristic of the Little Ice Age climate, a thermal minimum which is seen clearly in the temperature-depth signal in central Greenland (Reference Alley and KociAlley and Koci, 1990; Reference Cuffey, Alley, Grootes, Bolzan and AnandakrishnanCuffey and others, 1994).
The increase of σE with N (Fig. 4) is similar to, but smaller than, the pattern expected for a Gaussian random forcing, the difference resulting from the increase of ρN . Not surprisingly, the empirical PDFs are individually very nearly normal distributions (e.g. Fig. 7).
Black diamonds: PDF for 20 year average rate of elevation change, for the three-century benchmark. Dashed line: the normal distribution with equivalent mean and variance.

4. Discussion
4.1. Sensitivities
Results are only weakly sensitive to reasonable changes in the model densification rates. Reducing the rate of the densification mechanisms in the upper firn (ρ < 550) by 20%, for example, reduces
 by only 2%. This low sensitivity reflects the slow pace of the densification; ρ
5 is only ∼30 kg m−3 higher than surface density. With 20% slower densification, ρ
5 is ∼24 kg m−3 higher than the surface density, implying a real change of 1 − (344/350) = 0.02. The difference becomes greater for longer observation intervals, of course, but these are also harder to interpret in practice because the mean ice-dynamical and isostatic elevation-change rate has more of an impact.
Even with our poor current understanding of the physics of the densification process, it is clear that the degree of covariation of temperature and accumulation-rate fluctuations is a potentially important control on
 . The foregoing analyses have assumed that the temperature history is given exactly by the δ
18O record. Although claims for a strong correlation of mean annual δ
18O and temperature are supported by studies spanning a few years (Reference ShumanShuman and others, 1997), and spanning centuries to millennia (Reference Cuffey, Alley, Grootes, Bolzan and AnandakrishnanCuffey and others, 1994, Reference Cuffey, Clow, Alley, Stuiver, Waddington and Saltus1995), a strong correlation has been neither demonstrated nor refuted for the 5–50 year intervals most relevant here. It is unlikely that the assumption of a perfect δ − T correlation has a large impact on the results, because the correlation of
 and T at these scales is weak in central Greenland (Reference Kapsner, Alley, Shuman, Anandakrishnan and GrootesKapsner and others, 1995). However, I have conducted an extreme sensitivity test for heuristic purposes, by repeating the analyses with the assumption that T and
 are perfectly correlated or anticorrelated so that

Given that from year to year
 typically varies by less than ∼0.12 m a−1, and mean annual T is known to vary ∼3 K (Reference ShumanShuman and others, 1997), I choose γ = 3/0.12 = 25 K a m−1 as an extreme. The result (Table 1) is that σE
increases by < 10% if
 and T are negatively correlated, and σE
decreases by < 20% if they are positively correlated.
Fractional change in
 and
 for the sensitivity tests concerning correlation of
 and T, as described in the text

4.2. Generalization
The preceding results are for the Greenland Summit (where
 , T = −31.5°C), but may be used to approximate elevation-change statistics elsewhere on the ice sheet in the dry-snow zone, provided that the results for
 are normalized to the total ice accumulation over N years
 and that the location of interest has a ratio
 similar to that at GISP2.
To illustrate that changes in ρN
do not damage this approximation severely, the model has been run with mean climatic conditions similar to those of Dye 3, by using T = T
GISP2 + 10 and
 . The resulting elevation variability normalized to the ice accumulation rate is roughly 15% less than that at GISP2 (Fig. 8).
 normalized to
 , the annual ice-equivalent accumulation rate. Diamonds: result from GISP2 forcing, as before. Squares: result for “Dye 3-like” mean climatic conditions, assuming σ
s = 0.027 m a−1 ice equivalent. Plus symbols: for comparison, the same result assuming σ
s = 0.

Thus ρN changes are modest as long as the snow is dry. Note, however, that summer melt becomes increasingly important as mean climate warms from GISP2 conditions to Dye 3 conditions. Although the densification model accurately describes the rise of density with depth at Dye 3, the variability calculations do not allow for changes in near surface density associated with melt production. Near surface density changes resulting from changes in the magnitude of surface melt production would propagate to depth. Thus the variability benchmark results presented here should not be used in regions with regular summer melt.
The uncertainty associated with surface melt variability is potentially large in southern Greenland. The mean fraction of the Dye 3 core that is refrozen meltwater is only approximately 5% (Reference Herron, Herron and LangwayHerron and others, 1981). Yet as melt fraction increases from 0% to 10%, ρ 5 increases from ∼350 to ∼400 kg m−3, corresponding to a 15% decrease in the elevation variability.
4.3. Mean value
The model estimate for the mean value of elevation change is an increase of ∼8 mm a−1, or a net increase of 0.04 and 0.4 m over 5 and 50 years, respectively. This slow increase is the continuing response to increased accumulation rate late in the Holocene (Reference Cuffey and ClowCuffey and Clow, 1997), balanced somewhat by thinning due to propagation of the Holocene thermal perturbation (Reference WhillansWhillans, 1981). The effect of this slow increase is negligible relative to the accumulation variability over 5 or 10 year intervals, but becomes important by 50 years, for which it is a substantial fraction of one standard deviation.
The uncertainty in this mean value is difficult to quantify, as it depends on factors like temporal changes in the spatial gradient of accumulation rate, which are not known. It is important to recognize, therefore, that an observed elevation change that appears anomalous relative to either the current-climate benchmark or the multi-century benchmark may indicate either a climate change or a persistent ice-dynamic or isostatic response.
5. Conclusion
The benchmark characterizations presented here provide an updated basis for evaluating whether future measurements of elevation change imply climatic or dynamic changes in addition to stochastic accumulation-rate variations. Specifically, the effective densities calculated from a time-dependent firn-densification model and reconstructed climate forcings allow comparisons of measured elevation changes to recent water-equivalent accumulation-rate variability. Interannual variability has been higher on average over the last century to millennium than during recent decades. Thus, identification of an observed elevation change as anomalous relative to recent historical precedent (i.e. relative to climate in the centuries before atmospheric greenhouse-gas content changes were important forcings) requires that the observed change be larger than those given by the current-climate benchmarks.
Acknowledgements
This work was inspired by reading the 1993 paper of C. J. van der Veen. I thank R. Alley, R. Arthern and E. Waddington for discussions of firn densification. I wish to thank scientific editor R. Naruse and the two anonymous reviewers for identifying problems with the first draft of this paper. This work was funded in part by the U.S. National Science Foundation (0PP-0082453 to K.C).



