I. INTRODUCTION
The two-dimensional carbon-based material graphene has remarkable electronic properties. It is a zero-gap semiconductor indicated by the valence and conduction band overlap at the Dirac points.Reference Castro, Novoselov, Morozov, Peres, Dos Santos, Nilsson, Guinea, Geim and Neto1,Reference Allen, Tung and Kaner2 Graphene’s outstanding charge mobility of ∼10,000 cm−1/s,Reference Zhang Tan, Stormer and Kim3 thermal conductivity of ∼4.84 × 10³ to 5.30 × 10³ W/mK,Reference Balandin, Ghosh, Bao, Calizo, Teweldebrhan, Miao and Lau4 and mechanical strength of 42 N/m are of great interest for potential electronic, optical, and optoelectronic applications.Reference Lee, Wei, Kysar and Hone5–Reference Nilsson, Neto, Guinea and Peres7 Graphene also possesses an excellent charge carrier density up to 1013 cm−2.Reference Novoselov, Geim, Morozov, Jiang, Zhang, Dubonos, Grigorieva and Firsov8 The unique properties of graphene make it a versatile material for numerous device and energy-related applications including transistors, band gap engineering, photovoltaic (PV) and energy storage, and optoelectronic technologies.Reference Sun, Wu and Shi9–Reference Anchal, Gowda, Gullapalli, Dubey, Reddy and Ajayan11 Graphene has been used in PV device fabrication to provide flexible electronics. It is also an optically transparent conductive electrode (97–98% optical transparency)Reference Nair, Blake, Grigorenko, Novoselov, Booth, Stauber, Peres and Geim12 and is a potential alternative for transparent indium tin oxide (ITO)Reference Kim, Granström, Friend, Johansson, Salaneck, Daik, Feast and Cacialli13 and fluorine-doped tin oxideReference Rakhshani, Makdisi and Ramazaniyan14 used for electrical contacts in the PV and optical devices.Reference Geim15
Graphene is synthesized using a number of well-established methods including chemical vapor deposition (CVD), arc discharge, epitaxial growth, reduction of graphene oxide (GO), metal carbon melt, solvent exfoliation, carbon dioxide reduction, and nanotube slicing.Reference Li, Cai, An, Kim, Nah, Yang, Piner, Velamakanni, Jung, Tutuc and Banerjee16,Reference Park and Ruoff17 Catalytic growth of graphene on a substrate such as CVD is the most widely used method, and it produces high-quality large-scale graphene.Reference Sun, Yan, Yao, Beitler, Zhu and Tour18 In the CVD method, high-quality graphene is deposited in a single or a few layers by feeding gaseous hydrocarbons such as methane, benzene, and ethylene onto the catalyst usually at high temperatures (∼1000 °C). Recently, Ajayan’s groups reported continuous ultra-thin CVD-grown graphene films using hexane as the precursor under low pressure condition.Reference Srivastava, Galande, Ci, Song, Rai, Jariwala, Kelly and Ajayan19 Usually, transition metals such as Cu, Ni, Pd, Ru, Co, and Ir are used for catalysts for the graphene synthesis.Reference Reina, Jia, Ho, Nezich, Son, Bulovic, Dresselhaus and Kong20,Reference Sutter, Flege and Sutter21 The thickness and the number of graphene layer deposition are controlled by the reaction parameters such as hydrocarbon concentration, growth temperature, gas pressure, cooling temperature, and catalyst solubility in carbon. Another widely used graphene synthesis method is reduction of GO for inexpensive and large-scale graphene production. The reducing agents such as anhydrous hydrazine, hydrazine monohydrate, and hydroquinone are usually used for the GO reduction. These chemicals are often hazardous and chemically unstable and may also incorporate in the final product.Reference Park, An, Jung, Piner, An, Li, Velamakanni and Ruoff22 Graphene is also produced through the mechanical exfoliation method used by Andre Geim and Konstantin Novoselov. In the micromechanical exfoliation method, scotch tape was used to peel or detach graphene from the bulk graphite crystal. To obtain few layers of graphene, the peeling step was repeated multiple times, and the detached layers were transferred onto a silicon substrate for characterization.Reference Neto, Guinea, Peres, Novoselov and Geim23 This synthetic method is less conducive for the large-scale graphene production for potential industrial applications. Recently, natural polymer such as cellulose was demonstrated as a carbon source for graphene-based device fabrication.Reference Glatzel, Schnepp and Giordano24
In this paper, we present a systematic study for the synthesis of defect-free graphene films (as thin as 10 graphene layers) of large area (7 cm2) using cellulose as the starting material. It is a simple, easy-to-accomplish, and inexpensive method for synthesizing high-quality graphene films on the solid surface and free-standing films using environment friendly cellulose as a carbon source. Utilizing this method, we also synthesized 1D multilayer carbon nanotubes with wall thickness as small as 7 nm (∼21 layers). We performed detailed systematic studies on the effect of synthetic temperature and catalyst on the quality of the ultra-thin graphene films produced. The graphitic films were synthesized at temperatures (T) ranging from 600 to 900 °C at ambient pressure conditions. The characterization of films was performed using X-ray diffraction (XRD), high-resolution transmission electron microscopy (HRTEM), selected area electron diffraction (SAED), and Raman spectroscopy to obtain chemical and structural information. The quality of synthesized graphene films was found to be strongly influenced by the synthetic temperature. Highly ordered defect-free graphitic carbon of many cm2 free-standing and on solid surfaces was formed at 900 °C in the presence of Fe catalyst using cellulose as a starting material. The “D” band at 1320 cm−1 was absent in the Raman spectra for the graphene samples synthesized at T = 900 °C. XRD showed a sharp graphitic scattering peak at 2θ = 26.5° in these sample characteristics of highly ordered graphitic carbon. The graphene lattice fringes with an interplanar distance of 0.335 nm in HRTEM confirmed highly ordered defect-free graphitic carbon in the samples. XRD and electron microscopy and diffraction characterization of the ultra-thin graphene films also confirmed that the synthetic temperature was most influential parameter for the production of high-quality graphene films. The as-prepared thin graphitic films were highly electrical conductive and showed a resistance of 2 Ω for a film of 5 cm2. The electrical conductivity values are in agreement with literature values.Reference De and Coleman25 This electrical resistance was >7 orders of magnitude smaller than comparable amorphous carbon films synthesized in the absence of catalyst. Functional PV devices with photon-to-electron efficiency ∼1% were fabricated using ultra-thin films as one of the two electrodes of the device fabrication.
The proposed method described in this manuscript allows environment friendly cellulose as a carbon source for the synthesis of large area high-quality free-standing and substrate-bound graphitic films inexpensively in one step. Overall, this work signifies a readily available starting material for the synthesis of high-quality graphitic films and functional devices for low-resource countries where sophisticated instrumentation may not be widely accessible.
II. EXPERIMENTAL PROCEDURE AND MATERIALS
A. Materials
Methyl cellulose (carbon source for graphene) was purchased from Life/Farms Inc. Iron(II) sulfate, iron(III) nitrate, ammonium hydroxide, Whatman filter paper No. 40, alumina Anodisc, poly(3-hexylthiophene) (P3HT), and [6,6]-phenyl-C61-butyric acid methyl ester (PCBM) were purchased from Fisher Scientific, Hampton, New Hampshire. Quartz frits were purchased from Quartz Scientific Inc. (Fiarport Harbor, Ohio).
B. Methods and characterization
XRD characterization was performed on a Rigaku Miniflex II (Tokyo, Japan) X-ray diffractometer (30 kV, 15 mA) using Cu Kα radiation (λ = 0.154 nm). HRTEM imaging was performed using a FEI Tecnai F20 system (Waltham, Massachusetts) at an operating voltage of 120 kV. TGA experiments were performed on a TA Q50 by placing 4.8 mg of cellulose soaked in the iron catalyst in the platinum pan under N2 gas flow. The sample was heated to 900 °C at a heating rate of 20 °C/min.Reference Jiang, Feng, Liu and Fan26 Raman samples were prepared by mounting thin sheets of graphene samples on a glass substrate. The Raman data were collected at a laser excitation of 532 nm with a LabSpec 6-HORIBA Scientific Instrument. P3HT was optically characterized using a UV-Visible Perkin Elmer Lambda 25 (Waltham, Massachusetts) spectrometer. Photoluminescence was acquired on a Perkin Elmer LS55 (Waltham, Massachusetts) spectrophotometer with a band pass, and scan speeds of 5 nm and 500 nm/min. FEI FEG Quanta 450G (Waltham, Massachusetts) with an accelerating voltage 20 kV was used for the scanning electron microcopy (SEM) experiments.
The surface adsorption studies were performed using a Micromeritics ASAP 2050 (Norcross, Georgia) analyzing port by submerging the samples in a liquid nitrogen bath (77.3 K) during the adsorption experiments. The Brunauer–Emmett–Teller (BET) equation is an extensively used method to measure the specific surface area of a material.Reference Brunauer, Emmet and Teller27 The surface area of thin-graphene films synthesized using our synthetic procedure was determined using the BET equation. The surface area of the sample is obtained by plotting the adsorption isotherm data in terms of the BET equation and obtaining the monolayer capacity from the plot. The N2 adsorption isotherm studies were performed at 77.3 K (liquid nitrogen), and the measurements were conducted for pressures up to the corresponding saturated vapor pressure. The specific surface area of the synthesized graphite that was annealed at 900 °C was measured to be 2.8 m2/g (Fig. S5). The N2 adsorption isotherm at 77.3 K on the annealed graphite showed a step at a relative pressure of ∼0.3 (Fig. S5). This step corresponds to the formation of a second N2 layer on the surface of the sample.Reference Kjems, Passell, Taub, Dash and Novaco28
C. Iron nanoparticle synthesis
Iron nanoparticles were used to catalytically convert carbon to graphene. In a typical synthesis of iron nanoparticles, 0.32 g (1.2 mmol) of FeSO4·7H2O and 1.5 g (3.7 mmol) of Fe(NO3)3·9H2O were dissolved in a mixture of 50 mL of water and 5 mL of methanol.Reference Laurent, Forge, Port, Roch, Robic, Vander Elst and Muller29 An excess of concentrated ammonium hydroxide was added in a dropwise manner with stirring. The solution was heated to 80 °C for 3 h while stirring. The solution was then cooled to room temperature and a magnet was used to hold the nanoparticles down while the liquid was decanted off the beaker. The nanoparticles were washed twice with water and were stored as a slurry solution in a vial for future uses. The size of Fe nanoparticles was measured using TEM. The nanoparticles were in the size range between 5 and 30 nm [Fig. S1(d)].
D. Preparation of large-scale thin graphene films using methyl cellulose and filter paper
The catalyst solution for the graphitic film synthesis utilizing cellulose filter paper was aqueous Fe(III) solution. It was prepared by dissolving 10 g of Fe(NO3)3 9H2O in 10 mL of water. Cellulose solution or a square (2 × 2 cm2) of cellulose filter paper with a thickness of 210 μm was dipped in the catalyst solution for 30 s [Fig. S1(a)]. It was removed and allowed to dry at 80 °C in an oven for 15 min. Fe(III) soaked paper was kept in a furnace while purging with N2 gas at a flow rate of 100 mL/s [Fig. S1(b)]. The temperature of the furnace was increased to a desired temperature (600 °C ≤ T ≤ 900 °C) over a time period of 20 min. The furnace was turned off and allowed to cool to room temperature under N2 flow [Fig. S1(c)]. The sample was removed from the furnace after it was cooled to room temperature for characterization.
MWCNTs were also synthesized using cellulose powder as the carbon source and iron nanoparticle as the catalyst. An alumina Anodisc of 25 mm in diameter with pores of 100 nm was immersed in an iron nanoparticle solution of 2 mM. The iron nanoparticles were coated on the walls of the Anodisc pores by vacuum filtration. A solution of 0.1183 g of methyl cellulose in 5 mL of nanopure water was then filtered through Anodisc coated with iron nanoparticles. Anodisc embedded with cellulose was allowed to dry at 80 °C for 10 min. The dried Anodisc sample was subjected to thermal treatment by increasing the temperature from room temperature to 900 °C under the flow of N2 gas. The nanotubes were characterized using SEM after the alumina support was dissolved in 1 M NaOH.
III. RESULTS AND DISCUSSION
Graphene and carbon nanotube production from various precursors have been reported in the literature.Reference Zhu, Murali, Cai, Li, Suk, Potts and Ruoff30 An inexpensive and renewable source such as cellulose as a carbon source has drawn attention for the preparation of graphitic films.Reference Herring, McKinnon, McCloskey, Filley, Gneshin, Pavelka, Kleebe and Aldrich31 Few examples of use of cellulose-based materials as carbon source are also reported. Flower petals of Hibiscus tree, lotus petals composed of cellulose, hemicellulose, and lignin were utilized as a precursor for the synthesis of high-quality graphene by the thermal exfoliation process.Reference Ray, Chatterjee, Singh and Bapari32 Carbon nanospheres and GO quantum dots were produced by microwave-assisted hydrothermal degradation of cellulose and waste paper in the presence of the Ni catalyst.Reference Adolfsson, Hassanzadeh and Hakkarainen33 Production of activated carbon was also reported wherein the electrodes for supercapacitors were fabricated from wood source through a thermocatalytic synthesis with NaOH activator.Reference Volperts, Dobele, Zhurinsh, Vervikishko, Shkolnikov, Ozolinsh, Mironova-Ulmane and Sildos34
The present work investigates the feasibility of producing large area high-quality thin graphene films utilizing cellulose-based materials as a starting material for functional device fabrication. We systematically investigated the effect of synthetic conditions including reaction temperature and time, and catalyst on the quality of synthesized graphene films. The control studies were performed without catalyst demonstrating the importance of the catalyst for the synthesis of high-quality thin graphene films. These results confirmed that large area high-quality free-standing graphitic films can be grown on substrates for functional device fabrication.
A. Temperature-dependent HRTEM and SAED analysis
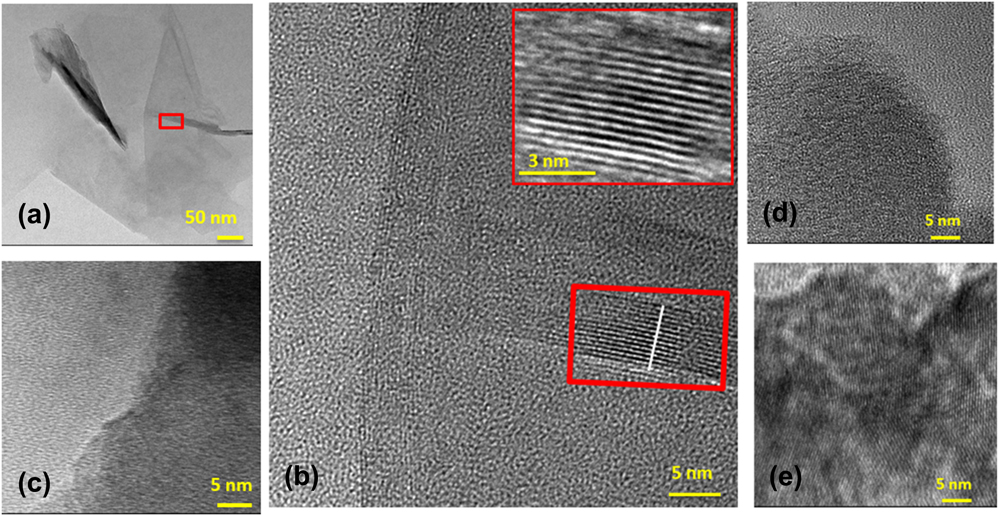
Graphene quality and crystallinity as a function of the synthetic temperature in the 600–900 °C range was studied using HRTEM. The HRTEM fringe patterns of graphene flakes grown at 600 °C ≤ T ≤ 900 °C confirmed significant structural and chemical transformation from amorphous carbon to defect-free crystalline graphene at 900 °C (Fig. 1). The HRTEM of graphene samples grown at lower temperatures (T = 600 and 700 °C) lacked ordered lattice fringes indicative of absence of amorphous carbon in the sample. The samples grown at T = 800 °C depicted some ordered fringes in the HRTEM analysis [Fig. 1(e)]. In the presence of the Fe catalyst, these results suggested that the carbonized residues transformed from amorphous carbon when grown at T = 600 and 700 °C into partially crystallized form at T = 800 °C and to a highly ordered atomic arrangement of graphene grown at T = 900 °C [Fig. 1(b)]. The individual graphene sheets were imaged at the edge fold where crystalline graphene plane diffracted electrons and appear as dark lines in the phase contrast image.Reference Meyer, Geim, Katsnelson, Novoselov, Booth and Roth35 The atomic columns of carbon were clearly seen as dark lines. The bright lines represented the interplanar distance of 0.335 nm in our experiments, which agrees well with the literature.Reference Shih, Vijayaraghavan, Krishnan, Sharma, Han, Ham, Jin, Lin, Paulus, Reuel and Wang36 The HRTEM image of the folded edge of the graphene flake taken from the rectangle area possessed 13–14 graphene layers (∼5 nm) as estimated based on the spacing between each dark layer [inset of Fig. 1(b)].Reference Wang, Yang, Park, Gou, Wang, Liu and Yao37 The presence of a peak at 270 nm in UV-Vis spectroscopy also confirmed the presence of high-quality graphitic structures in the sample [Fig. S1(e)]. Overall, these results suggested that the processing temperature is critical in our experiments for the synthesis of defect-free graphitic films at large-scale.
HRTEM imaging of graphene films synthesized at different temperatures. (a) TEM of a graphene flake synthesized at 900 °C. The rectangle box in the image shows the area from where the HRTEM image was acquired. (b) HRTEM of the graphene flake of the red box area in (a) showing highly organized carbon atomic columns in the graphene sample synthesized at 900 °C. The HRTEM image of the graphene flakes grown at 600 °C (c), 700 °C (d), and partially ordered carbon atomic columns containing graphene samples grown at the synthetic temperature ∼800 °C (e).

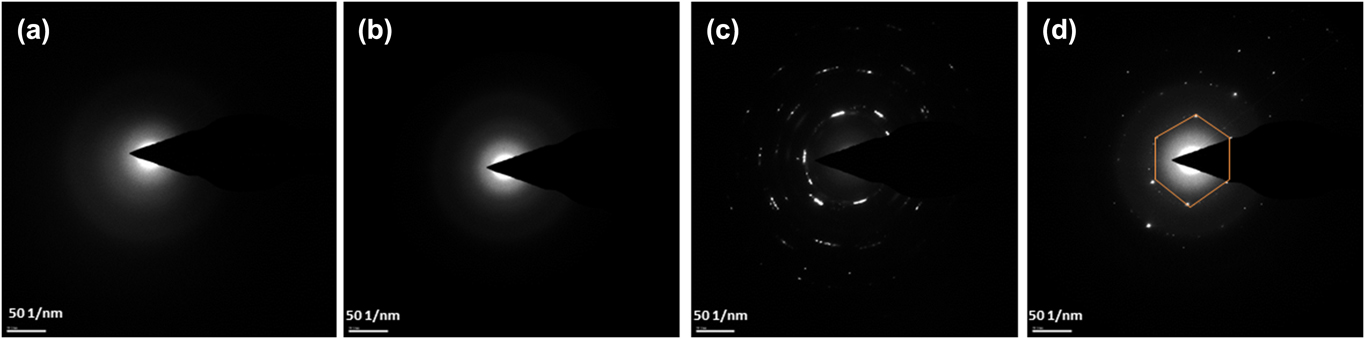
SAED characterization was performed on the samples grown at 600 °C ≤ T ≤ 900 °C. The SAED patterns of the graphitic films synthesized at T = 600 and 700 °C [Figs. 2(a) and 2(b)] exhibited unresolved diffusive diffraction rings confirming the amorphous nature of the samples. The SAED of the graphene produced at T = 800 °C displayed a semicrystalline pattern demonstrating the phase transformation from amorphous carbon to crystalline carbon is likely initiated at T ∼ 800 °C [Fig. 2(c)]. The SAED of the samples produced at T = 900 °C revealed a well-defined hexagonal diffraction array [highlighted hexagonal area in Fig. 2(d)], suggesting that a completely crystalline graphene was formed at a synthetic temperature T = 900 °C. The multiple diffraction patterns represent the presence of more than one layer of graphene in the sample. The d-spacing ∼0.33 nm was estimated from SAED patterns of graphene synthesized at 900 °C using
 $$R \times d = \lambda \times L$$
Here, R = 2 mm is the radius of the diffraction pattern in Fig. 2, d is the lattice spacing, λ is the wave length of the electrons (0.0033 nm), and L is the camera focal length (200 mm). The experimental interplanar distance of 0.33 nm is close to the theoretical value of 0.335 nm for graphitic lattice reinforcing the presence of defect-free graphitic carbon in the films [Fig. 2(d)].
SAED of graphene grown at 600 °C (a), 700 °C (b), 800 °C (c), and 900 °C (d). The diffraction patterns collected at a camera focal length of 200 mm illustrated the phase transition of graphene from amorphous to crystalline as the temperature was increased from 600 to 900 °C. The d-spacing estimated in (d) was 0.33 nm which is close to the theoretical value for graphitic carbon.

B. Raman spectroscopy characterization
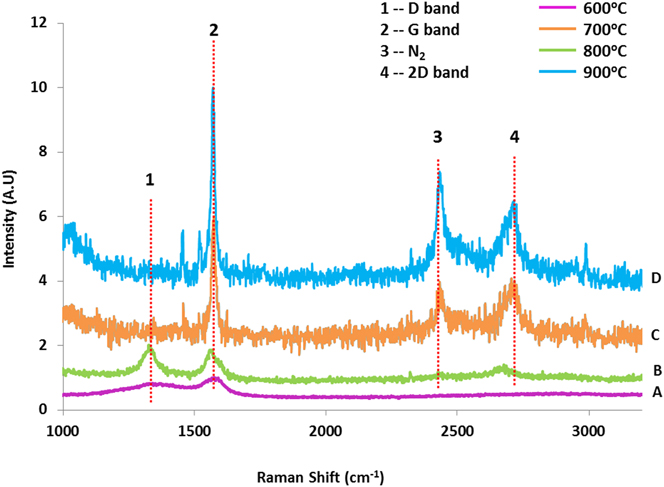
To further evaluate the effect of temperature on the quality and crystallinity of the graphene synthesized, we analyzed graphene samples using Raman spectroscopy. Raman spectroscopy is a powerful technique for the characterization of the graphene-based materials. Figure 3 shows Raman spectra of the graphene films grown at four different temperatures using a laser excitation of 532 nm. In general, the stokes-phonon energy shift caused by laser excitation of the graphene consisted of three main peaks at 1320, 1570, and 2680 cm−1.Reference Malard, Pimenta, Dresselhaus and Dresselhaus38 These peaks correspond to the D-band, G-band, and 2D-band respectively. Whereas the G-peak corresponding to the stretching vibrations of sp 2 carbon atoms in graphene, the D peak relates to the breathing mode of sp 2 carbon atoms in rings containing defects (nongraphitic carbon). The 2D band is associated with double phonon scattering either from electron–electron or electron–hole or hole–hole pair.Reference Casiraghi, Hartschuh, Qian, Piscanec, Georgi, Fasoli, Novoselov, Basko and Ferrari39 It is also referred to as an overtone of the D band, but it does not necessarily represent defects in the lattice structure.Reference Saito, Hofmann, Dresselhaus, Jorio and Dresselhaus40 2D band can also be seen in highly ordered samples even in the absence of D band in the Raman spectrum.
Raman spectra of the samples synthesized at four different temperatures: 600 °C (A), 700 °C (B), 800 °C (C), and 900 °C (D). In A and B spectra, disordered (D), graphitic (G), and overtone (2D) peaks at 1320, 1570, and 2680 cm−1, respectively, were observed. The spectra C and D exhibited narrower and sharper G peaks compared to those in A and B. In (C) and (D), the intensity of the D peak for the samples synthesized at 800 and 900 °C was below the signal-to-noise ratio of our instrument. FWHM of the G peak reflects the quality of the graphene in the samples. Narrower G band indicates the narrow distribution of graphitic crystals in the samples.

Temperature-dependent distribution of defects in our samples was estimated from the full-width-half-maxima (FWHM) of G peaks and the intensity of G and D peaks. The FWHM of the G peak was found to decrease with the synthesis temperature, indicating narrow and/or more uniform distribution of the crystallite size in the samples synthesized at T = 800 and 900 °C (Fig. 3 and Table I). It was obsevered that the thin graphene films synthesized at T = 600 and 700 °C predominantly possessed disordered graphitic carbon. Whereas the peak intensity ratio of D and G peaks [referred as (I G/I D)] in the multilayer graphene samples synthesized at T = 800 °C indicated a much lower defect density, the graphitic samples obtained at T = 900 °C were almost defect-free (Fig. 3).
FWHM of D and G peaks at four different temperatures.

a Peak intensity was below the S/N of the instrument.
S. Knight and W. White experimentally showed that (I D/I G) and defect density in the graphene samples are related as followsReference Capasso, Dikonimos, Sarto, Tamburrano, De Bellis, Sarto, Faggio, Malara, Messina and Lisi41:
 $${L_{\rm{D}}} = C'\left( \lambda \right){\left( {{{{I_{\rm{D}}}} / {{I_{\rm{G}}}}}} \right)^{ - 1}}\quad ,$$
where L D is the average distance between defects, C′ (λ) is (2.4 × 10⁻¹⁰ nm−3) × λ4,Reference Cançado, Takai, Enoki, Endo, Kim, Mizusaki, Jorio, Coelho, Magalhães-Paniago and Pimenta42 and I D and I G are the integrated intensity of D and G peaks, respectively. The L D values of graphene synthesized at T = 900 °C were estimated using Eq. (2) in our experiments increased from 24 to 44 nm.
The number of graphene layers (n) in the sample was also estimated by Ferrari from the FWHM of the 2D peak.Reference Ferrari43 A monolayer graphene (n = 1) was found to exhibit a single sharp 2D band with FWHM and I 2D/I G ∼ 30 cm−1 and ∼3, respectively.Reference Koh, Foong and Chua44 Ferrari showed that the 2D FWHM of the graphene films increases with n. Because of the appearance of a shoulder in the 2D Raman peak, the FWHM appears to depend upon n. With 514 nm laser excitation for the Raman spectrum, the 2D peak exhibited a sharp singlet to a broad peak with a shoulder for n = 5 samples.Reference Ferrari43 The graphene sample with n = 10 layers showed a very distinct clear shoulder in the 2D Raman peak. The FWHM of the 2D peak in the graphene films synthesized at T = 800 °C and 900 °C were ∼48 cm−1 and 70 cm−1, respectively, and the I 2D/I G ratios for these samples are 0.62 and 0.66, respectively. The Raman spectrum of a graphene film sample synthesized at T = 900 °C possesses a broader peak but without a clear shoulder in it [Fig. 3(d)]. Comparing the Raman results of the graphene films synthesized at T = 900 °C in our studies with those of FerrariReference Ferrari43 suggests that our graphitic samples are unlikely a monolayer graphene thick but are likely to contain n > 2 but n ≤ 10 layered graphene layers. Overall, both the FWHM and I 2D/I G values of the Raman spectra suggested multilayer graphene (2 < n = 10) in the sample.
C. XRD characterization of the graphitic films
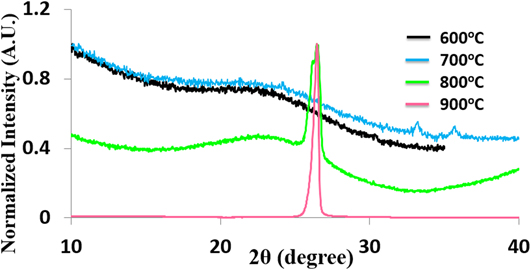
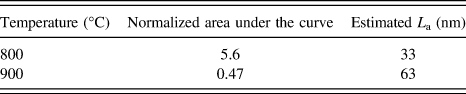
XRD provided important structural transformation information of cellulose to graphitic films through the thermal treatment. The XRD spectrum of cellulose powder showed two distinctive peaks at 2θ–8° and ∼19° [Fig. S3(a)]. The peak 2θ–19° corresponds to polymeric chain packing of cellulose through van der Waals forces,Reference Rodrigues Filho, da Cruz, Pasquini, Cerqueira, de Souza Prado and de Assunção45 whereas the 2θ–8° peak occurs in amorphous polymers due to the existence of regions with aggregates of segments of parallel chains.Reference Rodrigues Filho, de Assunção, Vieira, Meireles, Cerqueira, da Silva Barud, Ribeiro and Messaddeq46 In agreement with HRTEM, Raman, and SAED measurements, the XRD patterns of the graphene films also suggested the structural progression of amorphous carbon to highly ordered crystalline graphene with an increase in the synthetic temperature (Fig. 4). Predominately, amorphous carbon structures were obtained for samples synthesized at T < 800 °C as evidenced by broad XRD scattering peaks. For samples synthesized at T = 900 °C, a sharp peak at 2θ–26.5° corresponding to a basal spacing d 002 = 0.334 nm was observed. Furthermore, the FWHM of the diffraction peak at 2θ–26.5° was found to decrease with an increase in T. The normalized area under the peak at 2θ–26.5° is given in Table II. As a control experiment, the thermal treatment of the cellulose at T = 900 °C in the absence of the catalyst exhibited a broad peak indicating disordered amorphous carbon in the samples [Fig. S3(b)]. The amorphous peak of nongraphitized carbon obtained in the absence of the catalyst at T = 900 °C is similar to the amorphous carbon grown at T = 600 and 700 °C but in the presence of the catalyst. These experiments emphasize the importance of both the catalyst and reaction temperature for obtaining high-quality defect-free thin graphene films of larger area.
XRD patterns of graphitic samples prepared at four different temperatures. XRD patterns of the samples synthesized in the presence of catalysts at 600 °C (black) and 700 °C (blue) displayed a broad peak between 2θ of 20° and 30°. The two peaks for the sample synthesized at 2θ–33° and 35.5° were from the iron catalyst. The XRD pattern of graphene synthesized at 800 °C (green) elucidated transformation from amorphous (broad peak) to crystalline carbon (sharp peak) at 2θ–26.5°. The single sharp peak at 2θ–26.5° from the samples synthesized at 900 °C represented a well-ordered crystalline graphene in the sample.

Area under the curve and estimated L D based on XRD analysis of thin graphene films synthesized at different temperatures.

The size (L D) of the graphitic crystals was estimated using Scherrer equation.Reference Drits, Srodon and Eberl47
 $${L_{\rm{D}}} = {{0.94\lambda } \over {\beta \cos \theta }}\quad ,$$
where λ is the X-ray wave length (0.154 nm), β is the FWHM of graphene peak (unit less), and θ is the graphene peak position in the XRD spectrum.Reference Patterson48 The L D of the nanocrystalline multilayer graphene samples synthesized at T = 800 °C and 900 °C were estimated to be 33 nm and 63 nm, respectively (Table II). Interestingly, the estimated L D obtained from the XRD were larger than those obtained from Raman spectra. This is because XRD weighs more to larger crystals, whereas Raman analysis underestimates L D due to dominant smaller crystals. The presence of sharp XRD peaks in XRD and that of lattice fringes and hexagonal diffraction patterns in HRTEM and SAED, respectively, are consistent with Raman data, confirming that the formation of high-quality thin large area graphene films were produced at 900 °C.
D. In situ graphene growth TGA analysis
In the literature, FTIR, in situ TGA, and TEM analysis have been used to explore the mechanism of cellulose transformation into graphitic carbon utilizing the iron catalyst.Reference Casiraghi, Hartschuh, Qian, Piscanec, Georgi, Fasoli, Novoselov, Basko and Ferrari39,Reference Tang and Bacon49 We investigated the graphitization mechanism of cellulose to crystalline graphene films using TGA. A sample containing a mixture of cellulose and Fe3O4 was ramped in TGA from T = 23 °C to T = 800 °C at 20 °C/min under the flow of N2 gas. The TGA of the mixture showed two decomposition steps (Fig. S4). Under these conditions, the degradation of cellulose appeared to occur in the 200–380 °C temperature range. The degradation of cellulose involves two steps, i.e., dehydration and depolymerization of the cellulose chain.Reference Tang and Bacon49 Dehydration takes place through the loss of cellulose’s hydroxyl groups and results in formation of sp 2 hybridized carbon intermediates.Reference Scheirs, Camino and Tumiatti50 As shown in Fig. S4, the decomposition of cellulose resulted in ∼50% of total weight loss was observed when the sample was heated to T = 337 °C. Above this temperature, the depolymerization of monosaccharide derivatives occurred where thermal cleavage of glycosidic linkage initiated and catalytic carbonization of cellulose into graphitic carbon occurred.Reference Shafizadeh and Bradbury51 A second step corresponding to carbothermal reduction of Fe3O4 to Fe(0) was observed at 610 °C (Fig. S4). In this step, iron oxide was reduced by carbon yielding elemental Fe and CO2 [Eq. (4): Fe3O4 + 2C → 3Fe + 2CO2].Reference Krivoruchko and Zaikovskii52 The elemental catalyst may migrate through the cellulosic matrix.Reference Sevilla and Fuertes53 From our TGA data, the observed 90% mass loss of the solid precursor was resulted from depolymerization of cellulose chains and those through cellulose decomposition into volatile species. This mechanism of transformation of cellulose into graphitic carbon agrees with our HRTEM, Raman, XRD, and SAED analysis.
Based on these observations, Glatzel et al. proposed a mechanism for the conversion of cellulose to defect-free graphitic carbon, which is believed to occur in the present studies.Reference Glatzel, Schnepp and Giordano24 According to them, first conversion of iron nitrate to iron oxide nanoparticles occurred which were then reduced to iron-containing nanoparticles (perhaps, Fe3C nanoparticles). The dissolution of the cellulosic carbon into nanoparticles allowed formation of high-quality graphene nanostructures. A similar mechanism involving dissolution and precipitation for the Fe/C system is known for carbon nanotube formation.Reference Jiang, Feng, Liu and Fan54 Interestingly, the graphitic powder can be made magnetically active by increasing the Fe concentration during the fabrication step. Please see Movie S1 for more details where the graphitic powder was magnetically moved in a circular motion on a stirrer plate.
E. Design, fabrication, and characterization of PV cell using graphene films
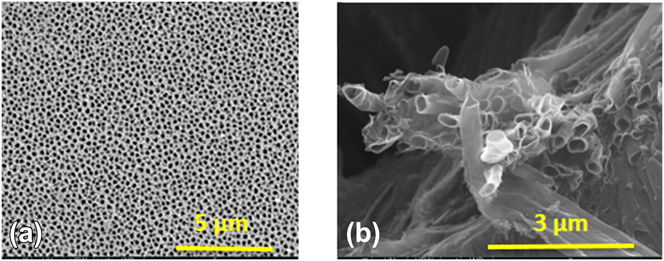
We utilized large-scale high-quality ultra-thin graphene films for the fabrication of functional PV devices. The idea for the fabrication of functional device was to fill the pores of the quartz frit or Anodisc membranes with a mixture of cellulose and catalyst. The thermal treatment of the sample at 900 °C under the flow of N2 gas for 20 min yielded multilayer graphene thin films at the top and bottom surfaces of the membranes. MWCNTs were also formed inside of the nanopores during synthetic treatment. Electrically conductive graphene and MWCNTs embedded in the substrate acted as one of the conducting electrodes for the fabrication of PV devices. The SEM images of the samples prepared in the alumina membrane template using the same growth procedure are shown in Fig. 5. MWCNTs and graphitic films were released from the alumina membrane by soaking the membranes in a 3 M NaOH solution for 10 min at room temperature.Reference Hulteen and Martin55 For the PV cell fabrication, the quartz frit was utilized because it provided mechanical stability for the devices after thermal treatment which was lacked in alumina-based devices. After the formation of graphene and MWCNTs in the quartz frit, a mixture of poly(3-hexylthiophene) (P3HT) and PCBM was deposited through dropcast. Finally, ∼40 nm thin layer (measured using AFM) of Au/Pd alloy was deposited via sputter coating. The Au/Pd layer acted as a second electrode completes the device fabrication process. The SEM images of the graphitic structures synthesized at 900 °C are shown in Fig. 6(b). The MWCNTs’ wall thickness was ∼10 nm [Fig. 6(b)]. The average length and outer diameter of MWCNTs were 6 μm and 200 nm, respectively [Fig. 6(b)]. The energy dispersive spectrum collected at the cross section of an etched aluminum membrane containing MWCNTs showed elemental composition of C and Fe from CNTs; Ag and Au from conductive metal coating on the film; and Al from the alumina template [Fig. S6(b)]. The table in Fig. S6(b) shows semiquantitative weight and atomic percentage of different elements present in the rectangular SEM area in Fig. S6(a).
(a) Schematic presentation of the PV device fabrication in a porous quartz frit. (b) Filling pores with a mixture of cellulose and catalyst followed by thermal treatment yielded graphene and MWCNTs. (c) Deposition of the P3HT:C60 active material within the graphitic nanotubes. (d) Formation of a second electrode to complete PV cell whose performance was characterized using I–V curves.

(a) SEM image of a porous alumina (Anodisc) used for template synthesis of graphitic structures for the fabrication of the PV devices. (b) SEM images of MWCNTs with an outer diameter and wall thickness of ∼200 nm and ∼10 nm, respectively. The wall thickness of 10 nm corresponds to n ∼ 30. Alumina was dissolved in 3 M NaOH to release the MWCNTs for characterization.

F. Photo-electrical characterization
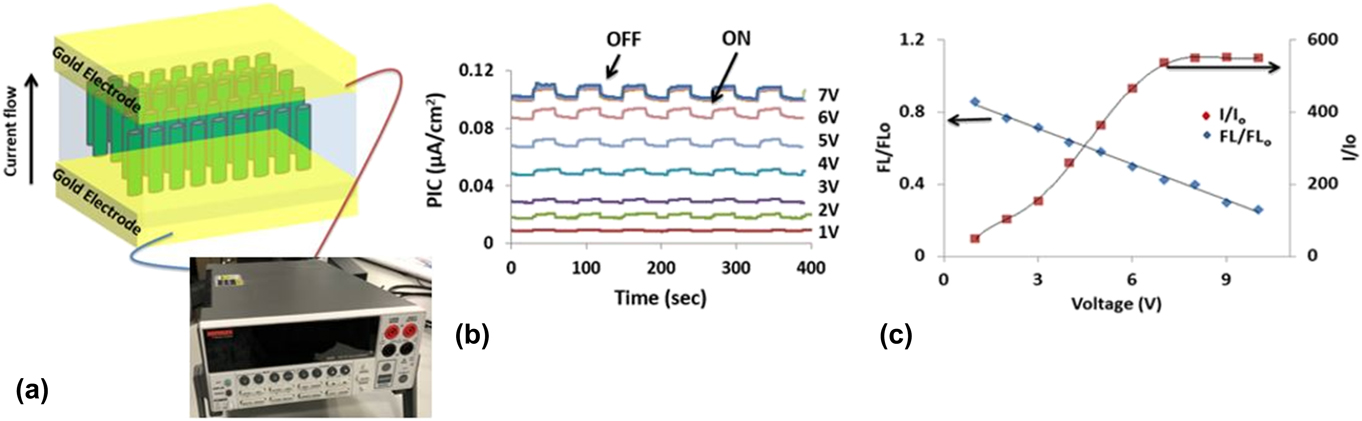
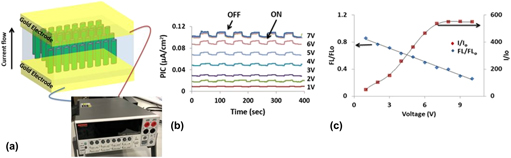
Figure 7(a) shows a schematic of a two-electrode photodetector fabricated using graphene films synthesized in our studies. Figure 7(b) plots the photo-induced current (PIC) as a function of time. The ON and OFF in Fig. 7(b) represent the photo-induced and dark current, respectively. Consistent dark and PIC values were evaluated for more than 20 cycles (only seven cycles are shown) with applied potential ranging between 0 and 10 V. Figures 7(c) and S7(a) show PIC-V dependence of the photodetector fabricated on a quartz frit containing graphitic materials. The applied potential across two electrodes resulted in dissociation of excitons to negative and positive charges which migrated to respective electrodes. Overall, the PIC increased linearly from 9.4 to 110 nA (>10 times) when V was increased from 1 to 10 V [Fig. 7(c)] with PIC was found to become saturated for V ≥ 7 V. Simultaneous emission and PIC measurements on thin graphitic film-based photodetectors allowed us to investigate the effect of V on PIC in our devices [Fig. 7(c)]. In these experiments, an increase in V enhanced the exciton dissociation before the charge recombination resulted in increased photon emission. FL0 and FL represent the fluorescence emission intensity in the absence and presence of applied voltage, whereas I and I 0 were the PIC in the presence (i.e., V = V) and absence (i.e., V = 0 V) of applied voltage [Fig. 7(c)]. For V = 0 V, the exciton recombination dominated the exciton dissociation resulting in a decrease in the PIC, but a concomitant increase in the photon emission intensity was observed for V > 0 V. For example, the intensity of the fluorescence emission peak in solid-state devices was 4 times higher at V = 1 V than that observed at = V = 10 V. However, I/I 0 ∼ 14 at = V = 10 V strongly indicated that the exciton dissociation appears to dominate over the exciton recombination at larger V. These studies also emphasize the utilization of easy to accomplish fluorescence emission experiments under applied voltage for assessing the photo-induced charge generation and transport processes in device physics.
(a) Schematic of a two-electrode photodetector fabricated using graphitic films used for the PIC and fluorescence measurements. (b) Reversible photo-active switching behavior of the P3HT:PCBM composite under applied potential between 1 and 10 V. “ON” and “OFF” represent the light on and off, respectively. (c) Simultaneous solid-state fluorescence emission and PIC measurements as a function of applied voltage (V). The PIC of the P3HT:PCBM composite was increased and fluorescence emission intensity was decreased with an increase in V.

G. Photophysical studies of P3HT:PCBM
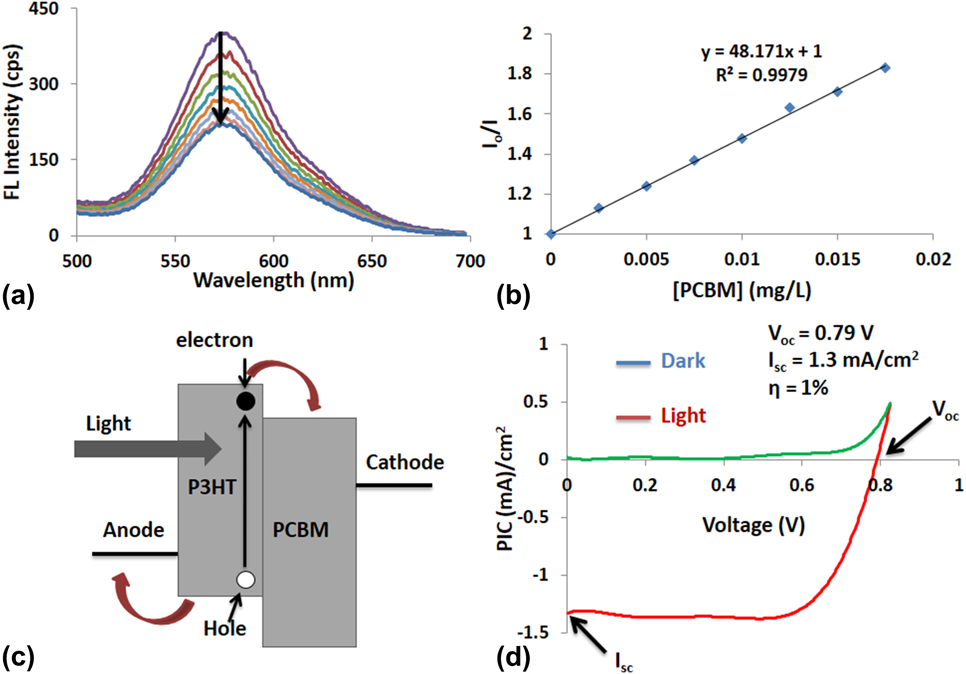
The exciton dissociation is an important step in the photo-induced electron transfer between donor and acceptor for efficient photon-to-electron conversion in a functional PV cell.Reference Grancini, Maiuri, Fazzi, Petrozza, Egelhaaf, Brida, Cerullo and Lanzani56 To further investigate the photo-interactions between P3HT (donor) and PCBM (acceptor), we titrated P3HT with PCBM and plotted P3HT fluorescence quenching-[PCBM] dependence (Fig. 8). P3HT:PCBM blend is widely used for the PV cell fabrication due to its excellent optoelectronic and electron transfer characteristics.Reference Li, Zhu and Yang57 Figure 8(a) shows quenching of P3HT emission after addition of successive 27 μM of PCBM in each titration step. The Stern–Volmer plot where the fluorescence quenching was measured quantitatively using Stern–Volmer equation I 0/I = 1 + K sv[Q] [Fig. 8(b)].Reference Keizer58 Here, I 0 and I are the fluorescence intensity of the donor in the absence and presence of quencher, K sv is the Stern–Volmer constant, and Q is the quencher concentration. Higher K sv value means efficient emission quenching of P3HT by PCBM. The K sv of our P3HT:PCBM system was 47.6 L/mg, which is ∼40 times smaller than the literature value.Reference Wang, Wang, Moses and Heeger59 The impurity in PCBM is known to affect its quenching efficiency.Reference Kaake, Dang, Leong, Zhang, Heeger and Nguyen60 These impurities also called trap sites may exist at the mid-bandgap energies and may efficiently trap the excited electrons generated in the donor upon photoexcitation. The charge trapping results in nonradiative recombination in the donor and are implicated in the observed reduced electron transport efficiency from the donor to the acceptor.Reference Ohkita, Cook, Astuti, Duffy, Tierney, Zhang, Heeney, McCulloch, Nelson, Bradley and Durrant61 Our results showed significant quenching of the P3HT fluorescence emission after the addition of PCBM in liquid phase experiments. The charge transfer from excited P3HT to PCBM resulted in the reduction of P3HT fluorescence emission intensity. Overall, these results in conjunction with those presented in Fig. 8(c) indicated that the dissociation of e-h pair is efficient in the presence of PCBM.
Fluorescence quenching of the P3HT:PCBM composite in liquid-phase experiments (the solvent was chlorobenzene). (a) Liquid-state emission quenching of P3HT by the addition of 10 μL of 2.5 μg/L PCBM at each addition step. (b) Stern–Volmer plot showing the quenching efficiency dependence on the quencher concentration. The quenching constant K sv ∼ 48 L/μg was estimated from the slope of the I/I 0-[PCBM] dependence. (c) Energy diagram showing the electron transfer phenomena in the P3HT:PCBM system where the photogenerated electron in P3HT transferred from LUMO of P3HT to LUMO of PCBM leading to P3HT emission quenching. (d) Typical I–V curve of the P3HT:PCBM PV cell under AM1.5G illumination from a calibrated solar simulator with an irradiation intensity of 130 mW/cm2.

H. I–V response of graphitic film-based PV devices
Cellulose derived multilayer graphene films (≤10 nm thick) were used as a bottom contact electrode in the fabrication of typical PV cells. The typical photon-to-electron conversion efficiency (PECE) of our devices was ∼1% under AM 1.5 illumination conditions. The I–V curve of a PV cell provided the PECE under the photo-illumination. Figure 8(d) shows a typical I–V curve of a 3D PV device fabricated in Fig. 5. Under dark (without photoexcitation), the PV device behaved like a rectifying diode and with light illumination, the PV behavior improved significantly [Fig. 8(d)]. The I–V curve of a P3HT:PCBM PV device under AM1.5G illumination using a solar simulator with an irradiation intensity of 130 mW/cm2 was collected at a bias between 0 and 1 V. Our device (4 cm2) exhibited V oc and I sc of 0.79 V and 1.3 mA/cm2, respectively. The quality of a PV cell is determined by the fill factor (FF), which provides information about charge losses in the device. The FF of our device was ∼0.76 with typical FF values of PV cells were in the 0.5–0.8 range.Reference Shaheen, Brabec, Sariciftci, Padinger, Fromherz and Hummelen62 The 3D PV devices fabricated using graphene synthesized from cellulose displayed a power conversion efficiency (PCE) compared to reported PCE of 2.5–3% PCE of a similar system that utilized ITO as the anode.Reference Li, Tu, Lin, Chen and Chhowalla63 A slightly lower efficiency of our devices compared to similar systems reported in the literature is attributed to the impurities in PCBM, synthesized multilayer graphene films, and MWCNTs. Impurities in the donor and acceptor can affect charge carrier transport and recombination rates in the devices. The presence of impurities even in low concentrations in ppb are known to exhibit a considerable detrimental effect on the PCE of the device. Both the thin graphene films and MWCNTs contained Fe(0) and/or Fen+, as evident from our EDX data may also contribute to increased charge recombination and/or reduced charge transport in the active matrix leading to a lower PV efficiency in our devices. In future, the fabrication of the PV devices utilizing high purity PCBM and graphene potentially improves the PCE of the graphene film-based 3D PV devices.
In our experiments, we have used thin graphitic films and gold/palladium as two electrodes. The reported ϕtheoretical of graphene is ∼4.5 eV.Reference Giovannetti, Khomyakov, Brocks, Karpan, van den Brink and Kelly64 The experimental ϕ value may depend upon the metal–graphene contact, and the ϕ has been observed to vary between 4.89 and 5.16 eV. Furthermore, doping with metal oxides can also affect the ϕ of the carbon-based electrodes—ϕ in a range of 3.44 and 4.05 eV is reported.Reference Kyas, Fleischhauer, Steinmetz and Wilhelmi65 The ϕ of gold and palladium are ∼5.4 eV and 5.22 eV, respectively, suggesting that the ϕ of the gold/palladium electrode is ∼5.2–5.4 eV.Reference Hölzl and Schulte66 Furthermore, our graphitic films may contain a minute catalytical amount of Fe that may affect the ϕ of the graphitic films. Δϕ between the graphitic film and Au/Pd electrodes provides electric potential differences for PV devices. Large Df yielded enhanced V oc, which is also desirable for providing large electrical potential for the functional devices.
IV. CONCLUSIONS
In conclusion, we describe a green chemistry approach for the synthesis of large-scale highly ordered graphene films using a renewable carbon source (cellulose). We utilized cellulose as a starting material and an Fe-based catalyst at 900 °C allowing us to synthesize large-scale defect-free graphitic films. We performed a systematic study investigating the effect of the synthetic temperature and catalyst on the quality of graphitic films. Our analysis revealed that optimal synthetic temperature of ∼900 °C is critical to obtain high-quality defect-free ultra-thin graphene films and MWCNTs. 3D-functional PV devices were fabricated utilizing the graphitic thin films exhibited V oc, I sc, and PCE of 0.79 V, 1.3 mA/cm2, and 1%, respectively. The proposed method described in this manuscript potentially allow environment friendly cellulose as a carbon source for producing large area high-quality free-standing and substrate-bound graphitic films inexpensively in one-step without a need of reducing atmosphere conditions (such as H2). Overall, this work signifies a readily available starting materials for the synthesis of high-quality graphitic films and functional devices for low-resource countries where sophisticated instrumentation may not be widely accessible. The use of cellulose as a starting material can be significant because of its presence in all parts of the world. Therefore, the work presented in this manuscript is not only useful for transparent electrode applications but also provides detailed framework on materials, parameters, and functional-device fabrication utilizing large area high-quality graphitic films.
Supplementary Material
To view supplementary material for this article, please visit https://doi.org/10.1557/jmr.2018.198.
ACKNOWLEDGMENTS
We would like to acknowledge National Science Foundation (CHE 0748676), Office of Vice-Chancellor of Research, and Office of Sponsored Projects Administration (OSPA) at the Southern Illinois University at Carbondale (SIUC), and NIH (GM 106364) for partial financial support of this research. The scanning electron microscope used in this work was purchased through a grant from National Science Foundation (CHE 0959568). We acknowledge Drs. Jessica R. Terbush, and Eric Bohannan Materials Research Center of Missouri University of Science and Technology at Rolla for running HRTEM, SAED, and XRD measurements.