



Introduction
Why does environmental pollution in China exhibit cyclical patterns? What factors contribute to the periodic emissions of pollutants? This article explores and evaluates the link between China’s Five-Year Plan (FYP) and environmental pollution, proposing that the cycles of the FYP significantly influence pollution trends. This research explores the intersection of political business cycles and environmental policy within the unique institutional context of China’s centralized governance system. We propose a theory of target allocation cycles to explain why local governments initially relax environmental regulations at the beginning of the FYP and progressively strengthen them as the plan progresses. Understanding these cyclical patterns is vital for policymakers and environmental planners aiming to design more consistent and effective strategies for balancing economic growth with environmental sustainability. By identifying the underlying incentives and pressures that drive these cycles, more robust frameworks for environmental governance can be developed to ensure lasting improvements in pollution control and environmental quality.
A large and growing body of work has demonstrated that political business cycles exist not only in established democracies but also in countries going through democratic transitions and even in countries considered to be established autocracies (Nordhaus Reference Nordhaus1975, Alesina et al. Reference Alesina, Roubini and Cohen1997, Baleiras & Santos Reference Baleiras and Santos2000, Drazen Reference Drazen2000, Gonzalez Reference Gonzalez2002, Shi & Svensson Reference Shi and Svensson2006, Guo Reference Guo2009, Blaydes Reference Blaydes2011). Political business cycles are driven by elections and party alternation in democracies as governments pursue expansionary monetary or fiscal policies during election periods in order to win elections. Democratic elections and party rotation both indicate that speculation or opportunism is exhibited by local leaders to signal competence to irrational voters. Another stream of political business cycle scholarship shows that any regular political event could form a political business cycle, not being solely contingent on democratic elections or party rotation. This expands the scope of political business cycle theory to encompass different institutional settings (Tao Reference Tao2006, Nie et al. Reference Nie, Jiang and Wang2013, Xi et al. Reference Xi, Yao and Zhang2018, Fan et al. Reference Fan, Zhang and Wang2022). However, the fundamental logic underlying both streams of scholarship remains consistent: political business cycles stem from the speculation of political officials. In democracies, political officials engage in opportunistic behaviour to secure voter support, while in autocracies, speculation is aimed at signalling competence to higher authorities for potential promotion.
In other words, local officials exhibit similar speculation and selective policy implementation regardless of them being members of distinct political institutions (O’Brien & Li Reference O’Brien and Li1999, Ran Reference Ran2013). It thus becomes imperative to consider other institutional variables to enhance understanding of political business cycle theory. In the context of China, the central government wields considerable authority to formulate a comprehensive national development plan and relies on mechanisms such as promotion incentives and control over officials to achieve planning objectives. It is crucial not to overlook this pivotal institutional arrangement, particularly the FYP in China, which involves long-term target allocation. Developing such insight is crucial as it suggests that cycles are driven by target allocation arrangements rather than the opportunism of officials’ political behaviour.
Schulze (Reference Schulze2021) found that the production of climate policies in democracies tends to increase as elections approach, driven by an uptick in ‘soft’ climate policies such as subsidies and information campaigns. This behaviour contrasts with the more consistent production rates of ‘hard’ policies such as taxes and regulations, indicating a nuanced response to electoral pressures that might parallel China’s handling of environmental policies during the FYP. This dynamic, in which soft policies are favoured before elections to avoid voter backlash while still signalling action, aligns with China’s periodic intensification of environmental regulation towards the end of the FYP cycle as officials respond to the dual pressures of achieving both economic and environmental targets.
The FYP is crucial for understanding China’s target governance approach, as it serves as a central tool for nationwide political and economic development (Heilmann & Melton Reference Heilmann and Melton2013, Mao et al. Reference Mao, Zhou and Corsetti2014, Shi & Xu Reference Shi and Xu2018). The central government formulates overarching policy guidelines and delegates policy objectives and standards to provincial governments (Zhou Reference Zhou2016). These policies are then further distributed to municipal governments, and ultimately local governments are responsible for their implementation. While environmental targets are set in the FYP every 5 years, the specific timing of their implementation within that period is at the discretion of local governments, granting them significant flexibility. For example, in the 11th FYP period (2006–2010), some local governments distributed environmental targets on an annual basis, while others set higher targets for the first or last year of the FYP (Kostka Reference Kostka2013).
Local officials therefore wield discretionary power, typically prioritizing short-term objectives over long-term objectives (Olson Reference Olson1993) and strategically addressing multiple goals with limited attention and search capabilities (Lindblom Reference Lindblom1959). This often results in the sidelining of other priorities initially, with officials only shifting their focus to unresolved matters when pressure mounts in the medium term. This leads to officials focusing their attention on specific areas in the early stages of the FYP, pushing other priorities aside and only beginning to focus on unfinished issues when pressure increases in the medium term. This raises the question relating to when environmental regulation becomes intense or relaxed, prompting the development of target allocation cycle theory to examine cycles in environmental pollution.
Under China’s bureaucratic system characterized by centralization, local leaders are required to balance competing goals and pressures to strategically allocate resources and attention over a 5-year period, resulting in target allocation strategies at different points in time. This involves finding a balance between short-term speculation and stable actions (Zhou et al. Reference Zhou, Lian, Ortolano and Ye2013), giving rise to the target allocation cycle. Hence, we hypothesize that during the FYP environmental pollution exhibits a specific periodic pattern. Local governments tend to initially relax environmental regulation and subsequently strengthen it year by year.
Limited existing research explicitly examines the link between the political business cycle of official tenure and environmental implications. Cao et al. (Reference Cao, Kostka and Xu2019) suggested that career incentives tied to an official’s tenure can create an environmental political business cycle, revealing a U-shaped relationship between a party secretary’s years in office and PM2.5 levels. Shen (Reference Shen2018) distinguished between tenure cycles and lengths, proposing that the tenure cycle drives periodic PM2.5 emissions. These studies imply that incentives may reduce environmental regulation enforcement in the first and last years of an official’s tenure, leading to periodic environmental pollution fluctuations. Nonetheless, the unpredictability and high rotation rate of local leaders’ tenure in China, largely determined by upper-level governments (Eaton & Kostka Reference Eaton and Kostka2014), render tenure as an ineffective indicator of political or policy cycles. Given the substantial flexibility in local leader tenure limits and durations, this paper argues that the FYP is a more convincing variable for explaining China’s target allocation cycle and its environmental impact.
The primary objective of this article is to examine whether environmental pollution exhibits a regular cycle during the FYP period. Therefore, it is important to select reliable measurements for environmental pollution. Building on the methodology employed in He (Reference He2006), Shen (Reference Shen2018) and Cao et al. (Reference Cao, Kostka and Xu2019), this study incorporates both PM2.5 and industrial SO2 emissions indicators for assessing environmental pollution. Public awareness of PM2.5 surged following the clear skies initiative for the 2008 Beijing Olympics, which spurred subsequent air pollution control policies. PM2.5 has been a focal point since the 13th FYP. In addition, industrial SO2 emissions, which represent total emissions from industrial activities, are closely associated with economic activity (Li & Ma Reference Li and Ma2014). These emissions are vital for economic growth, particularly in industrial cities, and they have been a significant indicator since the 11th FYP, reflecting the ongoing challenge facing local governments to reconcile economic development with environmental pollution (Cao et al. Reference Cao, Garbaccio and Ho2009).
Methods
We use the data of 277 prefecture-level cities in China over 17 years (2003–2019) as observation samples to explore the target allocation cycle of environmental pollution in China.
Atmospheric PM2.5 and industrial SO2 were selected as dependent variables to represent environmental pollution. The annual industrial SO2 emissions of 277 cities from 2003 to 2019 were obtained from the China City Statistical Yearbook (National Bureau of Statistics of China 2020). The most recent PM2.5 data for 277 cities from 2003 to 2018 came from Dalhousie University’s Atmospheric Composition Analysis Group, based on global PM2.5 raster data measured by NASA satellites.
We use the time points of the FYP to depict the target allocation cycle. According to the official gazette of the Chinese government, we have collected the release dates of the 10th, 11th, 12th and 13th FYPs. Taking the fourth year of the FYP as the baseline, YP1, YP2, YP3 and YP5, respectively, represent the dummy variables of the first, second, third and fifth years of the FYP. If this year was the first, second, third or fifth year of the FYP, then YP1, YP2, YP3 and YP5 were equal to 1, otherwise they were equal to 0. The selected time period (2003–2019) covers the last 3 years (2003–2005) of the 10th FYP, the two complete FYP cycles of the 11th FYP (2006–2010) and the 12th FYP (2011–2015) and the first 4 years of the 13th FYP (2016–2019).
For control variables, our focus primarily centred on a range of economic indicators, including the urban economic growth rate (gdpr) and GDP per capita (gdppc). To account for the influence of economic structure, population density and employment conditions on environmental pollution, we incorporated additional variables such as the ratio of tertiary industry to GDP (ser), the proportion of secondary industry in GDP (ind), population density (rkmd) and unemployment data (unem).
Furthermore, we introduced the ratio of foreign direct investment in GDP (fdig) to control for the impact of foreign enterprises on environmental protection following Zeng and Eastin (Reference Zeng and Eastin2007). Previous research has demonstrated that local governments with more flexible fiscal resources tend to be more proactive in environmental regulation (Liang & Langbein Reference Liang and Langbein2015). Therefore, we included the percentage of general budget expenditure to GDP as an indicator of fiscal stress (fisg) to account for potential effects in this area. Data for these variables were sourced from the China City Statistical Yearbook (National Bureau of Statistics of China 2020).
Based on Porter and Linde (Reference Porter and Linde1995), who posited that environmental regulations can incentivize firms to enhance their production technology and that technological innovation can reduce environmental pollution and improve environmental governance, we introduced a variable to measure the level of green technological innovation (ino). This variable was obtained from data on the number of invention patents and utility model patent applications filed with the State Intellectual Property Office. We accessed these data directly through the China Research Data Service Platform (CNRDS) ‘green patent GPRD’ database, with green patents defined according to the criteria outlined in the 2010 ‘Green Patent List’ issued by the World Intellectual Property Organization (WIPO).
To further confirm the influence of the FYP on environmental SO2 emissions, we conducted a series of robustness checks. We substituted the FYP dummy variables with an alternative metric. Recognizing the consistent 5-year cycle of the FYP, we introduced a variable named ‘planyear’, which denotes the years remaining in the current FYP cycle. We assigned this variable a value of 5 in the first year of the FYP, decreasing to 1 in the final, fifth year. This coding scheme is designed to reflect the diminishing time local leaders have to meet their objectives before the FYP evaluation period, thus capturing the pressure on local leaders to achieve their priorities during the FYP.
Additionally, in our robustness testing section, we further introduced control variables related to the characteristics of officials, as proposed in the existing literature on the environmental pollution cycle. These variables encompass the relative ages of municipal party committee secretaries and mayors (Liu & Wan Reference Liu and Wan2019), the calculation of a 5-year term for municipal party committee secretaries and mayors and the consideration of whether it was a second term (Cao et al. Reference Cao, Kostka and Xu2019) and variables related to the terms of municipal party committee secretaries and mayors (Shen Reference Shen2018).
To compile data on the political careers of key officials in China’s prefecture-level cities, we gathered information on the age and term of office for mayors and municipal party committee secretaries from official media sources such as the People’s Daily Online (http://renshi.people.com.cn), the Local Party and Government Leaders Database of China Economic Website (http://district.ce.cn/zt/rwk/) and relevant government websites. We code the data according to the month in which they took office. If the term of office in that year was less than 6 months, it was calculated as the following year. When the term of office was longer than 6 months, it was calculated as the current year. The value of the first year of the term of office was 1, increasing year by year as the term of office continued. After calculation and re-coding, we took the term of office as a variable to construct two more variables, namely the term of office of the municipal party committee secretary (sjrq) and the term of office of the mayor (szrq). If the term of office of a local leader exceeded 5 years, the code started again with 1. Then we recorded according to whether it was a second term, and finally we constructed the four variables of the term cycle of the municipal party committee secretary (sjrq_again) and the term cycle of the municipal party committee secretary (szrq_again), and whether it was the second cycle (sjrq_second, szrq_second). For the relative age variable of the local leaders, according to the promotion rule of Chinese cadres, the local leaders of prefecture-level cities essentially lose any chance of promotion when they are more than 55 years old. Therefore, according to the algorithm shown in the literature, we used the difference between the age of officials and 55 years of age at the time of the next transition as the standard to obtain two variables: the relative age of the municipal party committee secretary (sjage_relative) and the relative age of the mayor (szage_relative).
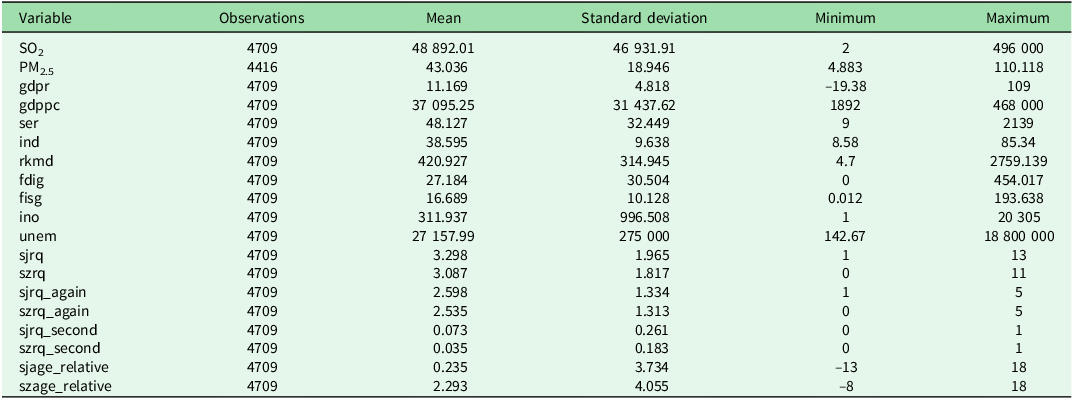
To address outliers and missing values, we utilized a moving average method for interpolation. Descriptive statistics for all variables are presented in Table 1.
Descriptive statistics for all variables (see main text for variable descriptions)
To comprehensively analyse the trends in China’s industrial SO2 emissions and PM2.5 levels throughout the FYP cycle, we employed a panel regression model. Recognizing that the diverse economic and geographical conditions in different cities can impact air quality, we utilized a fixed-effects model, a choice validated through the Hausman test. To address the potential issue of multicollinearity between the introduced fixed time effect and established dummy variables, we took a two-pronged approach. Firstly, we included a comprehensive set of control variables to capture various factors that could influence the outcomes. Additionally, we introduced time trend variables to account for the broader macro-level time effects. The mathematical representation of this approach is as follows:
 $$\eqalign{ & {\rm{S}}{{\rm{O}}_2}_{{{it}}}/{\rm{P}}{{\rm{M}}_{2.5}}_{it} = {{\rm{\beta }}_0} + {{\rm{\beta }}_1}{\rm{YP}}{1_{it}} + {{\rm{\beta }}_2}{\rm{YP}}{2_{it}} + {{\rm{\beta }}_3}{\rm{YP}}{3_{it}} + {{\rm{\beta }}_4}{\rm{YP}}{5_{it}} \cr & \quad \quad \quad \quad \quad \quad \;\, + {\rm{\beta }}{X_{it}} + {\rm{Tren}}{{\rm{d}}_t} + {{\rm{\sigma }}_i} + {{\rm{\theta }}_i} + {{\rm{\varepsilon }}_{it}}\cr}$$
Among these, i represents 277 cities in China, t represents time (2003–2019) and
 ${\rm{S}}{{\rm{O}}_2}$
and
 ${\rm{P}}{{\rm{M}}_{2.5}}$
are the dependent variables as the annual average industrial emissions of SO2 per city entity from 2003 to 2019 and the annual average PM2.5 of each city entity during 2003–2018. YP1–5 is a dummy variable of the FYP time,
 ${\rm{Trend}}$
is a time trend variable,
 ${{\rm{\sigma }}_i}$
and
 ${{\rm{\theta }}_i}$
are the dummy variables of the city and province, respectively, reflecting the fixed effect of the city and province that will not change in a short time period, and
 ${X_{it}}$
is a series of the control variables mentioned above to ensure the robustness of hypothesis verification.
 ${\rm{\varepsilon }}$
is the error term and
 ${\rm{\beta }}$
is a parameter to be fitted. We use the clustered standard errors at the level of the prefecture-level city to ensure the robustness of the model.
To validate the genuine significance of the FYP cycle and eliminate potential alternative explanations, we introduced the aforementioned categories of variables related to local leadership characteristics for examination. More specifically, we took into account the variables concerning the tenures of local leaders. These variables were subjected to robustness tests in the final stage of our empirical analysis.
Results
Environmental pollution cycle of the Five-Year Plan
The average emissions of SO2 and PM2.5 varied by year and FYP (Fig. 1). The years 2006, 2011, and 2016 were, respectively, the first years of the FYPs. Both SO2 and PM2.5 were at high levels and then decreased, which indicates the cyclical characteristics of China’s environmental pollution.
Historical trends in SO2 and PM2.5 for each Five-Year Plan (FYP).
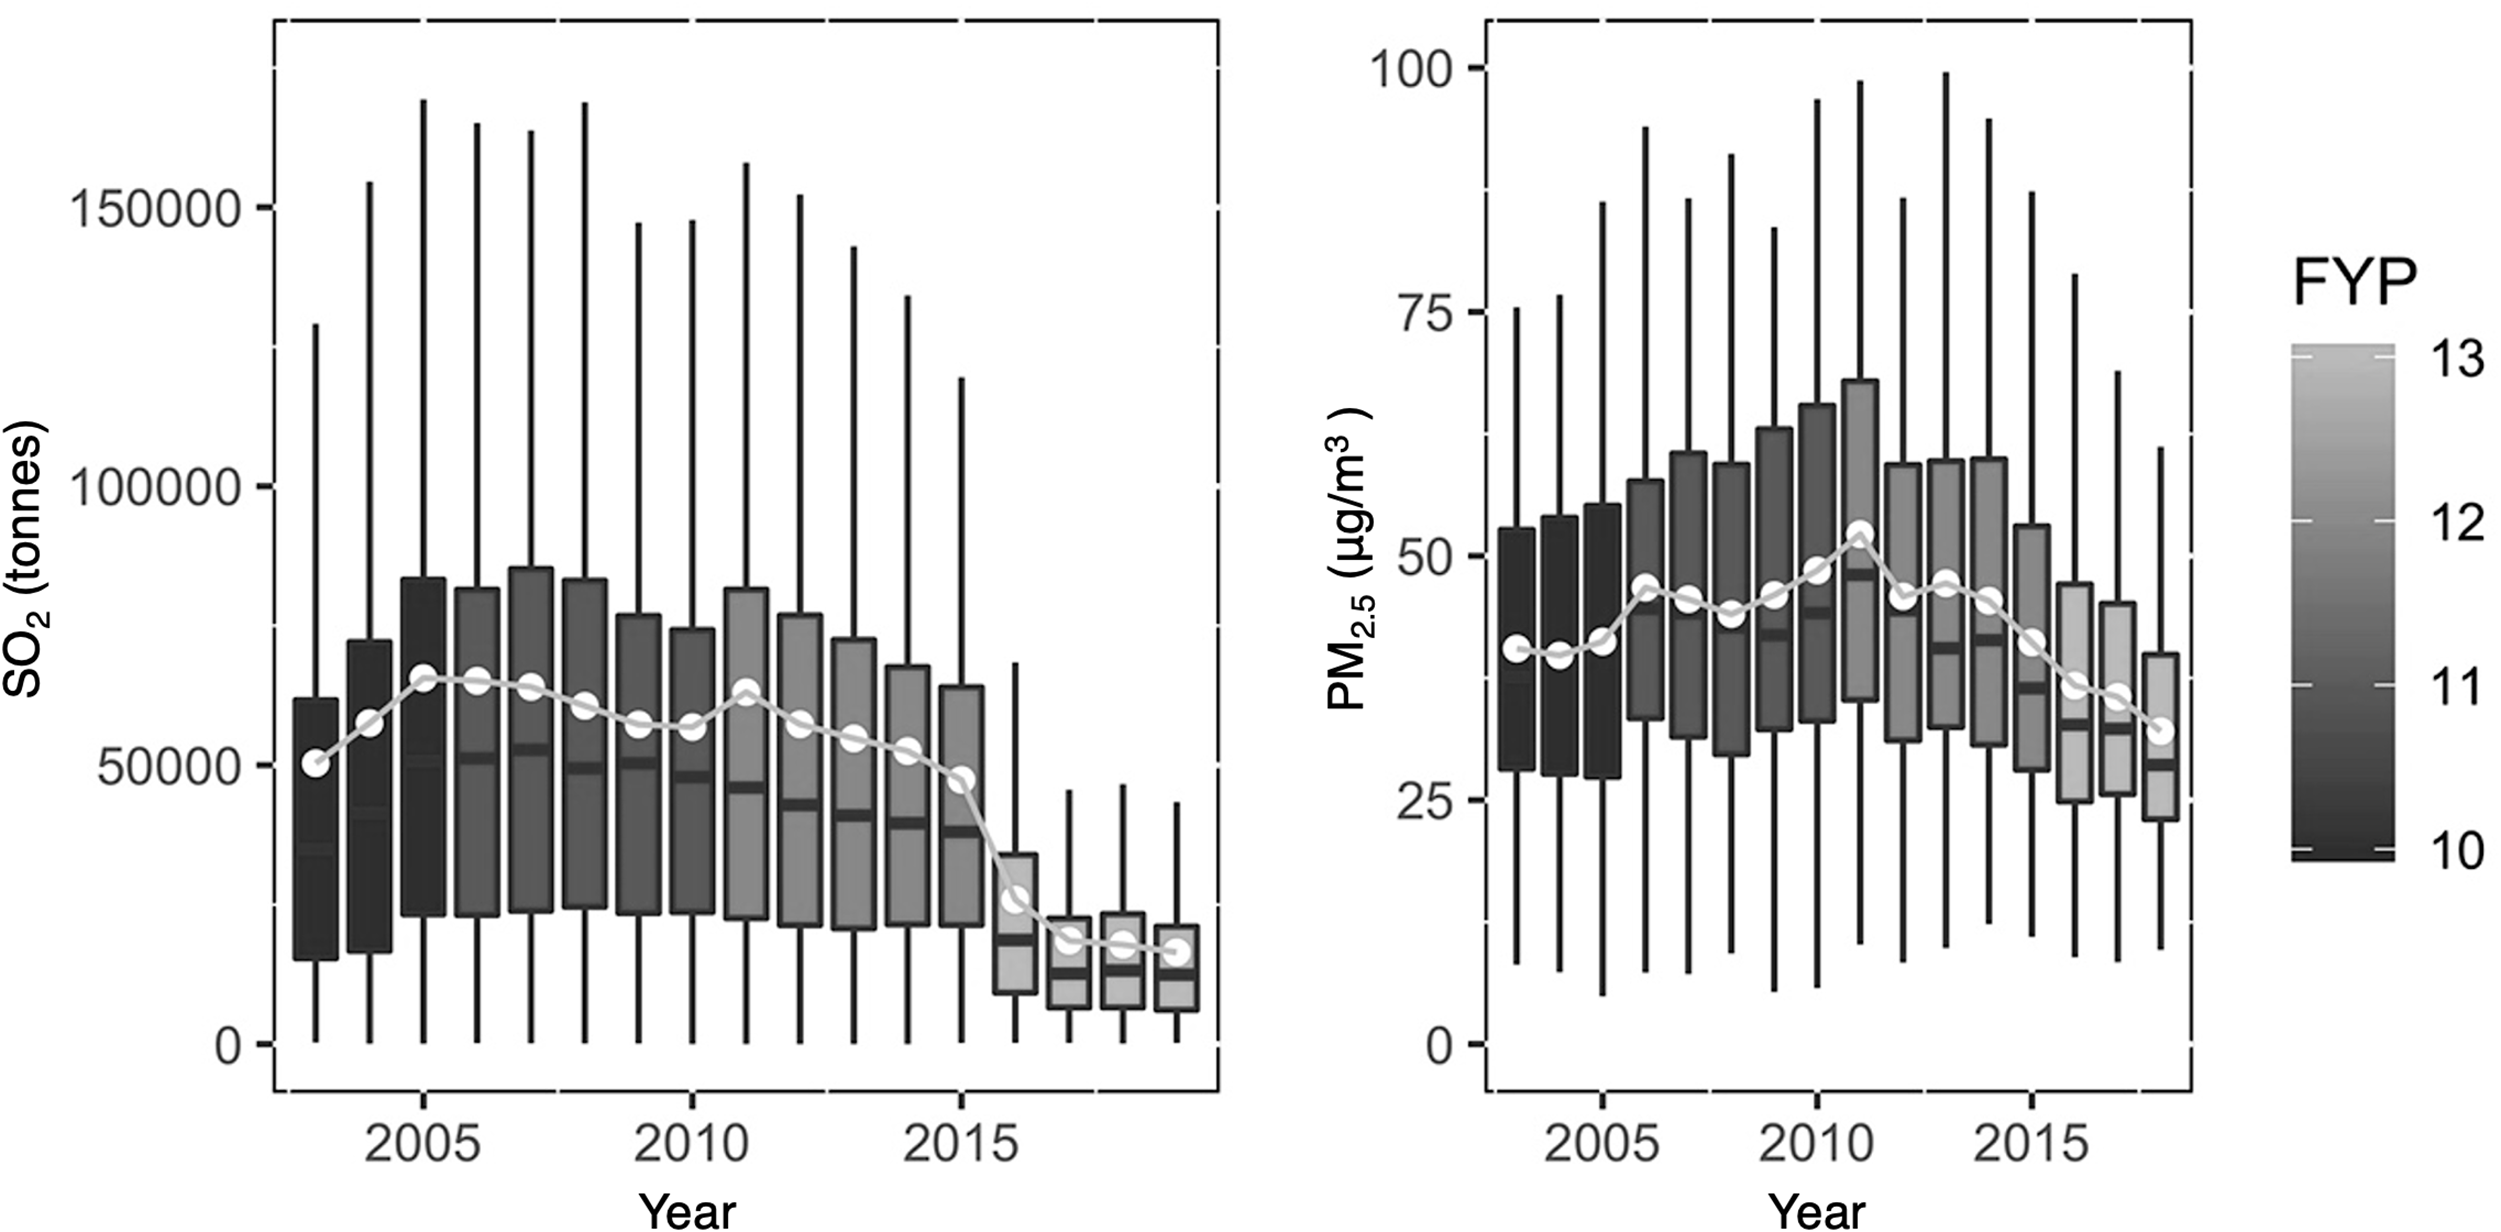
Furthermore, we calculated and plotted the average trends of SO2 and PM2.5 at five time points of the different FYPs from 2003 to 2019. There was a discernible pattern in China’s FYPs concerning environmental pollution (Fig. 2). Specifically, during the initial year following the commencement of a new FYP, there has tended to be a notable increase in pollution emissions. However, as the FYP has progressed and reached its midpoint, a noticeable reduction in pollution emissions occurs, aligning with the objectives of environmental assessment targets. It typically takes c. 3 years after the launch of a new FYP for prefecture-level cities to formulate comprehensive plans within the FYP framework, in alignment with the central government’s objectives extending from the provincial to the local level. Local governments often do not prioritize environmental considerations and face less immediate pressure to meet environmental goals before receiving assessment tasks from higher-level authorities. It is noteworthy that, in the fifth year of the FYP, local governments have tended to exhibit a more relaxed approach to environmental regulation.
Average SO2 and PM2.5 over different Five-Year Plan (FYP) years.

Further evidence of an environmental pollution cycle
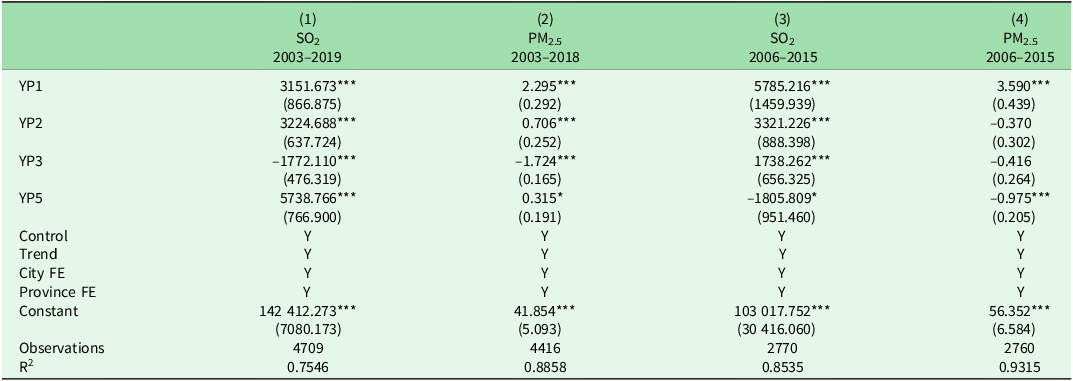
To ensure that the stationarity of variables does not impact the regression outcomes, we conducted both unit root and co-integration tests, following the methodology outlined by Baltagi (Reference Baltagi2008). The test results indicated that our panel data are both stationary and co-integrated. Table 2 provides an overview of the regression analysis results for SO2 and PM2.5 across different FYP cycles.
Basic model analysis results
*p < 0.1, **p < 0.05, ***p < 0.01.
Robust standard errors clustered by city in parentheses. The dependent variable of columns (1) and (3) is SO2 (tonnes), and the sample periods are 2003–2019 and 2006–2015, respectively. The dependent variable of columns (2) and (4) is PM2.5 (μg/m3), and the sample periods are 2003–2018 and 2006–2015, respectively. The control variables include gdpr, gdppc, ser, ind, rkmd, fdig, fisg, ino and unem (see main text for variable descriptions). The models in these columns all control the time trend term (Trend), the city fixed effect (City FE) and the province fixed effect (Province FE).
There has been a significant U-shaped periodic trend in environmental pollution control throughout the FYP period (Table 2, columns (1) and (2)). Specifically, using the fourth year of the FYP as a baseline, both SO2 emissions and PM2.5 concentrations have exhibited cycles. In the initial 2 years of the FYP, SO2 emissions increased by 3151 and 3224 tonnes, respectively. SO2 emissions then decreased, reaching their lowest point in the third year, showing a reduction of 1772 tonnes, before rising again to 5738 tonnes in the final year. PM2.5 concentrations follow a similar pattern, with the highest levels in the first 2 years – increasing by 2.295 and 0.706 μg/m3, respectively. The lowest PM2.5 concentrations occur in the third year, with a decrease of 1.724 μg/m3, and then there is a slight rise to 0.315 μg/m3 in the fifth year of the FYP. This trend suggests that environmental protection has not been prioritized in the early stages of the FYPs. However, as plans progress and the pressure to meet environmental targets increases, local governments increase their focus on environmental protection.
To further validate the existence of the target allocation cycle within two complete FYP cycles (the 11th and 12th FYPs), we narrowed our sample to the period from 2006 to 2015 (Table 2, columns (3) and (4)). A comparison with columns (1) and (2) in Table 2 highlights variations in the regression coefficients of the third and fifth years of the FYPs. The coefficients for SO2 and PM2.5 steadily declined from their peaks in the first years of the FYPs to negative values in the fifth years (YP5). Specifically, SO2 emissions decreased from the peak of 5785 tonnes in the first years of the FYPs to –1805 tonnes in the fifth years, whereas PM2.5 levels decreased from 3.59 μg/m3 in the first years to –0.975 μg/m3 in the fifth years.
These findings further confirm the consistent pattern of decreasing pollution levels year by year after peaking in the first and second years of the FYPs. In the early FYP years, local environmental pollution remains a significant concern, but as the deadline for the FYP environmental target assessments approaches, local governments intensify their efforts regarding environmental protection, resulting in a reduction in environmental pollution. These results underscore the presence of a target allocation cycle in China’s environmental pollution management, which is closely linked to the FYP framework.
Robustness test
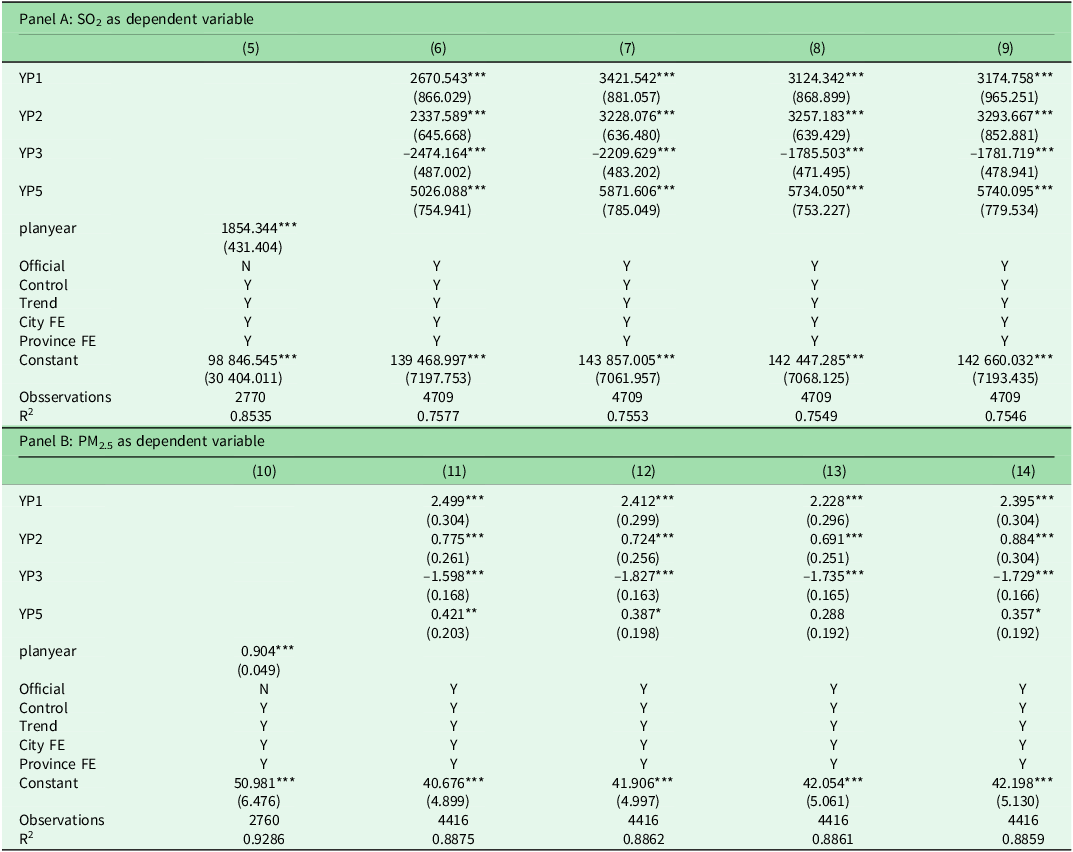
The robustness test confirms that environmental SO2 pollution has exhibited a cyclical pattern during the FYP periods (Table 3, panel A, column (5)). Notably, SO2 emissions reached their peak in the first years of the FYPs and then decreased by 1854 tonnes each subsequent year based on the remaining years of the FYP. PM2.5 levels decreased by 0.904 μg/m3 each year during the remaining years of the FYPs (Table 3, panel B, column (10)).
Robustness tests results of the basic model
*p < 0.1, **p < 0.05, ***p < 0.01.
Robust standard errors clustered by city in parentheses. Panel A considers SO2 (tonnes) as the dependent variable; panel B considers PM2.5 (μg/m3) as the dependent variable. Columns (5) and (10) cover the sample period from 2006 to 2015, whereas the other columns encompass the broader period from 2003 to 2019. Various official-related variables are incorporated in these columns, serving as controls: columns (6) and (11) consider sjrq and szrq; columns (7) and (12) involve sjrq_again and szrq_again; columns (8) and (13) involve sjrq_second and szrq_second; columns (9) and (14) take into account sjage_relative and szage_relative. The control variables include gdpr, gdppc, ser, ind, rkmd, fdig, fisg, ino and unem (see main text for variable descriptions). The models in these columns all control the time trend term (Trend), the city fixed effect (City FE) and the province fixed effect (Province FE).
Regression outcomes with introduced variables related to local leaders’ tenure and personal characteristics as controls align closely with the previous conclusion (Table 3, panel A, columns (6)–(9) and panel B, columns (11)–(14)); thus, China’s FYPs play a substantial role in driving cyclical patterns of environmental pollution, and officials’ decisions regarding the prioritization of other goals versus environmental governance in a given year are contingent on the FYP year.
Discussion
Our empirical findings suggest that local governments exhibit strategic behaviour on environmental pollution topics when managing multiple objectives. Specifically, the emissions of industrial SO2 and PM2.5 display U-shaped periodicity, with peaks in the first and second years of the FYP, followed by a gradual decrease and then a resurgence in the first year of the next FYP. This trend highlights a deliberate target allocation strategy by local leaders, who initially relax environmental regulations at the start of each FYP and subsequently intensify enforcement as the plan progresses.
Our findings resonate with Lindblom’s (Reference Lindblom1959) theory that bureaucrats navigate the complexity of managing multiple objectives within the constraint of limited attention. Similarly, Eaton and Kostka (Reference Eaton and Kostka2014) emphasized the presence of a ‘short time horizon’ amongst local leaders in China, which leads to strategic behaviour. Specifically, failing to achieve environmental policy objectives in the early stages of implementation may generate increasing pressure as deadlines approach, prompting a shift in focus and priorities. This increasing pressure to meet binding environmental targets may exacerbate the cyclical behaviour of local leaders (Kostka & Hobbs Reference Kostka and Hobbs2012), resulting in last-minute, short-sighted actions (Harrison & Kostka Reference Harrison and Kostka2014).
These short-sighted actions reflect the challenges inherent in authoritarian environmentalism and the strategic manoeuvres of officials. While authoritarian environmentalism can effectively respond to immediate threats, its success is often temporary. Once environmental targets are achieved, pollution levels frequently return to their previous states, underscoring the limitations of binding environmental targets (Kostka Reference Kostka2013, Ran Reference Ran2013). Environmental targets set within the FYP do not provide as strong a set of incentives as those aimed at economic development. Officials often prioritize economic growth over environmental objectives, exhibiting a strategic pattern of initially loosening and then tightening environmental regulations.
A significant reason for this strategic behaviour is the intrinsic link between China’s economic development and environmental pollution. (Based on a reviewer’s suggestion, we conducted additional empirical tests on economic development during various FYP periods. We found a positive correlation between economic growth rates and environmental pollution; interested readers may contact us via email to request the empirical results.) Economic development and environmental pollution typically peak in the first 2 years and the final year of each FYP, indicating that economic growth often comes at the cost of the environment and is a strategic focus in the early years of the plan, leading to increased pollution. In contrast, the third year sees a noticeable shift as the momentum for economic growth wanes, aligning with efforts to mitigate environmental pollution. This dynamic underscores the prevalent extensive economic development model in China, which relies heavily on environmental exploitation. This indicates that the strategic alignment of environmental objectives with economic activities during the FYP is direct and consequential.
Our observations are contrasted with other perspectives, suggesting that local governments may not always delay intensifying environmental regulations until the last minute but may instead exert considerable efforts from the beginning. For example, actions such as upgrading factory scrubbers and adopting advanced pollution prevention technologies are common early initiatives (Zhou et al. Reference Zhou, Lian, Ortolano and Ye2013, Eaton & Kostka Reference Eaton and Kostka2014). Some jurisdictions strategically choose not to implement all energy conservation and emission reduction measures simultaneously. In a similar vein, to meet environmental targets officials may invest significant efforts in the early stages of policy implementation, with pressure gradually diminishing after the assessment targets are met (Zhou et al. Reference Zhou, Lian, Ortolano and Ye2013). These contradictory approaches help us to understand why and how local environmental policy implementation may vary. However, the crucial question of when such variations occur is often overlooked: is it possible that environmental regulation can be intense at times and relaxed at others? This is a key aspect that our target allocation cycle theory seeks to address. Local leaders employ strategic resource allocation and attention management to achieve their goals, offering valuable insights into our proposed target allocation cycle of environmental pollution.
Further research demonstrates that local authorities have the ability to tactically adjust the strictness of pollution regulations. Cai et al. (Reference Cai, Chen and Gong2016) showed that local governments can influence the rigour of law enforcement through the collection of pollution fees and the inspection of illegal activities. As a binding indicator for the FYP, two main policies are implemented to reduce SO2 emissions. Firstly, there has been a nationwide shutdown of 50 GW of inefficient and highly polluting small power plant capacity. Secondly, flue gas desulphurization equipment has been installed in both new and existing coal-fired power plants (Cao et al. Reference Cao, Garbaccio and Ho2009). While routine updates such as reinstalling scrubbers are standard pollution control measures, they may not be sufficient to tackle significant environmental pollution from such production. Kostka (Reference Kostka2016) observed that, regarding SO2 targets, monitors are installed primarily by larger companies. However, these monitoring devices are often technologically outdated, unreliable and insufficient in quantity. Consequently, local governments often resort to drastic measures in the middle of the FYP, such as ordering immediate business suspensions and work stoppages, to achieve environmental goals. While the FYP sets broad objectives, these need to be broken down into annual milestones in order to be achievable. Notable examples include the ‘elimination of backward production capacity’ and the ‘closure of small factories’ campaigns in 2010, as well as the air pollution prevention action plan in 2013. Many of these initiatives employed drastic and unconventional measures, including the immediate closure of polluting factories and cutting off of water and electricity supplies.
Conclusion
This paper explicitly challenges the speculative model of political business cycle theory: long-term and stable development planning can also give rise to cyclical patterns. Consequently, we examine the impact of the FYP on environmental pollution: both of the SO2 and PM2.5 variables exhibit U-shaped periodicity. Across different sample periods, local governments ease environmental regulations during the initial stages of each FYP and intensify them after the midpoint of the FYP. Hence, we posit the theory of the target allocation cycle to elucidate how China manages the balance between environmental objectives and economic goals within an authoritarian regime.
This study contributes to the scientific understanding of how political cycles influence environmental governance, particularly in a non-democratic context. By examining PM2.5 and industrial SO2 emissions during the FYP, this paper addresses a significant gap in the literature on environmental policy implementation under China’s unique political and administrative system. The findings are poised to offer insights into the effectiveness of China’s environmental regulations, the strategic behaviour of its local officials and the broader implications of such cycles for sustainable development. Our research has significant implications for assessing the comparative effectiveness of environmental governance strategies and understanding the long-term impacts of these cyclical policies on environmental governance. Insights into local governance dynamics and central mandates further our understanding of the complexities faced by officials in balancing policy implementation with political objectives, particularly under authoritarian regimes.
This study opens several avenues for future research. Comparative analysis of environmental governance in various regimes could verify the presence of cyclical patterns similar to those observed in this study. For instance, examining the intersection of electoral and policy cycles with climate policies, as discussed by Schulze (Reference Schulze2021) in the USA, could illuminate the political impacts on environmental strategies globally. Longitudinal studies could further elucidate the long-term effects of these cycles on sustainable development, exploring the socio-economic factors emphasized by Liu and Lin (Reference Liu and Lin2019). Additionally, examining how public perception and data collection impact policy enforcement and compliance, as shown in studies by Abulude et al. (Reference Abulude, Abulude, Oluwagbayide, Afolayan and Ishaku2022) and on advancements in GIS technology (Filonchyk et al. Reference Filonchyk, Yan and Li2018, Kumar et al. Reference Kumar, Dhakhwa and Dikshit2022), could enhance our understanding of environmental policy effectiveness. These approaches highlight the necessity of integrating macro-political and micro-public dynamics to more effectively navigate the complex interplay of policy, technology and public engagement in environmental governance.
Data availability
The datasets used and/or analysed during the current study are available from the corresponding author on request.
Code availability
Available on request.
Acknowledgements
We extend our sincere gratitude to the reviewers, whose insightful comments and suggestions significantly enhanced the quality of this manuscript. We would also like to express our gratitude to the editors for their diligent work. This meticulous attention to detail and commitment to editorial excellence significantly contributed to the clarity and quality of our work.
Author contributions
The authors contributed equally to this work.
Financial support
None.
Competing interests
The authors declare none.
Ethical standards
None.



