





1. Introduction
The Sun’s interior is filled with a rich spectrum of oscillations (see, e.g., Leibacher et al. Reference Leibacher, Noyes, Toomre and Ulrich1985; Christensen-Dalsgaard Reference Christensen-Dalsgaard2002; Kosovichev et al. Reference Kosovichev, Basu, Bekki, Camilo Buitrago-Casas, Chatzistergos, Chen, Jørgen Christensen-Dalsgaard, Fleck and Fournier2025). These oscillations are driven primarily by pressure forces, and for this reason, they are called acoustic waves or p-modes (see, e.g., Baudin et al. 2005). Much like the ringing of a bell, the Sun resonates with millions of simultaneous vibrations that provide a natural probe into its hidden layers.
1.1 Helioseismology
In a similar way to how geoseismology uses seismic waves generated by earthquakes to study the Earth’s interior, helioseismology relies on the analysis of solar p-modes to infer the internal properties of our star (see, e.g., Goldreich et al. Reference Goldreich, Murray and Kumar1994). By measuring the frequencies, amplitudes, and propagation of these oscillations, it is possible to reconstruct details about the Sun’s structure and dynamics, such as the depth of its convection zone, the rotation profile at different latitudes and depths, and the mechanisms that drive solar activity (see, e.g., Christensen-Dalsgaard et al. 1991; Paternò Reference Paternò2010; Munoz-Jaramillo et al. 2009). Helioseismology has thus become one of the most powerful tools for understanding the physics of the solar interior, where direct observations are otherwise unavailable.
1.2 Helioseismic Holography
Among the advanced methods developed within helioseismology, helioseismic holography stands out as a powerful imaging technique (Lindsey and Braun Reference Lindsey and Braun1997). It enables the reconstruction of solar far-side images by analyzing the phase shifts experienced by acoustic waves as they propagate through and across the solar surface. When p-modes interact with magnetic structures, such as active regions, they acquire distinct signatures that can be detected and measured. By carefully studying these imprinted signals, it is possible to “see” beyond the visible solar photosphere and monitor the development of magnetic activity on the far side of the Sun (Lindsey and Braun Reference Lindsey and Braun2000; Zhao Reference Zhao2007) using helioseismic holography.
Some key points
-
• Acoustic waves travel several times around the Sun due to multiple reflections on the solar surface (see, e.g., Chaplin and Basu Reference Chaplin and Basu2008). By using the phase correlation between two waves that are emitted and absorbed at a point called the focus, located on the far side, the phase shift can be obtained Lindsey and Braun (Reference Lindsey and Braun2000).
-
• From the GONG observations of six stable ARs, it was determined that the relationship between magnetic field strength and the printed signature in the form of a phase shift follows a logarithmic form (see Hernández et al. 2007):
with \[\phi=\phi_1\ln{\left(1+\frac{B}{B_0}\right)}\]
$\phi_1=(-1.41\pm0.03)\times10^{-2}rad$
and
$B_0=9.46\pm0.57G$



2. Methodology
To investigate the relationship between solar Active Regions (ARs) identified on the Sun’s far side via helioseismic holography and their subsequent manifestations on the near side. We follow a data acquisition process, then preprocess each time series, and finally conduct a statistical analysis.
2.1. Data Used
2.1.1. NOAA-Solar Active Region Catalog
The NOAA Center et al. (2003) reports daily on the observable solar active regions from the previous day through the Solar Region Summary (SRSFootnote 1 ), which provides a detailed description of the active regions currently visible on the solar disk.
2.1.2. NWRA- Acoustic Maps of the Solar Far Side
The Helioseismic and Magnetic Imager (HMI) aboard SDO provides high-cadence (45-second) Dopplergrams through its solar observations in the
 $617.8$
nm Fe I absorption line. The continuous series of Dopplergrams is used by Northwest Research Associates (NWRA) and Stanford University to perform helioseismic holography, generating far-side acoustic maps twice a dayFootnote
2
.
2.2. Preprocessing
-
• We extracted the weekly count of new ARs at near side East Lim
-
• The mean of the total far-side’s AR strength by expected appearance week was calculated.
2.3. Statistical Analysis
-
• We performed a time series correlation analysis to account for potential time lags
-
• The Pearson and Spearman correlation coefficients were calculated, and their error was estimated via 10,000 Monte Carlo simulations with varying strength uncertainties.
3. Results
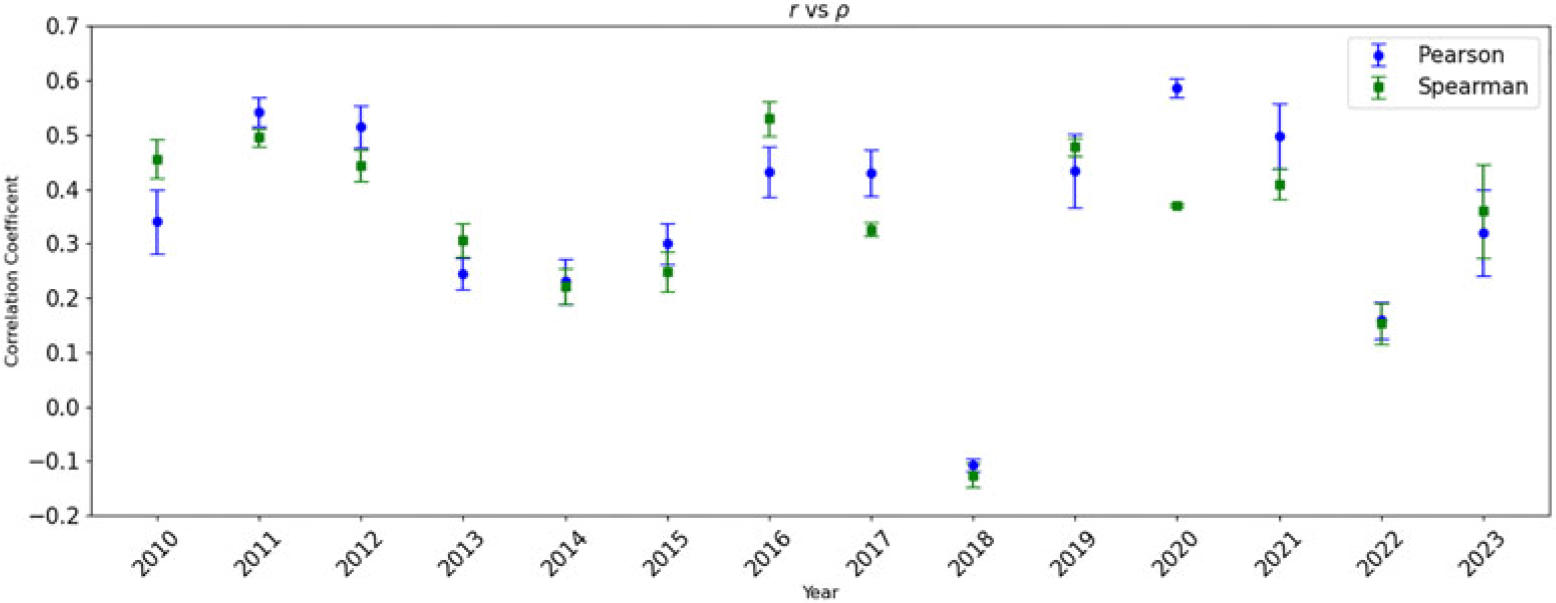
The Pearson and Spearman correlation coefficients are statistically significant for most years; however, they do not indicate a strong correlation. The mean correlation values are
 $r = 0.35 \pm 0.09$
and
 $\rho = 0.33 \pm 0.09$
.
Correlation coefficient by year of the orginal series. Each r was calculated from theNormalized strength of far side’s AR and Number of near side’s AR at east limb.Monte Carlo simulations applying different strength uncertainties.

4. Conclusions
-
• Our correlation analysis between the predicted far-side AR strength and the number of near-side ARs at the east limb reveals a weak but statistically significant relationship, suggesting additional influencing factors.
-
• A key limitation is the assumption that magnetic strength is proportional to the number of ARs, which does not always hold. The use of weekly mean strength may also introduce errors when multiple weak ARs emerge at different latitudes. Observational constraints, including NOAA’s reporting inconsistencies, further contribute to discrepancies.
-
• Refining the method by incorporating projection effects and additional magnetic field constraints could enhance far-side AR detection, improving space weather forecasting and our understanding of solar magnetic activity.
Supplementary material
To view supplementary material for this article, please visit https://doi.org/10.1017/S1743921326106887.


 Open access

