





%20--%3e%3c!DOCTYPE%20svg%20PUBLIC%20'-//W3C//DTD%20SVG%201.0//EN'%20'http://www.w3.org/TR/2001/REC-SVG-20010904/DTD/svg10.dtd'%3e%3csvg%20version='1.0'%20id='Layer_1'%20xmlns='http://www.w3.org/2000/svg'%20xmlns:xlink='http://www.w3.org/1999/xlink'%20x='0px'%20y='0px'%20width='64px'%20height='64px'%20viewBox='5.5%20-3.5%2064%2064'%20enable-background='new%205.5%20-3.5%2064%2064'%20xml:space='preserve'%3e%3cg%3e%3ccircle%20fill='%23FFFFFF'%20fill-opacity='0'%20cx='37.785'%20cy='28.501'%20r='28.836'/%3e%3cpath%20fill='%23595959'%20d='M37.441-3.5c8.951,0,16.572,3.125,22.857,9.372c3.008,3.009,5.295,6.448,6.857,10.314%20c1.561,3.867,2.344,7.971,2.344,12.314c0,4.381-0.773,8.486-2.314,12.313c-1.543,3.828-3.82,7.21-6.828,10.143%20c-3.123,3.085-6.666,5.448-10.629,7.086c-3.961,1.638-8.057,2.457-12.285,2.457s-8.276-0.808-12.143-2.429%20c-3.866-1.618-7.333-3.961-10.4-7.027c-3.067-3.066-5.4-6.524-7-10.372S5.5,32.767,5.5,28.5c0-4.229,0.809-8.295,2.428-12.2%20c1.619-3.905,3.972-7.4,7.057-10.486C21.08-0.394,28.565-3.5,37.441-3.5z%20M37.557,2.272c-7.314,0-13.467,2.553-18.458,7.657%20c-2.515,2.553-4.448,5.419-5.8,8.6c-1.354,3.181-2.029,6.505-2.029,9.972c0,3.429,0.675,6.734,2.029,9.913%20c1.353,3.183,3.285,6.021,5.8,8.516c2.514,2.496,5.351,4.399,8.515,5.715c3.161,1.314,6.476,1.971,9.943,1.971%20c3.428,0,6.75-0.665,9.973-1.999c3.219-1.335,6.121-3.257,8.713-5.771c4.99-4.876,7.484-10.99,7.484-18.344%20c0-3.543-0.648-6.895-1.943-10.057c-1.293-3.162-3.18-5.98-5.654-8.458C50.984,4.844,44.795,2.272,37.557,2.272z%20M37.156,23.187%20l-4.287,2.229c-0.458-0.951-1.019-1.619-1.685-2c-0.667-0.38-1.286-0.571-1.858-0.571c-2.856,0-4.286,1.885-4.286,5.657%20c0,1.714,0.362,3.084,1.085,4.113c0.724,1.029,1.791,1.544,3.201,1.544c1.867,0,3.181-0.915,3.944-2.743l3.942,2%20c-0.838,1.563-2,2.791-3.486,3.686c-1.484,0.896-3.123,1.343-4.914,1.343c-2.857,0-5.163-0.875-6.915-2.629%20c-1.752-1.752-2.628-4.19-2.628-7.313c0-3.048,0.886-5.466,2.657-7.257c1.771-1.79,4.009-2.686,6.715-2.686%20C32.604,18.558,35.441,20.101,37.156,23.187z%20M55.613,23.187l-4.229,2.229c-0.457-0.951-1.02-1.619-1.686-2%20c-0.668-0.38-1.307-0.571-1.914-0.571c-2.857,0-4.287,1.885-4.287,5.657c0,1.714,0.363,3.084,1.086,4.113%20c0.723,1.029,1.789,1.544,3.201,1.544c1.865,0,3.18-0.915,3.941-2.743l4,2c-0.875,1.563-2.057,2.791-3.541,3.686%20c-1.486,0.896-3.105,1.343-4.857,1.343c-2.896,0-5.209-0.875-6.941-2.629c-1.736-1.752-2.602-4.19-2.602-7.313%20c0-3.048,0.885-5.466,2.658-7.257c1.77-1.79,4.008-2.686,6.713-2.686C51.117,18.558,53.938,20.101,55.613,23.187z'/%3e%3c/g%3e%3c/svg%3e)
%20--%3e%3c!DOCTYPE%20svg%20PUBLIC%20'-//W3C//DTD%20SVG%201.0//EN'%20'http://www.w3.org/TR/2001/REC-SVG-20010904/DTD/svg10.dtd'%3e%3csvg%20version='1.0'%20id='Layer_1'%20xmlns='http://www.w3.org/2000/svg'%20xmlns:xlink='http://www.w3.org/1999/xlink'%20x='0px'%20y='0px'%20width='64px'%20height='64px'%20viewBox='5.5%20-3.5%2064%2064'%20enable-background='new%205.5%20-3.5%2064%2064'%20xml:space='preserve'%3e%3cg%3e%3ccircle%20fill='%23FFFFFF'%20fill-opacity='0'%20cx='37.637'%20cy='28.806'%20r='28.276'/%3e%3cg%3e%3cpath%20fill='%23595959'%20d='M37.443-3.5c8.988,0,16.57,3.085,22.742,9.257C66.393,11.967,69.5,19.548,69.5,28.5c0,8.991-3.049,16.476-9.145,22.456%20C53.879,57.319,46.242,60.5,37.443,60.5c-8.649,0-16.153-3.144-22.514-9.43C8.644,44.784,5.5,37.262,5.5,28.5%20c0-8.761,3.144-16.342,9.429-22.742C21.101-0.415,28.604-3.5,37.443-3.5z%20M37.557,2.272c-7.276,0-13.428,2.553-18.457,7.657%20c-5.22,5.334-7.829,11.525-7.829,18.572c0,7.086,2.59,13.22,7.77,18.398c5.181,5.182,11.352,7.771,18.514,7.771%20c7.123,0,13.334-2.607,18.629-7.828c5.029-4.838,7.543-10.952,7.543-18.343c0-7.276-2.553-13.465-7.656-18.571%20C50.967,4.824,44.795,2.272,37.557,2.272z%20M46.129,20.557v13.085h-3.656v15.542h-9.944V33.643h-3.656V20.557%20c0-0.572,0.2-1.057,0.599-1.457c0.401-0.399,0.887-0.6,1.457-0.6h13.144c0.533,0,1.01,0.2,1.428,0.6%20C45.918,19.5,46.129,19.986,46.129,20.557z%20M33.042,12.329c0-3.008,1.485-4.514,4.458-4.514s4.457,1.504,4.457,4.514%20c0,2.971-1.486,4.457-4.457,4.457S33.042,15.3,33.042,12.329z'/%3e%3c/g%3e%3c/g%3e%3c/svg%3e)
1. Introduction
When laminar boundary layers encounter rough surfaces, the flow field can be greatly modified by surface roughness, and transition to turbulence can occur. Understanding roughness-induced transition is important since it leads to an increase in friction drag and affects the performance of aeronautical and naval applications. In the context of trip studies, trips in high Reynolds number flows located close to the leading edge correspond to roughness with a large  $h/\delta ^*$ (ratio of roughness height to the displacement boundary layer thickness). In engineering applications, moving the trip location upstream is desirable to obtain a turbulent boundary layer over a large portion of the body. However, the upstream region usually has a low Reynolds number and favourable pressure gradient, which makes it difficult to transition the flow. This, along with the boundary layer being thinner closer to the leading edge, results in a larger value of
 $h/\delta ^*$. See, for example, work on the DARPA SUBOFF hull by Jiménez, Reynolds & Smits (Reference Jiménez, Reynolds and Smits2010), Morse, Kroll & Mahesh (Reference Morse, Kroll and Mahesh2022), Plasseraud et al. (Reference Plasseraud, Kumar, Ma and Mahesh2022) and Plasseraud, Kumar & Mahesh (Reference Plasseraud, Kumar and Mahesh2023). Three-dimensional (3-D) surface roughness can be generally categorized into isolated and distributed roughness elements, both of which are commonly involved in engineering applications. An isolated roughness element may be considered a fundamental building block for distributed roughness which is more practical. Distributed roughness elements can trigger different modes of perturbations that translate into different evolutions to a turbulent state. It is therefore important to understand the effects of spatial proximity of roughness elements, especially in the case where the following roughness elements lie within the wake of upstream elements.
The effects of isolated roughness elements on boundary layers have been studied in past literature (Baker Reference Baker1979). The streamwise vortices induced by an isolated roughness element create longitudinal streaks downstream whose unstable nature plays a crucial role in the transition process (Reshotko Reference Reshotko2001; Fransson et al. Reference Fransson, Brandt, Talamelli and Cossu2004, Reference Fransson, Brandt, Talamelli and Cossu2005). The linear stability properties of isolated-roughness-induced transition have been investigated both computationally and experimentally (De Tullio et al. Reference De Tullio, Paredes, Sandham and Theofilis2013; Loiseau et al. Reference Loiseau, Robinet, Cherubini and Leriche2014; Citro et al. Reference Citro, Giannetti, Luchini and Auteri2015; Puckert & Rist Reference Puckert and Rist2018; Bucci et al. Reference Bucci, Cherubini, Loiseau and Robinet2021; Ma & Mahesh Reference Ma and Mahesh2022). They are found to depend on the combined effects of parameters such as the ratio of roughness height  $h$ to the displacement boundary layer thickness
 $\delta ^*$, aspect ratio
 $\eta =d/h$ (
 $d$ is roughness width) and Reynolds number
 $Re_h=U_eh/\nu$ (
 $U_e$ is the boundary layer edge velocity, h is roughness height and
 $\nu$ is the kinetic viscosity of the fluid). Compared with the isolated roughness element, distributed roughness elements display phenomena not present in the isolated case. Fewer studies have been performed on how 3-D distributed roughness elements affect the stability properties and flow structures in transitional boundary layers.
Global linear stability analysis (Theofilis Reference Theofilis2011) provides insight into the temporal disturbance growth during the early stages of transition, and is useful for non-parallel flows such as roughness wakes. It has been used to capture and understand the leading unstable modes in boundary layer transition due to isolated roughness (Loiseau et al. Reference Loiseau, Robinet, Cherubini and Leriche2014; Citro et al. Reference Citro, Giannetti, Luchini and Auteri2015; Bucci et al. Reference Bucci, Cherubini, Loiseau and Robinet2021; Ma & Mahesh Reference Ma and Mahesh2022). The potential of global stability analysis to detect the leading unstable modes induced by distributed surface roughness remains relatively unexplored. While an isolated roughness element represents a single trip on the surface, it can also be considered a foundational model to be extended to distributed surface roughness. In this work, we therefore combine direct numerical simulation (DNS) and global stability analysis to investigate transition due to distributed surface roughness with varying streamwise and spanwise spacings, where each individual element corresponds to the geometry of isolated roughness investigated in Ma & Mahesh (Reference Ma and Mahesh2022).
Past studies of transition over distributed surface roughness have mainly focused on the effects of roughness height. Corke, Bar-Sever & Morkovin (Reference Corke, Bar-Sever and Morkovin1986) studied the effects of distributed roughness on transition and suggested that transition is most likely to be triggered by the few highest peaks. They also found that the low-inertia fluid in the valleys between roughness elements could be influenced more easily by free-stream disturbances. For roughness with small amplitudes, transition is induced through a linear amplification of temporal disturbance growth followed by secondary instabilities and breakdown to turbulence (Reshotko Reference Reshotko2001). In contrast, large-amplitude roughness creates local separations, leading to strong 3-D disturbances that can develop into turbulence directly. This is the so-called ‘bypass’ transition, which means that the linear instability processes such as Tollmien–Schlichting waves are bypassed. Vadlamani, Tucker & Durbin (Reference Vadlamani, Tucker and Durbin2018) conducted numerical investigations on the transition of a subsonic boundary layer over distributed surface roughness with different heights. They suggested that secondary instabilities on the streaks promote the transition to turbulence for roughness elements that are inside the boundary layer and that the instability wavelengths appear to be governed by the fixed streamwise and spanwise spacings between roughness elements. For roughness elements that are higher than the boundary layer, they found that the scale of instability is shorter and the shedding from the obstacles leads to transition. von Deyn et al. (Reference von Deyn, Forooghi, Frohnapfel, Schlatter, Hanifi and Henningson2020) investigated the influence of distributed roughness and free-stream turbulence on bypass transition. They found that the bypass transition occurs as a result of the secondary instability of low-speed streaks and suggested that the streak spacing does not vary with different roughness densities at constant roughness height.
While roughness height is an important parameter to affect transition, roughness spacing can also potentially modify the transitional flow behaviour and associated instability mechanisms. Investigation of spanwise proximity of roughness elements has commonly involved spanwise arrays of roughness elements. Ergin & White (Reference Ergin and White2006) studied transitional flow behind a spanwise array of cylindrical roughness elements and suggested that transition results from a competition between unsteady disturbance growth and steady disturbance decay. Choudhari & Fischer (Reference Choudhari and Fischer2006) performed numerical simulations of a flat plate boundary layer past a spanwise array of cylindrical roughness elements (spaced three diameters away from each other). They observed self-sustained and unsteady vortical structures that resemble the flow structures during natural transition for roughness with large height. Muppidi & Mahesh (Reference Muppidi and Mahesh2012) investigated supersonic boundary layer flow over distributed surface roughness and showed that the counter-rotating vortex pairs induced by roughness perturb the shear layer and trigger transition. With closely packed roughness elements, there is little upstream spacing to generate a strong horseshoe vortex and little spanwise spacing to produce counter-rotating vortices, which can prevent the transition from occurring. The influence of spanwise spacing on instability and transition has been less explored in past work. Our present study aims to quantitatively evaluate the effects of spanwise spacing of roughness elements on the vortical structures and associated instability characteristics in transition.
The role of the streamwise proximity of the roughness elements is also a crucial factor of transition due to distributed roughness. Choudhari et al. (Reference Choudhari, Li, Chang, Edwards, Kegerise and King2010) performed simulations of a high-speed boundary layer past an isolated diamond trip as well as two trips aligned with the flow direction (spaced at three times the trip width). They found that the introduction of an additional trip could amplify the streak amplitude and cause transition even at a smaller trip height, while the case with a larger trip height presents a weaker augmentation of the streak amplitude since the flow has not recovered as much as for smaller trip height. In a turbulent boundary layer, the classification of d-type and k-type behaviours (Jiménez Reference Jiménez2004) is related to the streamwise roughness spacing and might be made based on the ratio of roughness pitch to height being equal to  $3$ (Tani Reference Tani1987). Perry, Schofield & Joubert (Reference Perry, Schofield and Joubert1969) and Ikeda & Durbin (Reference Ikeda and Durbin2007) further claimed that the difference between k-type and d-type roughness is related to the state of vortex shedding: for d-type roughness, stable vortices form within the grooves and no eddy sheds into the flow above the crests; for k-type roughness, eddies with a length scale of order
 $h$ shed into the flow above the crests. Vanderwel & Ganapathisubramani (Reference Vanderwel and Ganapathisubramani2015) suggested that distributed roughness with streamwise gaps less than
 $(4$–
 $5)h$ would act like continuous strips in turbulent boundary layers, while more than
 $5h$ would act like 3-D distributed roughness. Although the dependence of flow behaviours on different streamwise spacings has been discussed extensively in turbulent boundary layers, less studied is how streamwise spacing affects transition. This work, therefore, investigates transition due to distributed surface roughness with streamwise spacing
 $5h$ and
 $10h$ and compares the results with the isolated roughness case.
The paper is organized as follows. The numerical methodology is introduced in § 2. The flow configuration and simulation details are discussed in § 3. In § 4, the influence of distributed roughness on the transitional boundary layer is studied, the formation mechanisms of hairpin vortices in different roughness distributions are examined, and the base flow and global stability results are analysed and compared with the isolated case. Finally, the paper is summarized in § 5.
2. Numerical methodology
The governing equations and numerical methods are briefly summarized. An overview of linear stability and details regarding the iterative eigenvalue solver are provided.
2.1. Direct numerical simulation
The incompressible Navier–Stokes (N–S) equations are solved using the finite volume algorithm developed by Mahesh, Constantinescu & Moin (Reference Mahesh, Constantinescu and Moin2004)
 \begin{equation} \frac{\partial u_i}{\partial t} + \frac{\partial}{\partial x_j}(u_iu_j)={-}\frac{\partial p}{\partial x_i} + \nu\frac{\partial^2 u_i}{\partial x_j x_j}+K_i,\quad\frac{\partial u_i}{\partial x_i} = 0, \end{equation}
where  $u_i$ and
 $x_i$ are the
 $i$th components of the velocity and position vectors, respectively,
 $p$ denotes pressure divided by density,
 $\nu$ is the kinematic viscosity of the fluid and
 $K_i$ is a constant pressure gradient (divided by density). Note that the density is absorbed in the pressure and
 $K_i$. The algorithm is robust and emphasizes discrete kinetic energy conservation in the inviscid limit which enables it to simulate high-Re flows without adding numerical dissipation. A predictor–corrector methodology is used where the velocities are first predicted using the momentum equation and then corrected using the pressure gradient obtained from the Poisson equation yielded by the continuity equation. The Poisson equation is solved using a multigrid pre-conditioned conjugate gradient method using the Trilinos libraries (Sandia National Labs).
The DNS solver has been validated in Ma, Alamé & Mahesh (Reference Ma, Alamé and Mahesh2021) for a smooth turbulent channel flow, and a rod-roughened turbulent channel flow. Good agreement is obtained for the mean velocity and Reynolds stresses profiles with the DNS results of Moser, Kim & Mansour (Reference Moser, Kim and Mansour1999) and Ashrafian, Andersson & Manhart (Reference Ashrafian, Andersson and Manhart2004).
2.2. Linear stability analysis
Modal linear stability analysis is the study of the dynamic response of a base state subject to infinitesimal perturbations (Theofilis Reference Theofilis2011). In the present work, the incompressible N–S equations (2.1a,b) are linearized about a base state,  $\bar {u}_i$ and
 $\bar {p}$. The flow can be decomposed into a base state subject to a small
 $O(\epsilon )$ perturbation
 $\tilde {u}_i$ and
 $\tilde {p}$. The linearized Navier–Stokes (LNS) equations are obtained by subtracting the base state from (2.1a,b) and neglecting the nonlinear terms. It can be written as follows:
 \begin{equation} \frac{\partial \tilde{u}_i}{\partial t} + \frac{\partial}{\partial x_j}\tilde{u}_i\bar{u}_j + \frac{\partial}{\partial x_j}\bar{u}_i\tilde{u}_j={-}\frac{\partial \tilde{p}}{\partial x_i} + \nu\frac{\partial^2 \tilde{u}_i}{\partial x_j x_j},\quad\frac{\partial \tilde{u}_i}{\partial x_i} = 0. \end{equation}
The same numerical schemes as the N–S equations are used to solve the LNS equations. Periodic boundary conditions are imposed on the spanwise domain boundaries. Homogeneous Dirichlet boundary conditions are used at the inlet, the upper boundary and the bottom walls, while the convective boundary condition is used at the outflow boundary.
The LNS equations can be rewritten as a system of linear equations
 \begin{equation} \frac{\partial \tilde{u}_i}{\partial t} = \boldsymbol{\mathsf{A}} \tilde{u}_i, \end{equation}
where  $A$ is the LNS operator and
 $\tilde {u}_i$ is the velocity perturbation. The solutions to the linear system of (2.3) are
 \begin{equation} \tilde{u}_i(x,y,z,t)=\sum_{\omega}\hat{u}_i(x,y,z){\rm e}^{\omega t}, \end{equation}
where  $\widehat {u_i}$ is the velocity coefficient, and both
 $\widehat {u_i}$ and
 $\omega$ can be complex. This defines
 $\sigma ={Re}(\omega )$ as the growth/damping rate and
 $\omega _a={Im}(\omega )$ as the temporal frequency of
 $\widehat {u_i}$. The linear system of equations can then be transformed into a linear eigenvalue problem
 \begin{equation} \boldsymbol{\mathsf{\Omega}} \hat{U} = \boldsymbol{\mathsf{A}} \hat{U}, \end{equation}
where  $\omega _j = {\rm diag}(\boldsymbol{\mathsf{\Omega}})_j$ is the
 $j$th eigenvalue and
 $\hat{U}$ is the matrix of eigenvectors. For global stability analysis, solving the eigenvalue problem using direct methods is very computationally expensive. Instead, a matrix-free method, the implicitly restarted Arnoldi method implemented in the PARPACK library is used to efficiently solve for the leading eigenvalues and eigenmodes in the present work.
3. Simulation details
Figure 1 depicts the flow configuration and roughness distribution. On the flat plate, attached cuboids with an aspect ratio of width to height  $\eta =d/h=1$ are aligned in both the streamwise and spanwise directions. The collocated distribution is chosen because the study is focused on understanding the effects of the spatial proximity of the roughness elements, especially in the case where the following roughness lies within the wake of upstream elements. For the staggered configuration, the following elements are possibly not located within the roughness wakes of the first-row elements. They will have a larger initial
 $\delta ^*/h$ and therefore may induce different types of perturbation modes. The ratio of the displacement boundary layer thickness to the first-row roughness height is
 $\delta ^*/h=0.35$, consistent with the isolated cube in Ma & Mahesh (Reference Ma and Mahesh2022). The roughness height is
 $h=1$, the reference length in the simulations. The Blasius laminar boundary layer solution is specified at the inflow boundary, and convective boundary conditions are used at the outflow boundary. Periodic boundary conditions are used in the spanwise direction. No-slip boundary conditions are imposed on the flat plate and the roughness surfaces. The boundary conditions
 $U_e=1$,
 $\partial v/\partial y=0$ and
 $\partial w/\partial y=0$ are used at the upper boundary. Uniform grids are used in the streamwise and spanwise directions, and the grid in the wall-normal direction is clustered near the flat plate. Three distributed roughness cases with different
 $\lambda _x$ and
 $\lambda _z$ are investigated at
 $Re_{h}=600$ in the present work. The grid size and domain length are determined based on the grid convergence and domain length sensitivity studies in Ma & Mahesh (Reference Ma and Mahesh2022) for an isolated cube with a similar flow configuration. They are also comparable to past literature on flow simulations over cube roughness (Coceal et al. Reference Coceal, Thomas, Castro and Belcher2006; Leonardi & Castro Reference Leonardi and Castro2010; Xu et al. Reference Xu, Altland, Yang and Kunz2021). Details of domain length and grid information are shown in table 1.
Schematic of the flow configuration and roughness distribution. The  $x$,
 $y$ and
 $z$ coordinates are the streamwise, wall-normal and spanwise directions. The distance from the inlet of the computational domain to the first row of roughness elements remains constant at
 $l=15h$. The streamwise and spanwise spacings are denoted by
 $\lambda _x$ and
 $\lambda _z$, respectively.

Simulation parameters for the isolated and distributed roughness cases at  $Re_h=600$.

4. Results
4.1. Distributed roughness effects on boundary layers
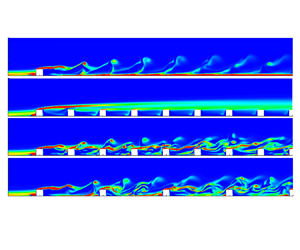
Different roughness spacing affects boundary layer behaviour. The wake flow downstream of the roughness elements is visualized by instantaneous streamwise velocity in the symmetry plane in figure 2. Figure 2(a) shows that, for case  $(5h, 2.5h)$, the reverse flow is strong in the first cavity and becomes weak from the second cavity onwards. Wall-normal momentum transfer hardly occurs and the boundary layer above the roughness layer remains laminar. According to Castro & Robins (Reference Castro and Robins1977) and Vanderwel & Ganapathisubramani (Reference Vanderwel and Ganapathisubramani2015), roughness with gaps of less than (4–
 $5)h$ would act more like continuous strips. They sustain recirculation vortices that isolate the outer flow from the roughness, as observed for case
 $(5h, 5h)$ in figure 2(b). In contrast, roughness with longer gaps induces recirculation bubbles that reattach ahead of the next cubes, and the outer flow penetrates into the cavities. For a larger streamwise spacing
 $\lambda _x=10h$, as shown in figure 2(c), the high-momentum fluid transfers downwards into the first cavity and impinges on the second-row roughness. The penetration of high-momentum fluid into the cavities becomes weaker with increasing downstream distance. The unsteadiness of the roughness wake flow is depicted by the streamwise velocity fluctuations for cases
 $(5h, 5h)$ and
 $(10h, 5h)$ in figure 3. For case
 $(5h, 5h)$, the strong velocity fluctuations occur at the localized shear layers induced by the roughness elements. The low level of fluctuations in the cavities indicates that the recirculation bubbles located within the cavities remain quite steady. For case
 $(10h, 5h)$, the large value of root-mean-square streamwise velocity fluctuations
 $u_{rms}$ is observed in front of the second-row elements, possibly due to the vortex shedding into the cavities. The large fluctuations are not observed above the second-row elements, indicating that, as the wake flow of the first-row elements impinges the second row, different perturbation modes may be induced. The detailed vortical structures and their associated instability will be examined in §§ 4.2 and 4.3.
Instantaneous streamwise velocity  $u/U_e$ in the symmetry plane from the DNS at
 $Re_h=600$ for (a) case
 $(5h, 2.5h)$, (b) case
 $(5h, 5h)$ and (c) case
 $(10h, 5h)$.

Streamwise velocity fluctuations  $u_{rms}/U_e$ in the symmetry plane from the DNS at
 $Re_h=600$ for (a) case
 $(5h, 5h)$ and (b) case
 $(10h, 5h)$. The contours are from 0 (white) to 0.03 (blue).

The effect of streamwise roughness spacing on transitional boundary layers is examined through boundary layer integral parameters for cases  $(5h, 5h)$ and
 $(10h, 5h)$, with a comparison with the isolated cube. The streamwise variation of the displacement boundary layer thickness (
 $\delta ^*$), momentum boundary layer thickness (
 $\theta$) and shape factor (
 $H$) is presented in figures 4(a)–4(c). The parameters are computed from a time-averaged flow field and spanwise averaging is performed across the span. Comprehensive spatial averaging, where the averaging volume includes both the fluid and solid area, is used to ensure continuity in the profiles (Xie & Fuka Reference Xie and Fuka2018). To understand the spatial inhomogeneity of the flow field caused by distributed roughness, the local integral boundary layer parameters are also shown in figure 5.
Streamwise variations of (a) displacement boundary layer thickness, (b) momentum boundary layer thickness and (c) shape factor of cases  $(5h, 5h)$ and
 $(10h, 5h)$ at
 $Re_h=600$, and comparison with the isolated roughness and laminar Blasius solution.

Contour plots of the local integral boundary layer parameters (a) displacement boundary layer thickness, (b) momentum boundary layer thickness and (c) shape factor for cases  $(5h, 5h)$ and
 $(10h, 5h)$ at
 $Re_h=600$. The lateral high-speed streaks are depicted by the solid contour lines in (a) using the streamwise velocity deviation of the mean flow from the Blasius solution.

In figure 4(a), an increase in  $\delta ^*$ is seen due to the presence of roughness elements compared with the laminar Blasius solution. A more significant increase is observed for distributed roughness than the isolated roughness. The increase is more pronounced for distributed roughness with smaller
 $\lambda _x$ since the denser streamwise roughness distribution leads to stronger perturbations to the downstream shear layer. This can also be confirmed by the fluctuations examined in figure 3. Figure 5(a) shows that the region with lower values of local
 $\delta ^*$ corresponds to the location of lateral high-speed streaks induced by roughness. Figure 4(b) shows a negative deviation from the Blasius solution in the profiles of
 $\theta$ for the distributed roughness cases. This is related to the strong reverse flow that occurs closely behind the first two rows of roughness elements, as demonstrated by figure 5(b). A steeper increase in the profiles of
 $\theta$ indicates that the breakdown of boundary layers is more significant for distributed surface roughness compared with the isolated roughness.
The shape factor in figure 4(c) shows a significant increase compared with the isolated roughness. The high values of  $H$ are associated with inflection points and reveal locally the instability of the streaks induced by roughness elements, as shown in figure 5(c). The steep drop in
 $H$ begins at approximately
 $x=5h$ for the three cases, suggesting that the streaks with high amplitudes break down and transition happens at similar downstream positions for three different roughness distributions. The shape factor converges farther downstream after the breakdown. The values are higher for case
 $(5h, 5h)$ when compared with case
 $(10h, 5h)$ and the isolated case, resulting from a stronger blockage effect of a denser roughness distribution.
4.2. Formation and evolution of hairpin-shaped vortices
Packets of hairpin-shaped vortices are key structures in roughness-induced transition. They are associated with global instability, as known for isolated roughness. Cohen, Karp & Mehta (Reference Cohen, Karp and Mehta2014) proposed a model consisting of three key elements required for the formation of hairpin vortices: simple shear, counter-rotating vortices and a 2-D vortex sheet, and highlight that this combination is unstable. It is therefore important to understand the influence of roughness spacing on the generation and evolution of hairpin vortices in roughness wakes.
4.2.1. Counter-rotating vortex pairs (CVP)
As known for isolated roughness, the spanwise vortices formed upstream wrap around the roughness element and give birth to the streamwise vortices downstream of the roughness, and the streamwise counter-rotating vortices are known to play a critical role in the generation of hairpin vortices (Iyer & Mahesh Reference Iyer and Mahesh2013; Bucci et al. Reference Bucci, Cherubini, Loiseau and Robinet2021). As the baseline, figure 6 depicts the characteristics of streamwise vortices induced by an isolated cube. The symmetry plane (SP) vortices located very close to the roughness have an upwash between them. They lift up and move towards each other with increasing downstream distance, and are dissipated at  $x=25h$. The off-symmetry plane (OSP) vortices located farther from the SP are the continuation of the vortex tubes from upstream. They have a central downwash which keeps them away from each other with increasing downstream distance.
Mean streamwise vorticity  $\bar {\omega }_x=\pm 0.5$ with mean streamlines in the cross-flow planes (a,b) and the plane of
 $y=0.5h$ (c) from the DNS at
 $Re_h=600$ for the isolated roughness.

The effects of spanwise spacing on CVP are investigated for case  $(5h, 2.5h)$ in figure 7. At
 $x=0$, the OSP vortices are observed in the groove between two adjacent cubes, similar to the isolated case. However, the SP vortices do not appear on either side of the obstacles, in contrast to the isolated case. The generation mechanism of the SP vortices is examined using the mean streamlines in figure 7(a) and illustrated in figure 7(b). The secondary flow close to the cube sides moves downward due to the motion of the OSP vortices (from
 $a$ to
 $b$), then moves toward the cube due to a positive spanwise pressure gradient (from
 $b$ to
 $c$), and moves upward for mass conservation (from
 $c$ to
 $d$). With small spanwise spacing, the OSP vortices in the groove are located closer to each other, which strengthens the upward fluid motion in the groove and weakens the centrifugal forces. The last step under the effects of centrifugal forces for the generation of SP vortices (from
 $d$ to
 $a$) is therefore missing. As a result, a weak CVP is observed at the roughness tip location at
 $x=4h$ and is dissipated within a short downstream distance. The OSP vortices in the groove are also diminished with increasing downstream distance and mostly disappear beyond the second row of roughness elements, as shown in figure 7(c).
(a) Mean streamwise vorticity  $\bar {\omega }_x=\pm 0.5$ with mean streamlines in the cross-flow planes, (b) illustration of the formation mechanisms of SP vortices and
 $(c)$ streamwise evolution of
 $\bar {\omega }_x$ at the plane of
 $y=0.5h$ from the DNS of case
 $(5h, 2.5h)$ at
 $Re_h=600$. The contour levels are the same as figure 6.

The effects of streamwise spacing on CVP are investigated in figure 8 for cases  $(5h, 5h)$ and
 $(10h, 5h)$. For both cases, the SP and OSP vortices are observed and behave similarly to the isolated roughness at
 $x=0$. Figure 8(a) shows that, for case
 $(5h, 5h)$, the CVP grows with increasing downstream distance, and is distorted and pushed apart by the following roughness as observed at
 $x=4h$. At
 $x=10h$, the SP vortices developed from the front obstacles are weakened due to the stagnation effects of the following obstacles, but a new pair of SP vortices is induced again on either side of the cube, and the OSP vortices on the lateral sides are strengthened. Figure 8(c) shows that the CVP is dissipated beyond
 $x=30h$, similarly to the isolated roughness case.
Mean streamwise vorticity  $\bar {\omega }_x=\pm 0.5$ with mean streamlines in the cross-flow planes and the plane of
 $y=0.5h$ from the DNS at
 $Re_h=600$ for (a,c) case
 $(5h, 5h)$ and (b,d) case
 $(10h, 5h)$. The contour levels are the same as figure 6.

For case  $(10h, 5h)$, the streamwise spacing is much larger than the streamwise length of the separation region. The behaviour of the CVP is similar to that for an isolated roughness at
 $x=0$ and
 $4h$, as shown in figure 8(b). Instead of being distorted by the roughness as case
 $(5h, 5h)$, both the SP and OSP vortices move closer to the SP, enhancing the momentum exchange within the cavities. At
 $x=10h$, they impinge onto the second row of roughness elements and break down into small vortical structures. A new pair of SP vortices is generated and the OSP vortices are strengthened on the lateral sides. Figure 8(d) shows that, after the second-row cubes, the SP vortices are maintained in the cavities while the OSP vortices develop in the longitudinal grooves. The CVP persists farther than case
 $(5h, 5h)$, and is dissipated beyond
 $x=40h$.
4.2.2. Roughness wake flow
The CVP examined in § 4.2.1 perturbs the shear layer in its vicinity, and its size and strength determines the nature of the perturbation to the shear layer and the characteristics of roughness wakes. To understand how multiple roughness elements affect the evolution of hairpin vortices in roughness wakes and the wake extension, the instantaneous spanwise vorticity and mean streamwise velocity at the SP are visualized in figures 9 and 10, respectively. The wake flow downstream of the isolated cube is shown as the baseline in figure 9(a). The breakdown of the shear layer is observed downstream of the cube due to the perturbation of vortex shedding, and the vortex heads are largely dissipated by  $x=20h$.
Instantaneous spanwise vorticity in the SP from the DNS at  $Re_h=600$ for (a) isolated roughness, (b) case
 $(5h, 2.5h)$, (c) case
 $(5h, 5h)$ and (d) case
 $(10h, 5h)$.

Mean streamwise velocity  $\bar {u}/U_e$ in the SP from the DNS at
 $Re_h=600$ for (a) the isolated case, (b) case
 $(5h, 5h)$ and (c) case
 $(10h, 5h)$.

For distributed surface roughness, figure 9(b) shows that, for small spanwise spacing  $\lambda _z=2.5h$, the downstream shear layer forms right above the roughness tips and no hairpin-shaped vortex shedding is produced in the wake flow. The inflection point in the mean velocity profiles is examined in figure 11. It is a necessary condition for instability in shear flows and corresponds to the peak location of spanwise vorticity. Although the inflection points formed by wall-normal shear can be identified for case
 $(5h, 2.5h)$ in figure 11, the absence of CVP due to the small spanwise spacing results in a failure of hairpin vortex generation. As a consequence, the perturbation to the shear layer is weak, and a stable shear layer is formed above the roughness layer.
Streamwise variation of (a)  $\bar {u}$ and (b)
 $\overline {\omega }_z$ profiles in the SP for case
 $(5h, 5h)$ (black solid), case
 $(5h, 2.5h)$ (blue dash-dot) and case
 $(10h, 5h)$ (red dashed) at
 $Re_h=600$.

With larger spanwise spacing  $\lambda _z=5h$, the disturbances present in the roughness wake can trigger strong nonlinear interactions, leading to the breakdown of the shear layer, as observed in figures 9(c) and 9(d). Figure 10 shows the modification of different
 $\lambda _x$ to the roughness wake flow, with a comparison with the isolated case. Multiple roughness elements lead to a wake extension by generating recirculation bubbles in the wake flow. Distributed roughness in case
 $(5h, 5h)$ sustains recirculation bubbles that isolate the outer flow from the roughness layer, as observed in figure 10(b). As a result, although the primary hairpin vortices that behave similarly to the isolated case can be identified above the roughness tips in figure 9(c), they rarely shed into the roughness layer. Meanwhile, the following roughness elements persistently induce disturbances to the roughness wake, as shown by the localized shear layers induced right above each element (red regions in figure 9c). These localized shear layers that contain high-level fluctuations contribute to the unstable nature of the roughness wake.
In contrast, roughness with longer gaps (case  $(10h, 5h)$) induces recirculation bubbles that reattach ahead of the next cubes, and the outer flow penetrates into the cavities. In figure 10(c), the recirculation region is similar to the isolated case, but the high-momentum fluid transfers downwards into the first cavity, and the wake flow impacts the following elements. It is also observed that the penetration of high-momentum fluid into the cavities becomes weaker with increasing downstream distance. In figure 9(d), the hairpin vortex shedding induced by the first row of elements behaves similarly to the isolated case. However, more complex vortical structures evolve into the cavities from the second-row cubes as the wake flow impinges onto the following elements. Although different roughness distributions modify roughness wake flow, the periodicity of the primary hairpin vortex shedding seems to be consistent with that of the isolated roughness and independent of the streamwise roughness spacing. The associated instability mechanisms will be further examined and discussed in § 4.3.
The evolution of the primary vortical structures in roughness wakes is examined for cases  $(5h, 5h)$ and
 $(10h, 5h)$ using the Q criterion which defines vortices as areas where the vorticity magnitude is greater than the magnitude of the rate of strain (Hunt, Wray & Moin Reference Hunt, Wray and Moin1988). For case
 $(5h, 5h)$ in figure 12, both the SP and OSP vortices are observed in the vicinity of the first-row cubes. They interact with the shear layer, leading to the hairpin vortex shedding downstream of the first-row roughness elements. The packets of hairpin-type structures with small legs labelled
 $1$ can be identified from the top-down view. The shorter streamwise extent of the vortical motions is due to the blockage effects of the closely distributed cubes. As the vortex legs are inclined upward and undergo stretching by a positive wall-normal velocity gradient, they are cut off by the following cubes and break down into smaller vortical structures with low momentum within the roughness layer. The interactions between vortical structures in the longitudinal grooves occur at approximately
 $x=15h$, and the arch-shaped vortical structures are observed farther downstream.
Instantaneous vortical structures for case  $(5h, 5h)$ in perspective and top-down views, visualized by isocontours of
 $Q=0.1U_e^2/h^2$ and coloured with instantaneous streamwise velocity. Plotted in the
 $x$–
 $y$ and
 $z$–
 $y$ planes are the contours of instantaneous spanwise vorticity, in the range of
 $-1$ (black) and
 $0$ (white).

For case  $(10h, 5h)$, both SP and OSP vortices are observed, and the hairpin vortices are generated from the first-row cubes, as shown in figure 13. The top-down view shows that the hairpin vortices labelled
 $1$ behave similarly to the isolated roughness case. In contrast to the cut off vortex legs observed in case
 $(5h, 5h)$, the primary hairpin vortices in case
 $(10h, 5h)$ have sufficient space to develop downstream. However, as the high-momentum fluid impinges onto the second-row elements, another spanwise vortex wraps around the second-row cubes (see the vortical structures in green), and the vortical structures break down into small scales downstream of the second-row cubes. The CVP sheds from the second-row roughness tips, and the hairpin-like vortices with a separation of the vortex heads labelled
 $2$ are observed. This indicates that a different unstable mode might be induced by the second-row elements in case
 $(10h, 5h)$.
Instantaneous vortical structures for case  $(10h, 5h)$ in perspective and top-down views, visualized by isocontours of
 $Q=0.1U_e^2/h^2$ and coloured with instantaneous streamwise velocity. The contour levels are the same as figure 12.

4.3. Global stability analysis
The hairpin vortices induced by roughness elements are inherently unstable as the CVP perturbs the shear layer, forming the inflection point in the base-flow velocity profiles. The perturbation of the shear layer is inhomogeneous in the spanwise direction and therefore the global stability analysis is useful to provide insights into the instability mechanisms associated with the distributed roughness wakes.
4.3.1. Base-flow computation
The base flow for global instability analysis is computed for the distributed roughness cases. For cases  $(5h, 2.5h)$ and
 $(5h, 5h)$, the selective frequency damping (SFD) method (Åkervik et al. Reference Åkervik, Brandt, Henningson, Hœpffner, Marxen and Schlatter2006) is used to artificially settle the flow towards a steady equilibrium. An encapsulated formation of the SFD method developed by Jordi, Cotter & Sherwin (Reference Jordi, Cotter and Sherwin2014) is applied in the present work.
For case  $(10h, 5h)$, it is found that the SFD method is unable to damp the oscillations due to the unsteady part of the solutions, even though careful choices are made for the control coefficient
 $\chi$ and the filter width
 $\varDelta$. The possible reason is that the SFD method is unable to get the steady state when there are multiple unstable modes, as indicated by Casacuberta et al. (Reference Casacuberta, Groot, Tol and Hickel2018). They discussed the effectivity of SFD for systems with more than one unstable eigenmode where the most unstable eigenvalue is
 $\mu ^c$ and other unstable eigenvalues are denoted by
 $\mu ^k$. They concluded that SFD is unable to drive the system towards the base flow when
 $\mu ^k$ with large values of
 $Im(\mu ^k)/Re(\mu ^k)$ is present close to the origin. As discussed in Ma & Mahesh (Reference Ma and Mahesh2022), using the time-averaged mean flow as the base state for global stability analysis is able to capture the temporal frequency and associated mode shape of the primary vortical structures for roughness-induced transition. The time-averaged mean flow is therefore considered as an alternate base flow in the present work to investigate global instability for case
 $(10h, 5h)$.
4.3.2. High- and low-speed longitudinal streaks
The high- and low-speed streaks are visualized in figure 14 by the streamwise deviation of the base flow from the Blasius solution for the three distributed roughness cases. Figure 14(a) shows that, for case  $(5h, 2.5h)$, the central and lateral low-speed streaks are merged with each other and form a shear layer above the roughness layer. The high-speed streaks are only induced at the first row of roughness elements and disappear within a short downstream distance due to the dense spanwise roughness distribution. In this case, the instability mechanism might be Kelvin–Helmholtz instability rather than streak instability. For case
 $(5h, 5h)$, both the central and lateral streaks are observed in figure 14(b), behaving similarly to those in an isolated roughness case. The lateral low-speed streaks develop away from the SP with increasing downstream distance, due to the presence of the following roughness elements.
Top-down views of high- and low-speed streaks, visualized by isosurfaces (top) and contour plots at the plane  $y=0.5h$ (bottom) of the streamwise velocity deviation of the base flow from the Blasius boundary layer solution,
 $u_d=U_b-u_{bl}$, for (a) case
 $(5h, 2.5h)$, (b) case
 $(5h, 5h)$ and (c) case
 $(10h, 5h)$. The contour levels in (c) are the same as (a,b).

As the streamwise spacing is increased to  $\lambda _x=10h$, different behaviours of high- and low-speed streaks are seen in figure 14(c). In contrast to case
 $(5h, 5h)$, the central low-speed streak only forms within the vicinity downstream of the cubes. The high-speed streaks induced by the first-row cubes move close to each other and collide with the following obstacles, which induces the high-speed streaks from the second-row cubes. The high-speed streaks grow and interact in the longitudinal grooves farther downstream.
4.3.3. Eigenspectra and eigenmodes
The leading eigenvalues for cases  $(5h, 5h)$ and
 $(10h, 5h)$ at different
 $Re_h$ are plotted in figure 15. For case
 $(5h,5h)$, compared with the isolated case at the same
 $Re_h$, the growth rate is larger and the temporal frequency is lower. This indicates that the distributed roughness elements lead to lower critical
 $Re_h$ for linear instability to occur compared with the isolated roughness. The associated eigenmode for case
 $(5h, 5h)$ is examined in figure 16. The varicose mode is observed along the central low-speed streak, similar to the varicose mode observed in the isolated case (Ma & Mahesh Reference Ma and Mahesh2022). The dominant production terms of disturbance kinetic energy
 $P_y$ and
 $P_z$ are examined in figure 17. This shows that the unstable mode extracts energy from both the wall-normal and spanwise shears of the central low-speed streak, as well as the localized shear layer induced by the cubes.
Leading eigenvalues for cases  $(5h, 5h)$ and
 $(10h, 5h)$ at different
 $Re_h$, and a comparison with the isolated roughness case. The vertical dash-dot line denotes the Strouhal number
 $St=\omega _a h/(2{\rm \pi} u_h)$ of the primary hairpin vortices, where
 $u_h$ is the Blasius velocity at the roughness tips.

Contour plots in the plane of  $y=0.5h$ (a) and isosurfaces (b) of the streamwise velocity component of the leading unstable mode for case
 $(5h, 5h)$ at
 $Re_h=600$. The contour levels depict
 $\pm 10\,\%$ of the mode's maximum streamwise velocity.

Contour plots of  $P_y=-|\hat {u}||\hat {v}|{\partial {\bar {u}}}/{\partial y}$ (a) and
 $P_z=-|\hat {u}||\hat {w}|{\partial {\bar {u}}}/{\partial z}$ (b) in the cross-flow plane of
 $x=12.5h$ for case
 $(5h, 5h)$ at
 $Re_h=600$. The contour levels depict
 $\pm 10\,\%$ of the maximum
 $P_y$ and
 $P_z$. The localized shear is depicted by the solid lines of
 $u_s=((\partial \bar {u}/\partial y)^2+(\partial \bar {u}/\partial z)^2)^{1/2}$ from
 $0$ to
 $2$.

For case  $(10h, 5h)$, two leading eigenvalues are captured in figure 15. One is the leading eigenvalue whose temporal frequency is close to that of the isolated case and case
 $(5h, 5h)$. This leading eigenvalue corresponds to the primary hairpin vortex shedding and is marginally stable, consistent with the state of marginal stability of mean flow for the isolated roughness suggested by Ma & Mahesh (Reference Ma and Mahesh2022). The corresponding eigenmode in figure 18 is associated with the high-speed streaks in the longitudinal grooves as well as the entire shear layer formed above the roughness tips. The production results in figure 19 indicate that the mode extracts most of the energy from the localized shear caused by obstacles and the high-speed streaks in the grooves farther downstream. In contrast to the isolated case and case
 $(5h, 5h)$, the mode hardly extracts the energy from the central low-speed streak since the central streak is diminished for larger streamwise spacing. The other unstable leading eigenvalue with a lower frequency is also obtained for case
 $(10h, 5h)$ in figure 15. Figure 20 shows that the associated eigenmode displays sinuous symmetry, it is induced by the second row of roughness elements and fades away within a short downstream distance. This indicates that when the streamwise spacing is much larger than the region of flow separation, an additional unstable mode is generated as the wake flow from the first-row roughness impinges on the following roughness. The production results in figure 21 demonstrate that this sinuous mode mainly extracts its energy from the spanwise shear induced between the high- and low-speed streaks in the grooves.
Isosurfaces (a) and contour plots at  $y=0.5h$ (b) of the streamwise velocity component of the leading varicose mode for case
 $(10h, 5h)$ at
 $Re_h=600$.

Contour plots of  $P_y$ (a,c) and
 $P_z$ (b,d) in the cross-flow planes at (a,b)
 $x=10h$ and (c,d)
 $x=20h$ for the leading varicose mode of case
 $(10h, 5h)$ at
 $Re_h=600$. The contour levels are the same as figure 17.

Isosurfaces (a) and contour plots at  $y=0.5h$ (b) of the streamwise velocity component of the leading sinuous mode for case
 $(10h, 5h)$ at
 $Re_h=600$.

Contour plots of  $P_y$ (a,c) and
 $P_z$ (b,d) in the cross-flow planes at (a,b)
 $x=15h$ and (c,d)
 $x=20h$ for the leading sinuous mode of case
 $(10h, 5h)$ at
 $Re_h=600$. The contour levels are the same as figure 17.

5. Conclusion and discussion
The effects of roughness spacing on boundary layer transition due to distributed surface roughness are investigated. Both streamwise and spanwise proximities of roughness elements are considered. The transitional flow behaviour and the primary vortical structures due to distributed surface roughness are examined by performing DNSs. Global stability analysis is performed to study the stability properties of the flow field modified by the distributed roughness, and a comparison with an isolated roughness element of the same geometry (Ma & Mahesh Reference Ma and Mahesh2022) is made.
The small spanwise spacing prevents transition and streak instability in the downstream boundary layer by inhibiting the formation of CVP. With the absence of CVP, the hairpin vortices are not generated and the downstream shear layer remains steady at  $Re_h=600$. The flow can be unstable at higher
 $Re_h$ due to Kelvin–Helmholtz instability, which is different from the instability mechanism in the isolated case. When the spanwise spacing increases to
 $\lambda _z=5h$, the hairpin vortices are generated and the roughness wake becomes unsteady. The breakdown of the boundary layer is more significant for distributed surface roughness than the isolated roughness, and a lower critical
 $Re_h$ for instability to occur is found for distributed roughness.
The effects of streamwise spacing are investigated for the fixed  $\lambda _z=5h$. When
 $\lambda _x=5h$, the cavities sustain recirculation vortices that isolate the outer flow from the roughness. As a result, the primary hairpin vortices induced by the first-row elements behave similarly to those in the isolated case, and the leading unstable mode is consistent with that induced by the isolated roughness. The following roughness elements lead to the wake extension by generating recirculation bubbles in the wake flow, and they persistently induce disturbances to the downstream shear layer that make a contribution to the unstable nature of the wake flow. When the streamwise spacing increases to
 $\lambda _x=10h$, the high-momentum fluid transfers downward into the cavities. The roughness wake from the elements in the front has an impact on the following elements, which induces different unstable modes and interactions among different perturbation modes.
Based on the comparison between isolated and distributed roughness with the same configuration parameters, the present study indicates that the dominant unstable mode and the behaviour of the primary hairpin vortices mainly depend on the initial configuration parameters of the first-row roughness elements. Roughness spacing plays an important role in modifying the unstable nature of the wake flow. For surface roughness with different distributions and initial  $\delta ^*/h$, the dominant instability mechanism can be presumed from that in the isolated case, and the roughness spacing effects on the wake flow would be analogous.
Acknowledgements
The authors acknowledge the Minnesota Supercomputing Institute (MSI) and Extreme Science and Engineering Discovery Environment (XSEDE) for providing computing resources that have contributed to the research results reported in this paper.
Funding
The authors would like to thank the United States Office of Naval Research (ONR) Grant N00014-17-1-2308 and N00014-20-1-2717 managed by Dr P. Chang for supporting this research.
Declaration of interests
The authors report no conflict of interest.


 Open access

