I. INTRODUCTION
Carbon is a fascinating element and can be found naturally as crystalline diamond, graphite, or as amorphous carbon. More interestingly, carbon can also be found in diverse micro- and nanoarchitectures that include fullerenes, Reference Kroto, Heath, Obrien, Curl and Smalley1 nanotubes, Reference Iijima2,Reference Oberlin, Endo and Koyama3 graphene, Reference Novoselov, Geim, Morozov, Jiang, Zhang, Dubonos, Grigorieva and Firsov4 among several other nanostructures. Reference Munoz-Sandoval, Agarwal, Escorcia-Garcia, Ramirez-Gonzalez, Martinez-Mondragon, Cruz-Silva, Meneses-Rodriguez, Rodriguez-Manzo, Terrones and Terrones5,Reference Wang, Dong and Xu6 These carbon nanostructures have attracted the interest of the scientific community due to their fascinating physical and chemical properties; some of them could have applications in electronics and photonics, particularly in the fabrication of field emission (FE) devices. Reference Houdellier, Masseboeuf, Monthioux and Hytch7,Reference Cao, Lee, Peng, Liu, Rajaram, Calderon-Colon, An, Wang, Phan, Sultana, Lalush, Lu and Zhou8 In this context, a variety of nanoarchitectures have been intensively studied to find ways to enhance their electron FE properties. Reference Talin, Dean and Jaskie9 For example, carbon nanotubes (CNTs) could enhance the emission performance in flat panel displays Reference Talin, Dean and Jaskie9 and increase the resolution of scanning electron microscopes when used as electron field emitters. Reference Cheng, Zhang, Lee, Gao, Dike, Lin, Lu and Zhou10,Reference de Jonge11
The standard configuration of nanotube-based field emitters consists of vertically aligned CNTs grown/deposited on a substrate; electrons are emitted parallel to the tube longitudinal axis when a voltage is applied. Reference Constantopoulos, Shearer, Ellis, Voelcker and Shapter12 For example, Bonard et al. Reference Bonard, Salvetat, Stockli, Forro and Chatelain13 observed that FE properties depend on the structural integrity of the individual CNT tip. Perea-López et al. Reference Perea-Lopez, Rebollo-Plata, Briones-Leon, Morelos-Gomez, Hernandez-Cruz, Hirata, Meunier, Botello-Mendez, Charlier, Maruyama, Munoz-Sandoval, Lopez-Urias, Terrones and Terrones14 obtained high current densities of approximately 0.75 A/cm2 and low turn-on fields from individual macroscopic bundles of aligned CNTs. In arrays consisting of aligned CNTs, the importance of doping has also been investigated. Reference Zhong, Lee, Bin Mo, Hong and Kang15,Reference Ray, Palnitkar, Pao, Tsai, Pong, Lin, Papakonstantinou, Chen and Chen16 One traditional approach regarding the fabrication of FE sources is the production of different types of CNT microarrays on porous silicon oxide. Reference Jiang, Hao, Wang, Xu and Zhang17,Reference Fan, Chapline, Franklin, Tombler, Cassell and Dai18 Efforts to grow novel CNT micromorphologies in two-step processes have also been explored. For example, Nguyen-Vu et al. obtained “spiky” bundle shapes by wetting an array of aligned CNTs with water and drying it in air. Reference Nguyen-Vu, Chen, Cassell, Andrews, Meyyappan and Li19 Other authors have also obtained exotic microarrays by applying wetting–drying processes to patterned CNTs. Reference de Volder, Tawfick, Park, Copic, Zhao, Lu and Hart20,Reference Lim, Foo, Chia and Sow21 Alternative strategies have also been used to produce hybrid nanotube field emitters. In this context, Hiraki et al. reported several kinds of nanostructured carbon-composite materials by depositing sp 2 and sp 3 carbon on diamond or graphite using a hot filament chemical vapor deposition (CVD). Reference Hiraki, Jiang, Wang and Hiraki22 Nanotip arrays made of pristine and nitrogen-doped amorphous carbon were also obtained by Wang and collaborators using a plasma-enhanced hot filament CVD with hydrogen, methane, and nitrogen gas as precursors. Reference Wang, Dong and Xu6,Reference Wang, Cheng, Zhong, Wang, Chen and Ostrikov23 It is noteworthy that all these routes involve several steps to obtain novel carbon nanoscale morphologies.
Recently, a couple of alternative single-step preparations of exotic CVD grown microstructures were published. Reference Cervantes-Sodi, Vilatela, Jimenez-Rodriguez, Reyes-Gutierrez, Rosas-Melendez, Iniguez-Rabago, Ballesteros-Villarreal, Palacios, Reiband and Terrones24,Reference Zhao, Zhang, Tian, Huang and Wei25 These results showed that small variations during the synthesis could have a great impact on the morphology of the resulting CNT bundles. For example, Zhao et al. Reference Zhao, Zhang, Tian, Huang and Wei25 proposed that space confinement and rotational stress could induce the bundles to grow as double helices of CNTs, mainly due to the interaction between the sample and the support arrays. Reference Cervantes-Sodi, Vilatela, Jimenez-Rodriguez, Reyes-Gutierrez, Rosas-Melendez, Iniguez-Rabago, Ballesteros-Villarreal, Palacios, Reiband and Terrones24 Particularly, nitrogen-doped carbon nanostructures could also improve the electronic properties and consequently the FE properties. Reference Jeong, Lee, Shin, Choi, Shin, Kang and Choi26–Reference Ghosh, Kumar, Maruyama and Ando28 Doping multiwalled CNTs (MWCNTs) with N atoms depends strongly on the fabrication method, but it is well established that the thermal decomposition of nitrogen-containing hydrocarbons over transition metal nanoparticles results in the formation of bamboo-like nitrogen-doped MWNT (CN x MWNTs). Reference Cruz-Silva, Cullen, Gu, Romo-Herrera, Munoz-Sandoval, Lopez-Urias, Sumpter, Meunier, Charlier, Smith, Terrones and Terrones29 For example, Ionescu et al. used different concentrations of acetonitrile (CH3CN) in xylene (C6H4(CH3)2) to produce CN x MWNTs. Reference Ionescu, Zhang, Li, Abou-Rachid and Sun30 In that investigation the amount of nitrogen was determined by x-ray photoelectron spectroscopy (XPS). They showed that the nitrogen reduced the length of the CN x MWNTs. On the contrary, the average CNT diameter increased along with the nitrogen content in the solution xylene–acetonitrile. From the Raman spectra, the I D/I G also increased with the N content, thus confirming the introduction of lattice disorder due to doping. The G-band shifted to smaller wave numbers when nitrogen was present in the sample, which constitutes an indirect evidence of changes in the electronic structure. Due to the relationship between the D-band and graphitic disorder, the crystallinity of CNTs could be measured by the I D/I G ratio. Smaller values of I D/I G imply larger crystallinity. Reference Maldonado, Morin and Stevenson31 However, in some circumstances, it seemed that this situation is valid only in the case of CN x MWNTs with low nitrogen content (<5–7%), namely a rise of N-doping in CNT could produce a drop in crystallinity according to the I D/I G ratio, but at higher nitrogen concentrations the I D/I G ratio is reduced, indicating a higher degree of crystallinity within the CNTs. Reference Sharifi, Nitze, Barzegar, Tai, Mazurkiewicz, Malolepsky, Stobinski and Wågberg32 In addition, it has been suggested that substitutional nitrogen is responsible for improving the FE properties. Reference Ghosh, Kumar, Maruyama and Ando28,Reference Padya, Jain, Padmanabham, Ravi and Bhat33 In this work, we report a single-step pressure-controlled CVD process, capable of growing arrays of aligned CN x MWNTs with different morphologies. Reference Terrones, Terrones, Grobert, Hsu, Zhu, Hare, Kroto, Walton, Kohler-Redlich, Ruhle, Zhang and Cheetham34–Reference Campos-Delgado, Romo-Herrera, Jia, Cullen, Muramatsu, Kim, Hayashi, Ren, Smith, Okuno, Ohba, Kanoh, Kaneko, Endo, Terrones, Dresselhaus and Terrones37 In particular, pine-tree-like bundle morphologies of CN x MWNTs can be selectively grown. Furthermore, we observed enhanced electron FE (at low turn-on voltages and high emission currents) from these pine-tree-like structures. Our results indicate that these “spiky” morphologies could be useful in the fabrication of efficient FE sources, in addition to sensors and other novel functional materials.
II. EXPERIMENTAL
To synthesize the pine-tree-like microstructures a modified CVD setup was used (see Fig. S1). Reference Perea-Lopez, Rebollo-Plata, Briones-Leon, Morelos-Gomez, Hernandez-Cruz, Hirata, Meunier, Botello-Mendez, Charlier, Maruyama, Munoz-Sandoval, Lopez-Urias, Terrones and Terrones14,Reference Terrones, Terrones, Grobert, Hsu, Zhu, Hare, Kroto, Walton, Kohler-Redlich, Ruhle, Zhang and Cheetham34 Solutions of benzylamine (C7H9N) and ferrocene (Fe(C5H5)2) were pyrolyzed. C7H9N was the N source and C10H10Fe was the catalyst source. Ar was used as the carrier gas with flow rates of 2.5 L/min. The experiments were carried out at 850 °C for 20 min. Approximately in the center of the quartz tube, three samples consisting of Si/SiO2substrates were placed. Substrates having dimensions of about 1 cm2 were separated with a distance of 1.0 cm between them. After the CVD reaction, the output gases passed through a small-diameter glass nozzle (i.d. ∼0.6 mm, see Fig. S1) instead of using a bubbler with acetone. With this configuration, the interior pressure in the CVD reactor is slightly above the external pressure. The residual CVD vapor is continuously bubbled into an ethanol container [see Fig. S1(d)]. Ethanol was chosen because its vapor pressure is lower than that of acetone, for instance. The residual aromatic molecules could be trapped in the ethanol, thus avoiding their release to the atmosphere. To monitor the pressure differences during CVD in both configurations (bubbler and nozzle), a Baratron transducer (MKS, accuracy 5%) was placed upstream close to the entrance furnace [see Fig. S1(a)]. The pressure reading when using the conventional acetone bubbler was of 9.2 mbar, while the pressure when using the nozzle configuration reached 19.5 mbar, an increase of 200% when compared to the conventional acetone trap/bubbler. It is important to emphasize that these measurements were relative to the atmospheric pressure.
The obtained samples (see Fig. S2 in supplementary information) were characterized by scanning electron microscopy (SEM) using a Leo 1530 FE-SEM (Carl Zeiss SMT Inc., Thornwood, NY) and Philips SEM XL-30 (Philips, Eindhoven, Netherlands). Raman spectroscopy studies were carried out in a Renishaw inVia Raman microscope, using a 514.5 nm laser excitation wavelength. FE measurements were carried out in a custom-made high vacuum (5 × 10⁻⁸ Torr) FE chamber. The distance between the sample and the anode was controlled by a linear movement actuator (MDC vacuum) activated with a stepper motor, with a step increase of 0.38 µm.
III. RESULTS AND DISCUSSION
Figure S3(a) (supplementary information) shows a drawing of the schematic view of a section of the quartz tube in which substrates 1, 2, and 3 were placed. The figure also illustrates a possible mechanism of how the feedstock flow on substrates 1, 2, and 3, labeled F1, F2, and F3, respectively. From very simple area calculations (total cross-sectional area of quartz tube minus the transversal area below the substrate), it is possible to estimate that the flow under the substrate is approximately 0.034 L/min, around 70 times smaller than the flow passing on top. From the cross-section shown in Fig. S3(b), it can be seen that the lower part of the substrate was exposed to relatively low amounts of the gaseous precursor, simply because there is less effective cross-sectional area. Figure S3(b) also shows the substrate and the reduced space located under the substrate, where r is the radius of the quartz tube (1.27 cm); L, the width of the substrate (1 cm); and the A 1 and A 2, the cross-sectional areas calculated from the radius and the size of the substrate. The geometry and size of the darker semicircular zone located at the edge of the substrate could be attributed to the effective cross-sectional area formed between the substrate and the arc of the quartz tube. However, it is quite possible that if substrates with very similar geometries were used, highly uniform growth zones could be obtained. Therefore, we could state that small changes in the overall pressure of the experiment could significantly affect the nanotube growth beneath the substrate. Similarly, it has been reported that a limited gas supply on catalytic substrates leads to dendritic structures. Reference Liu and Kong38
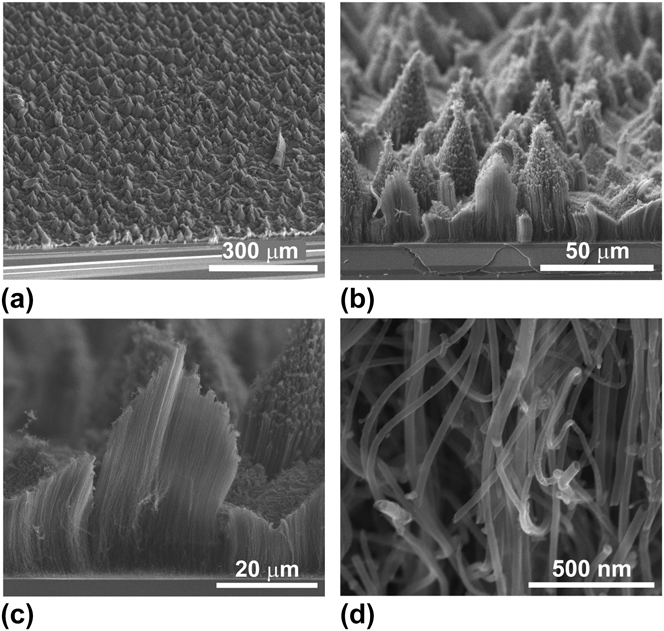
Figure 1 depicts the SEM images of vertically aligned CN x MWNTs with pine-tree-like morphologies grown on Si/SiO2 substrates. Figure 1(a) shows a 45° tilted view of a large CN x MWNTs array. Figure 1(b) shows a higher magnification of Fig. 1(a) in which each “pine tree” is formed by the vertically aligned CN x MWNTs. Individual nanotubes are clearly noticeable in Fig. 1(c), in which a “pine tree” of 40 µm height and 20 µm width has been transversally cut. Each pine-tree-like feature is formed by a bundle of CN x MWNTs arranged in a conical cluster. A high magnification SEM image reveals CN x MWNTs exhibiting diameters around 34 nm. All the average diameters were calculated by carrying out 100 individual measurements obtained from different SEM images [Fig. 1(d)]. For substrate 1, it was difficult to observe the pine-tree-like structure due to an abundant growth of nanotubes in addition to the formation of an amorphous carbon layer on the surface of the array (see Fig. S4 in the supplementary information). The morphology of the CN x MWNTs in substrate 3 was very similar to that observed on substrate 2, but the formation of “pine trees” was favored on substrate 2 (see Fig. S5 in the supplementary information).
(a–c) SEM images of pine-tree-like morphologies formed by CN x MWNTs tubes grown on the Si/SiO2 substrates. These pines were found upside down on substrate 2, named CN x -P2. The “pine tree” width average is 29.42 ± 5.86 μm and the average length is 39.47 ± 5.73 μm (the averages were obtained after measuring numerous structures from multiple SEM images). The cross-sectional cut of the sample shown in (c) reveals the tube composition inside the “pine trees,” and (d) shows a higher magnification image of the CNTs that compose a pine-tree-type bundle.

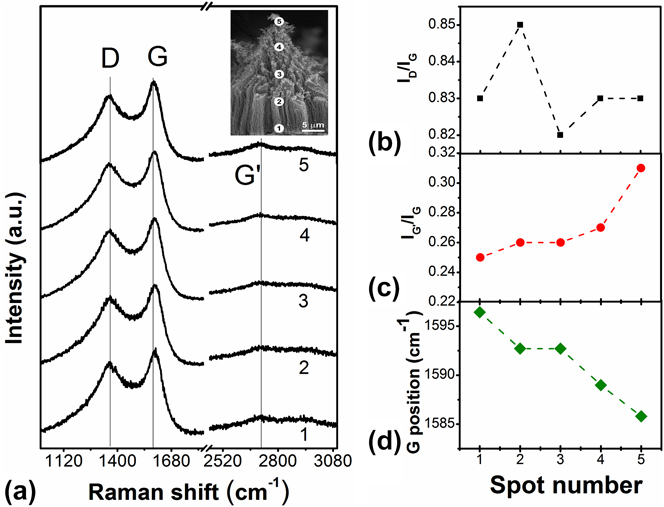
To study the degree of crystallinity of the pine-tree-like CN x MWNT structures, Raman spectroscopy measurements were carried out. Figure 2(a) shows the Raman spectra recorded along one representative pine-tree-like structure, as depicted in the inset (see points 1–5 in the SEM image). The spectra were monitored specifically at the first-order Raman G-band; the disorder-induced band known as D-band; and the G′-band, which is the overtone of the D-band. We focused on analyzing the changes observed in the intensity of the D-, G-, and G′-bands from the bottom to the top of the “pine tree” (from point 1 to point 5), and the position of G-band. Hence, the degree of crystallinity of the material was monitored as a function of: (i) the degree of disorder or the intensity I D/I G and I G′/I G ratios and (ii) the band shift of D, G, and G′ as a function of the position along the pine structures. We noted that the intensity ratios I D/I G for the five points are greater than 0.8, thus indicating a relatively high degree of disorder along the pine-tree-like structure. The I D/I G ratios are 0.83, 0.85, 0.82, 0.83, and 0.83 for the points 1, 2, 3, 4, and 5 respectively [see Fig. 2(b)]. Therefore, it is not possible to conclusively prove that CN x MWNTs are more crystalline from point 3 to point 5 with respect to point 1. Nevertheless, I G′/I G is an alternative parameter that can be used for quantifying disorder, since the G′-band feature also provides a very sensitive probe for characterizing specific sp 2 hybridized nanocarbons. The G′-band is more sensitive to shifts and thus useful for determining the level of defects. Reference Soin, Roy, Ray and McLaughlin39 Figure 2(c) exhibits the plot of I G′/I G intensity ratio, which increases as it approaches the tip. After point 3, the intensity of the G′-band shows a small increment from point 1 to 5 [see Fig. 2(a)]. The G′-band intensity appears to be higher in pure graphitic materials with low level of defects and decreases as the amount of defects increases. Reference Dresselhaus, Jorio, Hofmann, Dresselhaus and Saito40 The increment of the I G′/I G intensity ratio indicates a low degree of crystallinity on the base of the pine-like structures (points 1 and 2) and slightly higher crystallinity at the tips (from point 3 to point 5). These differences in crystallinity could be produced because at the initial growth process, below the substrates, a pattern was generated by the flow of the precursors Reference Tian, Li, Jiang, Li and Zuo41 ; in such a case, the initial CN x MWNTs growth was faster in some specific areas (the pine-tree top). However, due to the limited space beneath the substrates, some additional flow turbulences were probably generated producing more defects at the final part of the growth (root part). Figure 2(d) shows the position of the G-band in the spectra probed from point 1 to point 5 (1596.43 and 1585.8 cm−1, respectively). The observed tendency of the G-band position shows a shift toward larger wave numbers with respect to point 5 [see Fig. 2(a)]. The position of the G-band for sp 2 hybridized carbon appears at approximately 1582 cm−1 and it is in agreement with the values observed in doped nanocarbons. Reference Dresselhaus, Jorio, Hofmann, Dresselhaus and Saito40 For undoped MWCNTs, the metallic behavior could be enhanced by the introduction of a small quantity of N atoms. Reference Jeong, Lee, Shin, Choi, Shin, Kang and Choi26,Reference Wang, Shao, Matson, Li and Lin27 For example, Koos et al. showed that for undoped MWCNT fabricated with ferrocene 5 at.% in toluene, I D/I G is around 0.40 and for CN x MWNTs produced with 7.5 at.% in benzylamine, I D/I G is close to 0.88. Reference Koos, Nicholls, Dillon, Kertesz, Biro, Crossley and Grobert42 Liu et al. also measured the I D/I G ratios of three different CN x MWNTs samples fabricated with melamine; their results indicated that CN x MWNTs with 1.3, 3.2, and 4.5% of nitrogen content exhibit I D/I G ratios of 0.897, 1.333, and 1.553, respectively. Reference Liu, Zhang, Li, Sun, Desilets, Abou-Rachid, Jaidann and Lussier43 These previous results imply a high defect concentration in CN x MWNTs. The N-doping breaks the hexagonal symmetry, thus leading to shifts of the G-band toward values higher than 1582 cm−1. Reference Dresselhaus, Jorio, Hofmann, Dresselhaus and Saito40 The position of the G-band in our pine-tree-like structures is higher than the values reported for pure sp 2 hybridized carbon, Reference Dresselhaus, Jorio, Hofmann, Dresselhaus and Saito40 and the differences in the positions could be correlated with an increment of the nitrogen-doping level within the CNTs. Reference Gupta and Patel44 We have fabricated CN x MWNTs and undoped MWCNT using 2.5 at.% of ferrocene in toluene and benzylamine, respectively. The I D/I G ratios were 0.306 and 0.7769, respectively, for the undoped MWCNT and CN x MWNTs. These values are close to those reported by Koos et al. Reference Koos, Nicholls, Dillon, Kertesz, Biro, Crossley and Grobert42 (see Fig. S6 of supplementary information).
(a) Raman spectra from different zones of a pine-tree-like morphology (inset: SEM image showing labeled locations of the cone using 1, 2, 3, 4, and 5). The D-, G-, and G′-bands appear around 1362, 1596, and 2717 cm−1, respectively; (b) Intensity ratios of I D/I G (square symbols in black color) and (c) I G′/I G (circle symbols in red color). (d) Second-order G′-band shifts for the different locations.

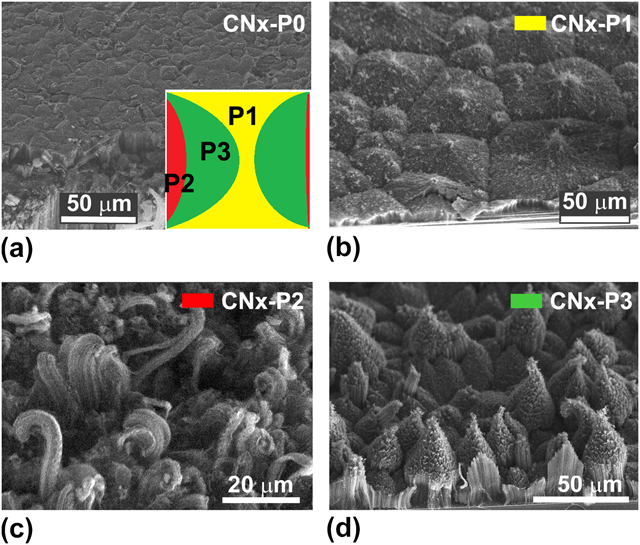
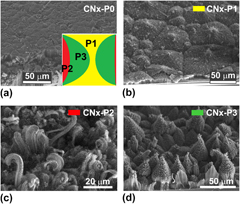
Figure 3 depicts the 45° tilted SEM images of CN x MWNTs grown on substrate 2, and Fig. 3(a) shows the morphology of CN x MWNTs tubes grown on top of the substrate, which was exposed directly to the feedstock [see Fig. S2(a)]. The resulting CNT array is formed by nanotubes of uniform length that contain an amorphous carbon layer on top. Figs. 3(b)–3(d) exhibit the structures formed below the substrate, which follow a pattern represented by the map drawn in the inset of Fig. 3(a). Such a map could help to identify the different zones below substrate 2, in which different structures, including “pine trees,” were found. In the map [see inset of Fig. 3(a)], the yellow zone represents the CN x MWNTs nanotube domains exhibiting polyhedral shapes [Fig. 3(b)]. Each polyhedron is 50–70 µm in size and exhibits a small zone in the center where the nanotubes are longer than the rest of the structure. The red zone indicates the region where the CN x MWNTs are arranged in columns of different sizes and diameters with nonuniform distribution (curled tips are also observed). Finally, the green zone is where the pine-tree-like structures were found abundantly [Fig. 3(d)]. We believe that CN x MWNTs tubes grew at different rates leading to these pine-tree-like morphologies. For an easy identification of samples with different structures, we named CN x MWNTs that grew on substrate 2 as CN x -P0 and the polyhedral, columns, and pine-tree shapes as CN x -P1, CN x -P2, and CN x -P3, respectively.
SEM images of CN x MWNTs arrays: (a) Well-aligned CN x MWNTs tubes preserving the same length with a deposited layer of amorphous carbon on top (labeled CN x -P0). Inset: schematic distribution of the pine-tree zones observed below substrate 2. (b) Aligned CN x MWNTs with certain resemblance to polygon-like morphologies (labeled CN x -P1/yellow zone in the map in (a). These structures were grown preferentially near the substrate edge. (c) Nanotube bundles grown on the substrate edge interacting directly with the feedstock input (labeled CN x -P2/red zone in the inset map). (d) Pine-tree-like morphologies of nanotubes arrays [labeled CN x -P3/green zone in the map in (a)].

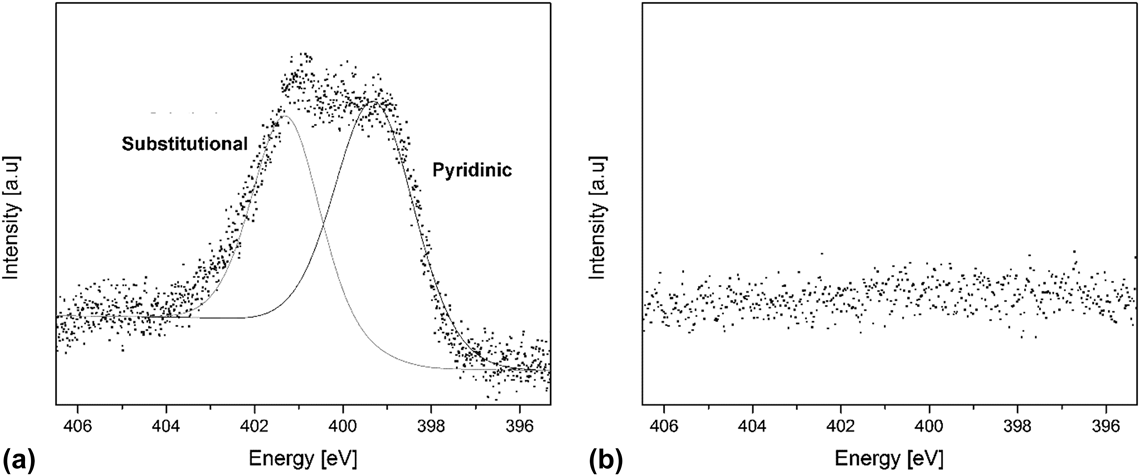
An XPS analysis was performed on the CN x samples (see Fig. 4). High resolution C1s, N1s, and O1s line scans were acquired. The presence of 1.9 at.% nitrogen in the sample was confirmed. Concentrations of carbon and oxygen were found to be 95.7 and 2.4%, respectively. The N1s line scan was carefully analyzed and curve fittings were performed using a Shirley background. Two main different nitrogen environments were detected at approximately 399 and 401 eV. These signals have been linked to N substitutionally immersed in the graphitic lattice and to pyridinic N. Reference Elias, Ayala, Zamudio, Grobosch, Cruz-Silva, Romo-Herrera, Campos-Delgado, Terrones, Pichler and Terrones45,Reference Lv, Li, Botello-Mendez, Hayashi, Wang, Berkdemir, Hao, Elias, Cruz-Silva, Gutierrez, Kim, Muramatsu, Zhu, Endo, Terrones, Charlier, Pan and Terrones46 Therefore, we can be sure that the nitrogen signal detected by XPS belongs to N that has been successfully introduced within the graphitic lattice of the tubes. The inset of Fig. 4 show the XPS C1s, O1s, and N1s line scans obtained from control-undoped MWNT samples. The nitrogen content found was absent, C1s and O1s were found at 98 and 2 at.%, respectively.
(a) XPS N1s line scan obtained from the CN x MWNT samples. The signal can be attributed to two main nitrogen-bonding environments: substitutional N and pyridinic N; (b) N1s line scan obtained from the control samples of undoped MWNT samples.

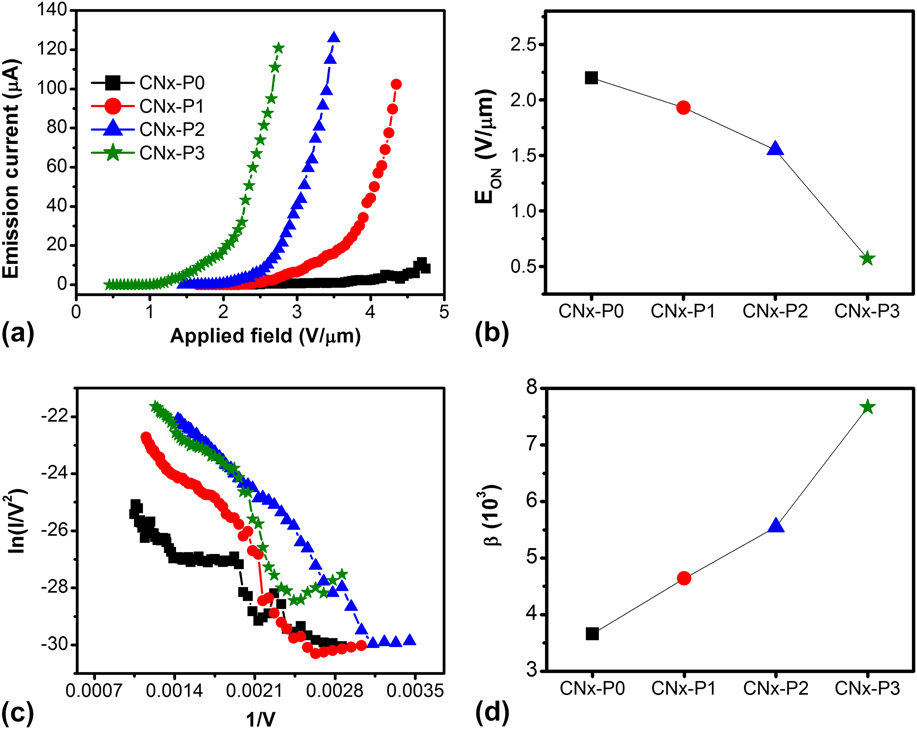
The electron FE properties of different regions of the substrates containing arrays of pine-tree-like structures, as well as the other structures, were determined by measuring the current versus the applied field [Fig. 5(a)]. The current was collected by a 1 cm2 copper anode, placed at 200 µm above a substrate containing the different CN x MWNTs morphologies explained above (Fig. 3). The FE properties of the samples were analyzed using the Fowler–Nordheim (FN) theory, which provides a quantitative description of the emission process. Reference Fursey47 Experimentally, the FN plot could be achieved by plotting (I/E 2) as a function of 1/V [see Fig. 5(b)]. Reference Sharma, Kaushik, Girdhar, Singh, Shukla and Vankar48 From this plot, it is possible to determine the field enhancement factor by measuring the slope s in the linear region using the expression: β = − Bϕ3/2 d/s, Reference Perea-Lopez, Rebollo-Plata, Briones-Leon, Morelos-Gomez, Hernandez-Cruz, Hirata, Meunier, Botello-Mendez, Charlier, Maruyama, Munoz-Sandoval, Lopez-Urias, Terrones and Terrones14 where B is a constant (6.83 × 10⁹ V eV3/2 m−1), ϕ is the work function (5 eV, the same as graphite), and d is the electrode separation distance (∼200 µm). Figures 5(a) and 5(c) show the current–field (I–E) curves and FN plots, respectively, for different micromorphologies.
(a) Electron FE curves for four different samples labeled CN x -P0, CN x -P1, CN x -P2, and CN x -P3; (b) the turn-on field measured from the FE curves as a function of different micromorphologies. Note that the FE currents are higher and an enhancement in the turn-on field are obtained with pine-tree-like morphologies; (c) F–N plot, and (d) the β factor value plot with different micromorphologies; the pine-tree-like structures exhibit the best FE performance.

From Fig. 5(a), it can be observed that the I–E curve for CN x MWNTs grown on the top side of the substrate (CN x -P0) yields to few microamperes of high field values, thus revealing a poor performance. This effect could be attributed not only to the accumulation of amorphous carbon “crust” on top of the forest but also to the flat shape of the substrate. Reference de Jonge and Bonard49 In this case, a turn-on voltage of 2.20 V/µm was needed to produce 100 nA of current. Bai et al. Reference Bai, Zhang and Zhang50 performed similar experiments using MWCNT arrays grown on silicon substrates, and found turn-on values above 2.11 V/µm. For the CN x -P1 sample (polyhedral structure), the FE curve exhibited a better response (turn-on field of 1.93 V/µm, 13% lower than that of CN x -P0). The reduction of the turn-on field for CN x -P1 with respect to CN x -P0 could be attributed to the electrons localized in the small bundles that outstand from the center of polyhedrons [see Fig. 3(b)]. These protuberances allow electrons to be emitted easily. For CN x -P2 (cylindrical bundles), the emission properties are considerably better than those of the polyhedral structure, and the turn-on field is around 1.55 V/µm, which is even lower than that of the individual bundles. Reference Perea-Lopez, Rebollo-Plata, Briones-Leon, Morelos-Gomez, Hernandez-Cruz, Hirata, Meunier, Botello-Mendez, Charlier, Maruyama, Munoz-Sandoval, Lopez-Urias, Terrones and Terrones14 In addition, we observed that the arrays of cylindrical bundles are not uniform and some of them bend and curl, thus affecting the FE performance. The screening effect between adjacent CNT bundles could also affect the emission properties. Reference Zeng and Ren51 For CN x -P3, bundles with pine-like morphology, the I–V curve has an exponential behavior showing turn-on fields of 0.59 V/µm. Figure 5(b) shows the turn-on field (E ON) values as a function of the structure type. One can clearly observe that the lowest turn-on fields correspond to the pine-tree-like structures, attributed to the conical geometrical structure, Reference de Jonge and Bonard49,Reference Eletskii and Bocharov52 which has more emitting sites than the polygonal structures (CN x -P1) but have enough separation to avoid the screening effects observed for cylindrical bundles (CN x -P2). The observed value of E ON for the CN x MWNTs with pine-like morphology (0.59 V/µm) is lower than those reported for other materials, such as Ga-doped ZnO nanopins (1.92 V/µm). Reference Sun53 It is also lower than those of CN x MWNTs arrays (1.80 V/µm), Reference Ghosh, Kumar, Maruyama and Ando28 but is in the range of pure nonaligned MWCNT (0.75 V/µm). Reference Lahiri, Seelaboyina, Hwang, Banerjee and Choi54 However, it is higher than the turn-on voltage of long individual bundles of CNTs (0.18 V/µm). Reference Perea-Lopez, Rebollo-Plata, Briones-Leon, Morelos-Gomez, Hernandez-Cruz, Hirata, Meunier, Botello-Mendez, Charlier, Maruyama, Munoz-Sandoval, Lopez-Urias, Terrones and Terrones14 Yu and Zheng studied the effect of nitrogen doping on the electronic and FE properties of CNTs, carbon nanocones, and graphene nanoribbons. Reference Yu and Zheng55 They demonstrated that the doping of N atoms into CNT can improve the FE properties of these carbon-based materials. Killian and collaborators also reported FE properties of CNT pillar arrays. Reference Killian, Zuckerman, Niemann, Ribaya, Rahman, Espinosa, Meyyappan and Nguyen56 They found emission at fields as low as 0.9 V/µm (much lower than those of the continuous arrays Reference Jo, Tu, Huang, Carnahan, Wang and Ren57 ) and stable current densities of 10 mA/cm2 at an average field of 5.7 V/µm with a very low percentage of standard deviation. However, it is noteworthy that our results demonstrate that the pine-tree morphology is optimal for FE and the presence of nitrogen can enhance these properties further.
We also calculated the field intensification factor (β) from the FN plots shown in Fig. 5(c). Figure 5(d) depicts the plot of β factor as a function of the different bundle morphologies. The β factor value was lower for CN x -P0 (3.66 × 10³), CN x -P1 (4.64 × 10³), and CN x -P2 (5.55 × 10³), when compared to the β factor of pine-tree-like structures (7.67 × 10³). From these results, it was clear that the “spiky” structures showed the best FE properties, and the conical clustering and increased separation between pines improve the turn-on fields and the β factor, Reference Bonard, Salvetat, Stockli, Forro and Chatelain13 which is superior than that reported for aligned arrays of CN x MWNTs (2000). Reference Ghosh, Kumar, Maruyama and Ando28 The current stability versus time for pine trees measured during approximately four days is included in the SI (Fig. S7). In Table S1 (see supplementary information) a description of different results obtained in this work and their relationship with the processing parameters is shown. In the same table other results published in the literature are included. From Table S1, it is now possible to observe that very less information is available about the relationship between the electron FE properties of CN x MWNTs and their N-concentration and the type N-incorporation within the CNT matrix. Additionally, it can be seen that although the bundles of CNTs exhibit enhanced FE properties, Reference Perea-Lopez, Rebollo-Plata, Briones-Leon, Morelos-Gomez, Hernandez-Cruz, Hirata, Meunier, Botello-Mendez, Charlier, Maruyama, Munoz-Sandoval, Lopez-Urias, Terrones and Terrones14 the mats of CN x MWNTs fabricated with camphor and 5.2% of nitrogen content can also display a good FE performance, Reference Ghosh, Kumar, Maruyama and Ando28 similar to the pine-tree-like CN x MWNTs.
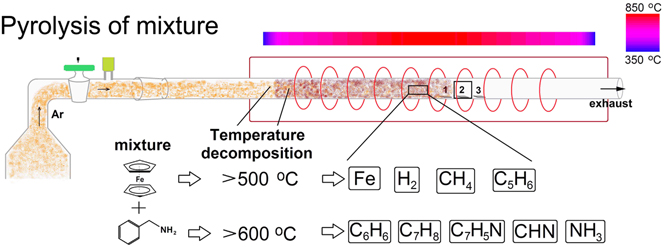
To explain the growth mechanism of the pine-tree-like morphologies in CN x MWNTs tube forests, it is important to realize that the transport of the nebulized cloud containing ferrocene (Fe(C5H5)2) and benzylamine (C7H9N) was carried out by a flux of Ar. Figure 6 schematically shows how the process may occur during CVD. Figure 6 depicts a drawing of the pyrolysis process involving ferrocene and benzylamine. In short, the aerosol mixture (shown in orange color) is carried by the Ar flux. This cloud is then decomposed inside the furnace zone. As the cloud enters the furnace, the decomposition of ferrocene occurs at temperatures higher than 500 °C, thus releasing Fe atoms, small iron clusters and nanoparticles, and hydrocarbon side-products (Fe(C5H5)2 → Fe + H2 + CH4 + C5H6 + C9H8 + etc.). Reference Barreiro, Hampel, Rummeli, Kramberger, Gruneis, Biedermann, Leonhardt, Gemming, Buchner, Bachtold and Pichler58,Reference Leonhardt, Hampel, Muller, Monch, Koseva, Ritschel, Elefant, Biedermann and Buchner59 Simultaneously, the benzylamine gets decomposed at temperatures >600 °C, leading to benzene (C6H6), toluene (C7H8), benzonitrile (C7H5N), hydrogen cyanide (CHN), and ammonia (NH3). This thermal decomposition yields to the gas phase feedstock (see burgundy color inside the quartz tube; Fig. 6). In this process, the iron clusters and nanoparticles, which are chemically reactive, tend to form spherical agglomerates covered with carbon multishells. However, an excess of carbon leads to the formation of single- or multiwall carbon nanotubes instead of multishell-covered nanoparticles. Reference Koprinarov, Konstantinova and Marinov60 Such nanoparticle agglomerates can reach 50 nm of diameter and are composed of pure iron, iron carbide, or both in a core–shell structure; these phases are formed between 400 and 800 °C. This process is carried out using standard CVD synthesis conditions (e.g., atmospheric pressure and uniform gas flow), where the resulting material grows uniformly and the CNTs start growing in a vertically aligned manner after a few seconds. Reference Hiraki, Jiang, Wang and Hiraki22,Reference Zhang, Li, Tan, Lolli, Sakulchaicharoen, Requejo, Mun and Resasco61,Reference Bower, Zhu, Jin and Zhou62 For the different substrate locations, we noted that the flux of the incoming gaseous species traveling inside the quartz tube is affected significantly beneath the substrates due to reduced space between the substrate and the quartz tube. These conditions locally affect the distribution of the agglomerated catalytic metallic nanoparticles, thus leading to the nucleation and growth of CNTs at different rates.
Schematic representation of the CVD process involving ferrocene (Fe(C5H5)2) and benzylamine (C7H9N) mixtures.

To visualize the different morphologies grown on substrate 2, Fig. S8 shows a hypothetical drawing representing the SEM micrograph of substrate 2 after the CVD experiment [see Fig. S2(b)]. Here, the representation of different microstructures produced with CNTs are colored; the small blue circles represent the regions where the cylindrical bundles grow; the big blue circles with a black point in the center correspond to small columns with an almost complete pine-tree-like morphology. Next to these structures is a red zone where pine trees with different diameters are formed (green circles with a dark green point in the center). The red regions correspond to aligned CNTs with a similar size. Next to the “pine trees,” polygonal structures were formed. At the center of these polygonal objects, there is a small bundle emerging as seen in the image (yellow point). Additionally, the diameter of the bundles that grow at the entrance matches with the sizes of the bundles located at the center of the pine trees and the polygons.
IV. CONCLUSION
In summary, pine-tree-like morphologies made of CN x MWNTs were synthesized by a pressure-controlled CVD method. A SEM characterization of the sample showed different types of microstructures composed of CN x MWNTs (pine trees, bundles, and polygons). FE measurements on the samples revealed that the pine-tree-like morphologies have a larger field enhancement factor and higher emission current at relatively low turn-on voltages (e.g., 0.59 V/µm), thus making them potentially attractive for applications in electronic devices. The cylindrical bundles have a smaller field enhancement factor that may be due to screening effects. However, highly ordered pine-tree-like nanostructures fabricated in only one step overcome this and possess larger FE enhancement factors.
Supplementary Material
To view the supplementary material for this article, please visit http://dx.doi.org/jmr.2014.262.
ACKNOWLEDGMENTS
We thank Dr. Miguel Angel Mendez Rojas for critical reading of this manuscript. We also thank the Air Force Research Laboratory for its partial support of this work via grant FA9550-08-1-0204. This work was also supported in part by CONACYT-Mexico grants: FondoMixto de San Luis Potosí 63001 S-3908 and 63072 S-3909 (EMS), 48300 (EMS), CB-2008-SEP-107082 (EMS), CB-2008-SEP-106942 (EMS), and CONACyT scholarships (MLGB and JOM). MLGB also thanks the Physics Department at the Penn State University and LINAN for the development of the PhD thesis project. MLGB thanks H.R. Gutiérrez, R. Lv, and A. Castro for their technical support and fruitful discussions.