Implications
Dairy farming systems are facing major changes and uncertainty related to price volatility, socio-cultural values and political aspects. At the same time, they are considered as exerting pressure on the environment and animal welfare. Consequently, there is a social demand for developing alternative farming systems. Increasing input self-sufficiency constitutes a possible pathway to design systems that are more sustainable and able to operate in this changing context. In this perspective, it is crucial to understand the role of input self-sufficiency in the sustainability of dairy farms, using an indicator based on several technical inputs – for example, animal feeding, fertilisers and energy.
Introduction
In recent decades, the development of intensive and specialised livestock farming systems has been called into question due to detrimental effects on animal welfare and the environment (Ten Napel et al., Reference Ten Napel, van der Veen, Oosting and Koerkamp2011). Moreover, farmers now have to operate in a context characterised by unprecedented change and high uncertainty, such as volatility in agricultural product prices, increases in production costs, changes in agricultural policies and socio-cultural values (Astigarraga and Ingrand, Reference Astigarraga and Ingrand2011; Dumont et al., Reference Dumont, Fortun-Lamothe, Jouven, Thomas and Tichit2013). As a consequence, there is currently lively scientific and public debate about the future evolution of livestock production (Bernués et al., Reference Bernués, Ruiz, Olaizola, Villalba and Casasús2011) and the development of alternative systems (Dumont et al., Reference Dumont, Fortun-Lamothe, Jouven, Thomas and Tichit2013).
Several authors agree that increasing self-sufficiency provides one way to develop more sustainable agricultural systems in such an uncertain context (López-Ridaura et al., Reference López-Ridaura, Masera and Astier2002; Vilain, Reference Vilain2008; Bernués et al., Reference Bernués, Ruiz, Olaizola, Villalba and Casasús2011). Broadly defined, self-sufficiency is ‘the capacity of the system to regulate and control its interaction with the environment’ (Bernués et al., Reference Bernués, Ruiz, Olaizola, Villalba and Casasús2011). Farm self-sufficiency can be considered at three levels as follows (Ruiz et al., Reference Ruiz, Santamaria, Arandia, Del Hierro, Icaran, Intxaurrandieta, Lopez, Mangado, Nafarrate and Pinto2011): (1) decision-making; (2) financial – that is, related to subsidies and debts; and (3) technical – that is, related to the use of external inputs. Our paper specifically focusses on this last level – input self-sufficiency – that Vilain (Reference Vilain2008) defined as ‘the capacity of a farm to produce goods and services from its own resources, i.e., with a minimal amount of external inputs’.
Input self-sufficiency is known to have economic, environmental and societal assets. First, in the coming years, the agricultural sector will probably be confronted with an increase in input and energy prices, because of competition for various land uses (feed, food, fuel) and depletion of oil resources (Bernués et al., Reference Bernués, Ruiz, Olaizola, Villalba and Casasús2011). In this context, the most self-sufficient systems will keep lower production costs, giving them a comparative economic advantage. Indeed, systems that are less dependent on inputs are less affected by resource scarcity and price volatility (Bernués et al., Reference Bernués, Ruiz, Olaizola, Villalba and Casasús2011). Second, because of a lower consumption of inputs such as mineral fertilisers, pesticides and animal feed, self-sufficient systems also have a lower impact on the environment (Vilain, Reference Vilain2008; Raveau, Reference Raveau2011). Finally, from a societal point of view, input self-sufficiency, especially regarding animal feeding, improves the traceability of the products (Paccard et al., Reference Paccard, Capitain and Farruggia2003).
In the literature, input self-sufficiency has often been used as an attribute of sustainability in livestock farming system analyses (e.g. López-Ridaura et al., Reference López-Ridaura, Masera and Astier2002; Ripoll-Bosch et al., Reference Ripoll-Bosch, Díez-Unquera, Ruiz, Villalba, Molina, Joy, Olaizola and Bernués2012). It has also been considered as a key principle of agro-ecology for animal systems (Dumont et al., Reference Dumont, Fortun-Lamothe, Jouven, Thomas and Tichit2013), as well as a strategy to improve their resilience (Darnhofer, Reference Darnhofer2010). However, few studies have focussed on input self-sufficiency of dairy farms, although dairy production usually depends on many inputs (Thomassen et al., Reference Thomassen, Dolman, van Calker and de Boer2009). Moreover, existing studies have analysed feed self-sufficiency without including other inputs such as mineral fertilisers or veterinary products (see, for instance, Paccard et al., Reference Paccard, Capitain and Farruggia2003). Therefore, some issues related to input self-sufficiency of dairy farming systems need to be assessed in an objective and reproducible way – for example, what are the relationships between input self-sufficiency and economic, environmental and social farm performances? Does input self-sufficiency involve specific structural characteristics? How do self-sufficient farms react to external changes – for example, changes in milk price?
To address these issues, this work has the following three objectives: (1) to identify structural characteristics required by specialised dairy farms located in the grassland area to be self-sufficient; (2) to analyse the relationships between input self-sufficiency, economic and environmental sustainability, as well as to explore whether self-sufficiency allows the farms to conciliate these two sustainability dimensions; and (3) to study the economic impact of a decrease in milk price according to input self-sufficiency. In this article, we address these three objectives through the analysis of the input self-sufficiency of 365 specialised dairy farms located in the grassland area of Wallonia, the southern part of Belgium.
Material and methods
Farm sample
To analyse the relationships between input self-sufficiency, structure, economic and environmental sustainability, we used data derived from two regional farm accounting databases (that is, Agricultural Economic Analysis Department and Walloon Breeders Association). These databases mainly included socio-economic and inputs-related data such as amounts of animal feed or mineral fertilisers.
From these databases, we first selected a sample of 478 specialised dairy farms. Farms were considered as specialised according to the definition of the European typology: in these farms, at least 66% of the total standard gross margin was originated from dairy cattle (European Commission, 2012). On the basis of a diversity analysis, 80 farms were excluded from this set because they were less specialised in milk production (e.g. they had secondary cash crop or meat production activities) or they highly differed from the main farm groups identified (Lebacq et al., unpublished results). In order to avoid confusing the effect of input self-sufficiency with that of organic production method, we considered separately conventional and organic dairy farms: 335 conventional dairy farms were used in the core of this study; 30 organic dairy farms were managed independently and characterised at the end of the result section; and 33 farms for which the information – organic or conventional – was not known were excluded from the analysis.
Data were available for 2008 and 2009. The year 2008 was considered as the reference year, and 2009 was used to follow the evolution of economic results in a situation where the milk price drops sharply. Indeed, 2009 was characterised in Europe by an average decrease in the milk price of 24%, compared with 2008 (European Commission, 2014).
Selection of an indicator of input self-sufficiency
Various indicators could be used as proxy to assess input self-sufficiency of dairy farms at farm scale – that is, to assess the extent to which the farms use small or large amounts of off-farm inputs. We considered the following two selection criteria: (1) the indicator should be measurable from the data available in our two databases; and (2) the indicator should not focus only on one input, such as concentrate feed, but include several ones. In addition, indicators expressed per 1000 l of milk were not suitable for our farm sample. Indeed, even if the farms were specialised in dairy production, some of them also had minor secondary activities such as beef, pork, poultry or crop production. Available data did not allow the inputs to be correctly allocated between these different activities. Therefore, indicators expressed per unit of product were not used. From these criteria, we first selected the indicator of economic dependence, which was calculated as follows: the sum of the variable costs of animal (e.g. feed, veterinary products) and crop (e.g. seeds, fertilisers, pesticides) production – excluding contract working – and the fixed costs of electricity and energy (i.e. fuel, lubricants and other energy sources) use, divided by the total gross product excluding subsidies (Raveau, Reference Raveau2011). In order to facilitate the interpretation of the indicator, we calculated an indicator of economic autonomy (EA) – that is, 1 – economic dependence. The higher this indicator value, the lesser the farm uses inputs and the more the farm is self-sufficient regarding these inputs.
EA classes and comparison among classes
In 2008, the 335 conventional farms had an average EA of 62±8%Footnote 1 . In order to compare farm structure (i.e. land use, scale and intensity of production), economic and environmental performances according to their EA, these farms were categorised into four classes. The classes were defined from the following quartiles of EA in our conventional sample: 57% (quartile 0.25), 62% (median) and 68% (quartile 0.75). The classes were called Auto−− (with the lowest degree of EA), Auto−, Auto+ and Auto++ (with the highest degree of EA).
First, these classes were characterised and compared for several structural indicators, using the Kruskal–Wallis and multiple comparison tests. Owing to the characteristics of the farm sample, this characterisation was performed regardless of productive and pedoclimatic constraints: our farm sample only included specialised dairy farms, and 93% of them were located in two agro-ecological regions specialised in dairy production (Région herbagère liégeoise and Haute-Ardenne), in which the agricultural area (AA) is mainly covered by permanent grassland and forage crops.
In order to compare the sustainability of EA classes, we used the canonical discriminant analysis. This method allows the differences among groups of individuals (here, the EA classes) to be characterised through simultaneously considering several quantitative variables measured on these individuals (here, the sustainability indicators) (Cruz-Castillo et al., Reference Cruz-Castillo, Ganeshanandam, MacKay, Lawes, Lawoko and Woolley1994). To perform this analysis, we used a set of sustainability indicators (Supplementary Table S1) selected according to the process described by Lebacq et al. (Reference Lebacq, Baret and Stilmant2013). In order to identify differences among classes according to sustainability performance, we excluded from this set all indicators linked to farm structure, such as stocking rate, permanent grassland area and economic specialisation. As a result, 10 environmental indicators and nine economic indicators were introduced as variables in the discriminant analysis (Supplementary Table S1).
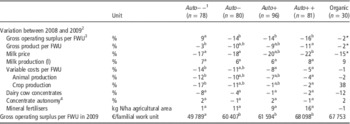
Third, we studied how the farms reacted to the decrease in milk price of 2009, according to their level of EA. We centred this analysis on the farm income per work unit, because it represents a key aspect for maintaining farms in the agricultural landscape. Farm income is the difference between the gross operating surplus – that is, the total gross product (including subsidies) minus variable costs, fixed costs, salary and farm renting – and the financing costs and depreciation. As financing costs and depreciation were not computed in the same way in our two databases, we used the gross operating surplus per familial work unit as proxy for the farm income per work unit. In order to study the evolution of this indicator between 2008 and 2009, we calculated the variation of gross operating surplus per familial work unit between 2008 and 2009 and compared this variation among classes through the Kruskal–Wallis and multiple comparison tests. To help understand how the farmers dealt with this crisis, we also calculated and compared among classes average variations of variable costs, gross product, milk production and input use.
Characterisation of organic farms
As organic farms are part of the agricultural landscape, we aimed to explore the relationship between organic farming and EA. Organic farms had an average EA of 69±9%, similar to the average of Auto++ (P=0.5). Moreover, 63% of organic dairy farms had an EA >68% – that is, the border value defining the class Auto++. Therefore, we compared the organic farms with the class Auto++ for various structural, environmental and economic (including the variation of gross operating surplus per familial work unit between 2008 and 2009) indicators through the Kruskal–Wallis tests.
Results
Characterisation of EA classes
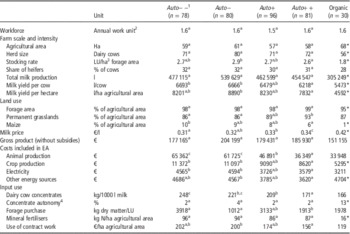
Structural features of each class are shown in Table 1 Footnote 2 . All classes were similar in terms of workforce, AA, herd size, share of heifers and total milk production. Regarding production intensity, Auto++ had lower milk production per hectare and stocking rate than Auto−, and lower milk production per cow compared with Auto− and Auto−−. All classes were forage based, with identical proportions of forage area in the AA. However, the proportions of grassland and maize differed among classes: Auto++ had a higher proportion of permanent grassland in the AA, compared with Auto− and Auto−−, and a lower proportion of maize, compared with Auto−−.
Mean structural characteristics of organic and conventional dairy farms according to their degree of economic autonomy (2008)

LU=bovine livestock units; EA=economic autonomy.
a,b,cMean values within a row with different superscripts differ significantly at P<0.05.
1 Auto−−: dairy farms with an EA <57%; Auto−: between 57% and 62%; Auto+: between 62% and 68%; and Auto++: >68%.
2 Annual work units include familial and salaried work units. For familial workforce, 1 work unit is a farmer (or the spouse) who works full time on the farm. For salaried workforce, the value of one work unit corresponds to 1800 h/year.
3 Livestock units were calculated from regional coefficients based on animal dietary needs.
4 Proportion of livestock concentrates (in kg) produced on the farm.
*Significant differences between the mean values of organic farms and Auto++ farms at P<0.05.
From an economic point of view, the four classes had similar gross product, despite a slight increase in the price for the milk delivered to the dairy according to the EA level. Auto++ had costs related to electricity use, animal and crop production significantly lower than Auto− and Auto−−, whereas Auto+ showed intermediate average values. The difference between extreme classes Auto++ and Auto−− was particularly large for costs of animal production (44%). Indeed, Auto++ used significantly less dairy cow concentrates. This class also bought less forage than Auto−− Footnote 3 . Variations of crop production costs among classes were not associated with significant differences in terms of nitrogen fertiliser use. Auto++ had energy costs smaller than Auto−, but did not compensate it by a greater use of contract workers.
Canonical discriminant analysis
The canonical discriminant analysis identified three canonical variables. All were significant – that is, the canonical correlation coefficients were significantly different from 0. The first canonical variable had an eigen value >1 and explained 95.7% of the total between-class variance, against only 2.3% and 2.0% for the second and third variables, respectively (details of the analysis are provided in Supplementary Table S5). It means that the differences among the four classes were important mainly in one direction. Consequently, we did not consider the second and third canonical variables in the description of the results.
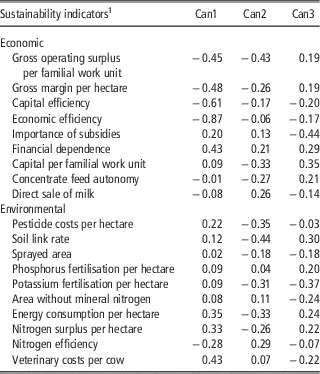
The first canonical variable was interpreted from the correlations with the initial variables – that is, environmental and economic indicators (Table 2). The first canonical variable was positively correlated mainly with the financial dependence (i.e. the ratio annuities/gross operating surplus), veterinary costs, energy consumption per hectare and nitrogen surplus per hectare (for details on the indicators, see Supplementary Table S1). On the other hand, the first canonical variable was negatively correlated mainly with the economic efficiency (i.e. the ratio gross operating surplus/gross product including subsidies), capital efficiency (i.e. the ratio value added/total capital excluding land), gross margin per hectare and gross operating surplus per familial work unit. In other words, this variable represented the environmental and economic performances of the farms: low values of the first canonical variable corresponded to farms with low environmental impact and good economic results.
Total canonical structure: correlations between the economic and environmental indicators, and the three canonical variables

1 For definitions of indicators, please refer to Supplementary Table S1.
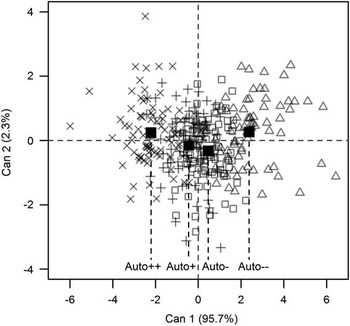
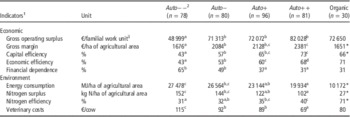
Conventional farms and means of EA classes were plotted on the first two canonical variables (Figure 1). As expected, the differences among classes occurred mainly along the first axis. Figure 1 highlights a gradient of EA along the first canonical variable: classes with higher EA degree had significantly lower values on this variable. On the basis of the interpretation of the first canonical variable, more autonomous classes were, therefore, characterised by better environmental performance – that is, lower nitrogen surplus per hectare, energy consumption per hectare, veterinary costs and higher nitrogen efficiency – and higher economic performance – that is, higher economic efficiency, capital efficiency, gross operating surplus per familial work unit, gross margin per hectare and lower financial dependence. These observations were globally confirmed by comparing the mean values among classes (Table 3).
Plotting of conventional dairy farms and means of economic autonomy classes on the first two canonical variables. ■ Means of economic autonomy classes. × Farms belonging to the class Auto++;+Auto+; □ Auto−; ∆ Auto−−.

Mean economic and environmental results of organic and conventional dairy farms according to their degree of economic autonomy (2008)

a,b,c,dMean values within a row with different superscripts differ significantly at P<0.05.
1 For detailed definitions, please refer to Supplementary Table S1.
2 Auto−−: dairy farms with an economic autonomy <57%; Auto−: between 57% and 62%; Auto+: between 62% and 68%; and Auto++: >68%.
3 One familial work unit is a farmer (or the spouse) who works full time on the farm.
*Significant differences between the mean values of organic farms and Auto++ farms at P<0.05.
Economic impact of the sharp decrease in milk price of 2009
In average, the milk price decreased by 19±9% in our conventional farm sample between 2008 and 2009. As a consequence, the farm income per familial work unit decreased by 9±29%, with a considerable variability among farms. This variability was also found within EA classes. Nevertheless, the average income variation significantly differed between the class Auto−− and the other three classes. The income of Auto−− was favourably impacted with a slight average increase, whereas the other classes experienced an average income decrease. This may be partly explained by the following two aspects: the variation of variable costs and the variation of the gross product (Table 4). First, the average variable costs decreased more sharply for Auto−−. This variation was mainly related to the variation of animal production costs, as reflected by the high correlation between both indicators (0.99, Pearson test P<0.001). The variation of concentrate use and concentrate autonomy was identical across classes. However, performing t testsFootnote 4 for each class showed that Auto−− significantly decreased the use of dairy cow concentrates (P<0.001), whereas the average variation of concentrate use was not significantly different from zero in the other classes. Second, the decrease in the average gross product of Auto−− was less marked than for other classes due to a lower average decrease in the milk price. Despite these two characteristics, the class Auto−− had, in 2009, the lowest average farm income per familial work unit (Table 4).
Average economic impact of the milk price crisis of 2009 on organic and conventional dairy farms according to their degree of economic autonomy

FWU=familial work unit.
a,bMean values within a row with different superscripts differ significantly at P<0.05.
1 Auto−−: dairy farms with an economic autonomy <57%; Auto−: between 57% and 62%; Auto+: between 62% and 68%; and Auto++: >68%.
2 Variation was calculated as follows: 100×((Value of 2009−Value of 2008)/Value of 2008), except for the concentrate autonomy and mineral fertilisers for which the variation was calculated as: (Value of 2009−Value of 2008), because of the presence of 0 values.
3 One FWU is a farmer (or the spouse) who works full time on the farm.
4 Proportion of livestock concentrates (in kg) produced on the farm.
*Significant differences between the mean values of organic farms and Auto++ farms at P<0.05.
Comparison between organic and Auto++ conventional dairy farms
Compared with the class Auto++, organic farms employed similar workforce for a smaller dairy herd and lower total production. They were more extensive systems with lower milk yield and stocking rate. They had a wider AA, characterised by a low proportion of maize. They obtained a significantly higher milk price, allowing them to achieve a similar gross product from smaller milk volumes. Organic farms used similar amounts of dairy cow concentrates but produced a larger proportion of the concentrates on the farm. They also used no mineral fertilisersFootnote 5 (Table 1). Regarding sustainability performance, organic farms had economic results similar to those of Auto++ – that is, income per work unit and economic efficiency – but a lower environmental impact – that is, energy consumption and nitrogen surplus per hectare (Table 3). In 2009, the organic milk price was less affected by the crisis than the conventional price. As a result, the average income per familial work unit of organic farms decreased less sharply compared with Auto++ (Table 4).
Discussion and perspectives
Specialised and intensive livestock farming systems were developed from an industrial paradigm focussing on practice simplification and standardisation, as well as intensive use of inputs (Kirschenmann, Reference Kirschenmann2007). As such systems have been called into question, increasing input self-sufficiency may constitute a key principle to improve sustainability of livestock farming systems (Dumont et al., Reference Dumont, Fortun-Lamothe, Jouven, Thomas and Tichit2013). In this study, we used the indicator of EA as proxy to assess input self-sufficiency of dairy farms. Comparison among EA classes shows inefficiencies of some farms in the use of technical inputs, and therefore underlines the possibility of reducing input use, especially animal feeding, without decreasing the total milk production.
Efficient use of inputs, structural characteristics and sustainability performance
In our case study, reducing input use is achieved by class Auto++ without involving a larger production of concentrates on the farm. As found by Guerci et al. (Reference Guerci, Knudsen, Bava, Zucali, Schönbach and Kristensen2013), it is associated with higher proportion of permanent grassland and less maize in the AA. Indeed, permanent grasslands require less mineral fertilisers and crop protection products than crops (Raveau, Reference Raveau2011). However, this result differs from other studies underlining the benefit of combining crop and livestock production to reduce input use (Ryschawy et al., Reference Ryschawy, Choisis, Choisis, Joannon and Gibon2012). We assume that this is related to pedoclimatic characteristics of the study area that are poorly suited to crop production. As a result, the AA is covered mainly by permanent grassland that constitutes the main resource for livestock (through grazing or mowing). Growing maize in this area is often associated with the quest for high production levels involving an intensive use of inputs and explaining the higher costs of livestock production.
Concerning the environmental and economic sustainability, our results show that increasing the EA level allows the farms to have better environmental and economic results. From an environmental point of view, several studies have reported that farms using fewer concentrates and mineral fertilisers have lower nitrogen surplus and energy consumption (Hansen et al., Reference Hansen, Alrøe and Kristensen2001; Paccard et al., Reference Paccard, Capitain and Farruggia2003; Meul et al., Reference Meul, Passel, Fremaut and Haesaert2012). In our case study, this relationship was established whatever the unit in which the indicators were expressed: per hectare or per unit of product. We found, for a subsample of 205 farms fully specialised in dairy production, a gradual decrease in the average energy consumption per 1000 l when the EA level increased (data not shown). The higher use of inputs of Auto− and Auto−− does not involve a similar increase in milk production, and therefore results in lower nitrogen efficiency and higher energy consumption per 1000 l.
From an economic point of view, the good economic results of farms with a high EA degree can be explained by three aspects. First, using fewer inputs for an equivalent level of milk production allows the farms to reduce their variable costs without affecting the gross product, and therefore have a positive effect on their income. Second, in our case study, Auto++ farms received in 2008 a milk price slightly higher than other farms. Higher prices could be explained by the production of higher quality milk – for instance, in terms of protein content or number of somatic cells, or by the delivery of milk to a specific dairy paying higher price. Third, the use of EA as indicator to categorise the farms into four classes plays a role in these economic results. Indeed, EA is also an indicator of economic efficiency. It explains the strong correlation between economic efficiency, capital efficiency and the first canonical variable. Nevertheless, we observed that the first canonical variable was also correlated with other economic indicators such as gross operating surplus per familial work unit and financial dependence.
Inefficiencies in input use observed in our farm sample, especially in terms of animal feeding, could be related to path dependency on past agricultural policies and evolution trajectories. Since the Second World War, agricultural subsidies have been based on the output level, which pushed the farmers to consider the gross yield as their main production objective (Vanloqueren and Baret, Reference Vanloqueren and Baret2008). In addition, the increase in labour productivity and the process of practice standardisation have encouraged farmers to simplify their management practices and distribute concentrate all year round to enable high and steady production, without taking the quality of the forage available into account (Veysset et al., Reference Veysset, Lherm, Bébin and Roulenc2014). Including higher proportions of forage in the diet constitutes a possible path to reduce the use of concentrates without decreasing the output level. It could be achieved through the optimisation of forage and grassland management, and by avoiding losses during grazing, harvesting, preservation and feeding (Meul et al., Reference Meul, Passel, Fremaut and Haesaert2012). Havet et al. (Reference Havet, Coquil, Fiorelli, Gibon, Martel, Roche, Ryschawy, Schaller and Dedieu2014) mentioned as an example the use of grassland calendars with a visual assessment of the grass height to optimise the management of grass quality during rotational grazing. They also refer to research on leader and follower grazing systems aiming to decrease the grazing of refusals by dairy cows and assign them to animals with low dietary requirements. However, despite better performance of more autonomous farms, breaking away from existing routines needs specific management skills and requires social influences (e.g. objectives of extension services and organisation of the dairy industry) to be overcome (Meul et al., Reference Meul, Passel, Fremaut and Haesaert2012; Veysset et al., Reference Veysset, Lherm, Bébin and Roulenc2014).
Evolution in a changing context
Input self-sufficiency has often been considered as interesting to promote farm sustainability, faced with an increase in energy and input costs (López-Ridaura et al., Reference López-Ridaura, Masera and Astier2002; Bernués et al., Reference Bernués, Ruiz, Olaizola, Villalba and Casasús2011; Ripoll-Bosch et al., Reference Ripoll-Bosch, Díez-Unquera, Ruiz, Villalba, Molina, Joy, Olaizola and Bernués2012). In addition, Raveau (Reference Raveau2011) found that when product prices increased, as in 2007, autonomous farms had more latitude for increasing their production, through increasing the use of inputs. They could, therefore, benefit more from these increased prices. As far as we know, no paper dealt with the role of input self-sufficiency in a context of decrease in milk price, as observed between 2008 and 2009. Our results underline that Auto−− farms are less affected by the decrease in milk price. First, they have greater leeway for reducing the variable costs by decreasing the use of concentrates without decreasing strongly the milk production. A strategy of input substitution – that is, the use of less expensive input – may also have been implemented simultaneously; however, we did not have the appropriate data to test this assumption. However, according to a perception survey, farmers and consultants would rather envisage rationalising concentrate purchase and optimising forage and grass production to decrease feed costs (Association Wallonne de l’Elevage, 2012). Second, the milk crisis involved a levelling out of prices among classes in 2009, explaining the sharper price decrease for Auto++. Despite these evolutions, the farms having little autonomy kept in average lower gross operating surplus per familial work unit in 2009.
Organic farming and EA
It was already stated that input self-sufficiency is a crucial aspect to guarantee the economic viability of organic farming systems due to the high price of organic inputs, especially concentrates (Lherm and Benoit, Reference Lherm and Benoit2003). As established in our study, input self-sufficiency in organic farms is achieved through the greater use of on-farm resources and the non use of mineral fertilisers and pesticides, thereby leading to a low environmental impact per hectare (Hansen et al., Reference Hansen, Alrøe and Kristensen2001; Paccard et al., Reference Paccard, Capitain and Farruggia2003). Our brief comparison between organic and conventional Auto++ farms shows that organic farming provides economic benefits in a situation of milk price decrease. In 2009, organic farms kept a stable income per work unit because of a smaller milk price decrease. However, although high EA levels in conventional farms do not involve strong structural adaptations, the organic production method is associated with extensive practices – that is, low yields and stocking rate.
Limitations and perspectives
Our results provide new insights about the benefit of increasing input self-sufficiency in the context of a transition towards more sustainable farming systems. In this respect, however, our work shows several limitations and should be broadened in several respects. First, the EA indicator has two main drawbacks with respect to its ability to assess input self-sufficiency. On the one hand, this indicator is based on economic values and therefore varies according to input and milk prices. These variations may skew the estimation of relative amounts of inputs used by the farms. However, input prices could be considered to be homogeneous among conventional farms, as they have access to the same economic market and resources. In addition, the impact of milk price variations on the EA indicator was found to be negligible for conventional farms (data not shown). On the other hand, EA constitutes an indicator of economic efficiency. Consequently, the use of this indicator could lead to consider economically efficient farms as those that are input self-sufficient whereas they use a lot of inputs, and vice-versa (Raveau, Reference Raveau2011). However, we found that, for a subsample of 205 farms fully specialised in dairy production, EA was highly correlated with the variable costs per 1000 l (−0.77, Pearson test P<0.001). Therefore, farms with a higher EA degree used fewer inputs for the same milk production and similar input prices.
Second, we performed an analysis based on the comparison among farms for a specific case study. Focussing on specialised farms did not allow us to study the interest in diversifying farming activities to increase input self-sufficiency. In fact, input self-sufficiency is usually associated with the diversification of farm activities in order to perform synergies and exchanges (Vilain, Reference Vilain2008). For instance, a mixed farm could increase its self-sufficiency by using manure for the crops or by producing animal feedstuff on the farm (Bonny, Reference Bonny2010; Bell and Moore, Reference Bell and Moore2012). On the other hand, although this work highlighted interesting findings in the scope of farm sustainability, it provides information about one type of production within a specific agro-ecological context. Our results cannot be directly applied to other contexts. This analysis should consequently be broadened to explore other types of production – for example, more diversified farming systems – within various agro-ecological contexts. It would provide reference values of EA to the farmers to compare their farm with farms having similar structural constraints and opportunities. In such a benchmarking process, it is crucial to identify practical ways to improve EA in a specific context.
We assessed input self-sufficiency using a farm-level proxy. The farm scale is the main management level and economic unit, at which decisions, strategic choices and technical actions are performed by the farmer to produce goods and services (Lebacq et al., Reference Lebacq, Baret and Stilmant2013; Botreau et al., Reference Botreau, Farruggia, Martin, Pomiès and Dumont2014). At this level, such actions could allow the farmer to improve the economic and environmental sustainability of the farm. Like other sustainability attributes, input self-sufficiency could, however, be assessed at higher levels – for example, local, regional or national. Such assessments would consider synergies and exchanges between farms located in the same territory, such as the transfer of forage or manure between crop and livestock enterprises (Bell and Moore, Reference Bell and Moore2012).
This study constitutes a first approach to analyse the impact of input self-sufficiency on the evolution of farm sustainability. The use of 2-year data did not allow us to take the inter-annual variability of data into account. Moreover, the use of farm accounting data involves possible overlaps of processes – for example, variation of prices and volumes – and contextual changes – for example, decrease in milk price, increase in input price and impact of climate events. Consequently, to further investigate this dynamic approach, long-term studies should be performed through farm network monitoring over a long period. In this context, more detailed data should be collected to enable fine-grained analyses in terms of processes and contextual changes, and to take social aspects – for example, labour, into account. Such long-term studies could explore the extent to which input self-sufficiency supports farm development and constitutes the core for long-term action (Havet et al., Reference Havet, Coquil, Fiorelli, Gibon, Martel, Roche, Ryschawy, Schaller and Dedieu2014).
Conclusion
Input self-sufficiency is usually considered as a key aspect to promote sustainable farming systems. In this study, we used the EA indicator to assess input self-sufficiency of specialised dairy farms located in the grassland area. We showed that high EA degrees in conventional farms could be favoured by high proportions of permanent grassland in the AA. Owing to an efficient input use (especially in terms of animal feeding), the most autonomous farms combine a low environmental impact with good economic results. In the context of milk price decrease, the least autonomous conventional farms have greater leeway for reducing input use, without decreasing milk production, and thereby maintaining a stable income level. Despite this latitude, these farms have a lower income compared with more autonomous ones. In this context, organic farms have a stable income because of a slighter decrease in the organic milk price. This dynamic approach should be further investigated through long-term studies in order to consider inter-annual variability and various types of contextual changes.
Acknowledgements
The first author is a recipient of a PhD grant financed by the ‘Fonds pour la formation à la Recherche dans l’Industrie et dans l’Agriculture’ (FRIA). The authors thank the Agricultural Economic Analysis Department (DAEA) and the Walloon Breeders Association (AWE) for making their data available, as well as three anonymous reviewers for useful comments on earlier versions of the manuscript.
Supplementary material
To view supplementary material for this article, please visit http://dx.doi.org/10.1017/S1751731114002845